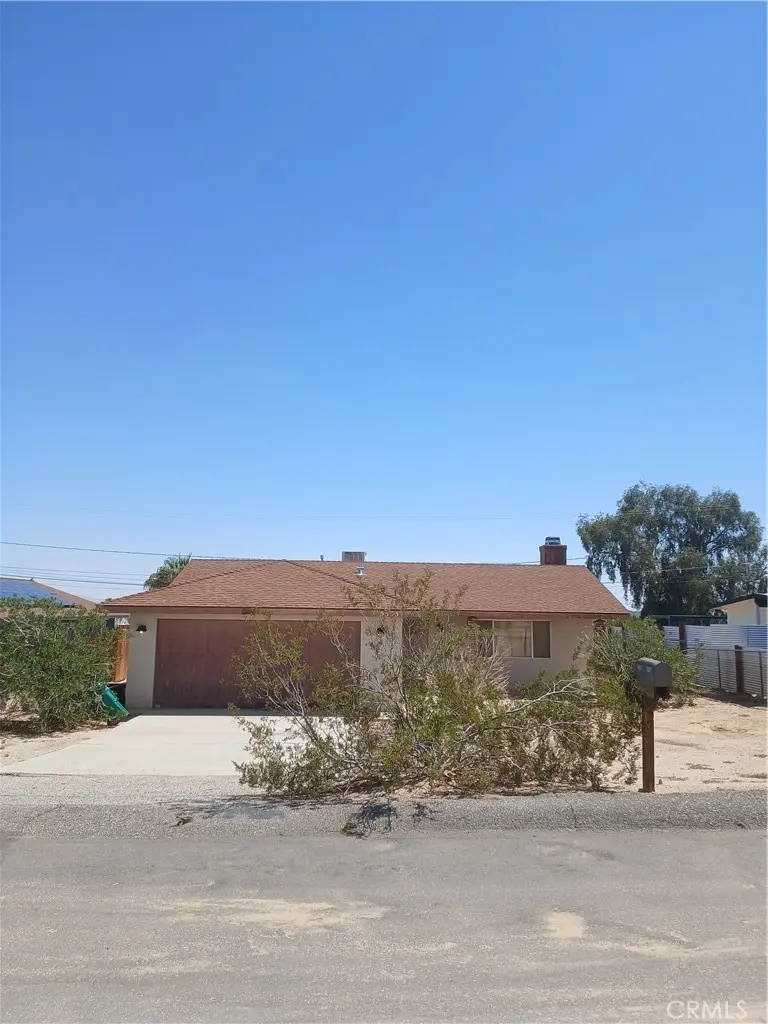
5333 Baileya · Twentynine Palms, CA
Flood risk 1/10 · Minimal
- FEMA flood zone
- X (unshaded)
- Chance of flooding over 30 yrs
- 0.0%
- Est. flood insurance / yr
- $507 – $1,088
Fire risk 1/10 · Minimal
- Est. fire insurance / yr
- $659 – $1,223
Heat risk 8/10 · Major
- Hot days now (above 108°F)
- 7 days/yr
- Hot days in 30 yrs
- 19 days/yr
Wind risk 1/10 · Minimal
- Chance of severe wind over 30 yrs
- —
Air-quality risk 5/10 · Moderate
- Unhealthy air days now
- 8 days/yr
- Unhealthy air days in 30 yrs
- 10 days/yr
Risk factors via First Street. Map © Google.
Why this score? — see what drove the C grade
The composite is a weighted blend of 9 inputs, each scored 0–100. Each bar is that input's sub-score; the figure is the points it added to the 100-point composite (weight × sub-score).
- Cash flow +21.4/30.0
- ARV discount +15.0/15.0
- DSCR +6.8/10.0
- 1% rule +5.0/10.0
- Rent growth +3.6/5.0
- Livability +3.0/5.0
- Condition / age +2.5/5.0
- Schools +2.2/10.0
- Appreciation +0.0/10.0
$199,900
🖨 Deal sheet 📄 Offer letter ✓ Due diligence
Listing remarks
This single story full authority probate sale is a great starter home with the right buyer with a little elbow grease and some extra funds to get it the way you want it! Only serious buyers considered and may not finance due to its current condition. Arrange for a showing ASAP to get the deal of a lifetime!
Key facts
- 8,775 sq ft lot
- 2 garage spots
- Built 1990
Neighborhood map
What this means for you Summary
Snapshot
- This is a 3-bed/2.0-bath single-family listed at $200k.
Deal economics
- At list price, monthly cash flow is $297 ($4k/yr) — positive.
- The deal already cash-flows at list — no discount required.
- Meets the 1% rule at list price ($2k rent vs $200k).
- Recommended offer: $197k (1.5% below list) — sets the bar for market timing.
- Cap rate 8.1% vs local median 4.3% in Twentynine Palms — top-decile yield for the area; either an underpriced asset or a hidden risk that comps aren't pricing in. Stress-test before assuming the spread holds.
Location & tenants
- Location reads 59/100 on livability (#622 in CA) — a working-class tenant base; expect higher turnover. Strengths: commute A+, housing A+; Watch: schools D, amenities F, employment D-.
- Morongo Unified (town): math 15% / reading 38% proficiency, ranked #395 of 517 in CA (top 76%) — low school quality limits family demand, transient renter base, plan for 1-2y turnover.
- Market conditions: Rents rising fast (+4.5%/yr); 734 active listings in the ZIP; 12 comparable units currently listed for rent nearby; rentals leasing fast (median 13d on market — plan ~1-2 weeks tenant-placement turnaround); 5,458 units permitted in San Bernardino County in 2024 (1,500 in 5+ unit buildings).
- This rent runs 39% of the median local income ($61k/yr) — at the standard rent-burdened threshold; future hikes will face affordability resistance.
Forward outlook
- Local home prices are declining (-3.0%/yr); year-one equity from $1k of loan paydown is wiped out by about $6k of value loss. Plan a longer hold.
- San Bernardino County population projected at +15% by 2050 — modest demand growth; plan on rents tracking national, not racing it.
Negotiation context
- It's been on market 21 days — a 2% lower offer ($197k) is reasonable based on typical stale-listing flexibility.
- 2 sale attempts with the ask held roughly flat each time — persistent listings suggest the price (not the market) is what's stuck; bring a comps-based counter.
Risks & watch-outs
- Climate carrying-cost: extreme-heat days projected 7→19/yr by 2055 (HVAC capex compounding) — expect insurance premiums to compound above CPI over the hold.
Questions for the listing agent
- Is there a deadline driving the sale (1031 exchange, divorce, estate, relocation)? That informs how much negotiation room exists.
- Schools are D-rated, which usually means shorter tenancies and higher turnover. Who's the typical renter profile here, and what's been the actual vacancy rate?
- What's the average days-on-market for RENTAL listings here right now (not sales)? A rising rental-DOM trend means longer vacancies and softer asking-rent achievability than the comps imply.
- What's the recent tenant-quality profile in this submarket — average credit score on applications, eviction rate, late-payment / NSF rate, and stable-employment percentage? A property-management company in the area should have these aggregated.
- How much new for-sale + rental construction is in the pipeline within 1–3 miles? Heavy new supply typically softens prices + rents 12–24 months out; constrained supply supports both.
Investment metrics
- 1% rule
- 1.00% ✓
- Cap rate
- 8.08%
- Cash-on-cash
- 6.37%
- DSCR
- 1.28
- GRM
- 8.3
CMA / ARV
- ARV (median comp)
- $285,943
- List price
- $199,900
- Delta
- -30.06%
- Verdict
- UNDERPRICED
- Comps
- 20 within 1.0 mi
Show comp detail 12 sales within ~0.75 mi
| Address | Dist | Beds/Ba | Sqft | Sold | Price | $/sf | Match |
|---|---|---|---|---|---|---|---|
| 71915 Samarkand Dr | 0.07mi | 3/2.0 | 1,260 (-4%) | 7mo | $295,000 | $234 | 83 |
| 5464 Mariposa | 0.28mi | 3/2.0 | 1,293 (-2%) | 6mo | $235,000 | $182 | 79 |
| 5474 Cahuilla Ave | 0.23mi | 3/2.0 | 1,238 (-6%) | 1mo | $295,000 | $238 | 78 |
| 5564 Mariposa | 0.36mi | 3/2.0 | 1,269 (-4%) | 4mo | $284,000 | $224 | 74 |
| 5629 Cahuilla Ave | 0.42mi | 3/2.0 | 1,344 (+2%) | 14mo | $286,000 | $213 | 66 |
| 5447 Encelia Dr | 0.24mi | 3/1.0 | 1,224 (-7%) | 9mo | $240,000 | $196 | 65 |
| 5616 Cahuilla Ave | 0.38mi | 4/2.0 (+1) | 1,405 (+6%) | 4mo | $305,000 | $217 | 63 |
| 5304 Morongo Rd | 0.28mi | 3/2.0 | 1,470 (+11%) | 6mo | $259,000 | $176 | 63 |
| 5444 Daisy Ave | 0.22mi | 3/1.0 | 1,132 (-14%) | 0mo | $192,000 | $170 | 62 |
| 5481 Abronia Ave | 0.20mi | 3/2.0 | 1,475 (+12%) | 16mo | $320,000 | $217 | 58 |
| 5374 Cahuilla Ave | 0.16mi | 3/2.0 | 1,134 (-14%) | 13mo | $265,000 | $234 | 58 |
| 5528 Daisy Ave | 0.30mi | 3/2.0 | 1,143 (-13%) | 14mo | $233,900 | $205 | 52 |
Match score weights: distance 35% · size 25% · config 20% · recency 20%. Top-matched comps best support the ARV.
Projected returns pro-forma
-3.0% appreciation · 4.45% rent growth · sell at horizon
- IRR
- -5.0%
- Equity multiple
- 0.81×
- Total profit
- $-10,535
- Equity at exit
- $29,806
- IRR
- 6.2%
- Equity multiple
- 1.49×
- Total profit
- $27,590
- Equity at exit
- $17,284
Cash invested: $55,972 (down + closing). Projections, not guarantees.
Landlord ↔ Tenant lean methodology
- Overall (STATE)
- 18 Strongly Tenant-Friendly
- State California
- 18 Strongly Tenant-Friendly · D+13
- County
- — inherits STATE
- City
- — inherits STATE
ZIP-level market 92277
- Home prices YoY
- -3.1%
- Rents YoY
- 4.5%
- Active inventory
- 734
- Price-to-rent
- 8.3×
Monthly cashflow live
- Estimated rent
- $2,001 high interval (Pro) →
- Mortgage (P&I)
- −$1,048
- Tax from tax record
- −$152 /mo · $1,821/yr
- Insurance
- −$83
- HOA
- −$0
- Vacancy / Maint / Mgmt
- −$420
- Net cashflow
- $297
Break-even live
UW: 25.0% down · 7.5% · 30yr · 1.5% tax · 5.0% vac · 8.0% maint · 8.0% mgmt
Financing live
Cash to close
- Down payment
- $49,975
- Closing costs
- $5,997
- Reserves months
- —
- Total cash needed
- —
Loan-product check · same deal, 3 products live
Conventional
25% down · 7.5% · 30yr
- Down + closing
- —
- Monthly P&I
- —
- Monthly cashflow
- —
- DSCR
- —
- Eligible?
- —
Personal DTI + credit; lowest rate.
DSCR
20% down · 8.5% · 30yr
- Down + closing
- —
- Monthly P&I
- —
- Monthly cashflow
- —
- DSCR
- —
- Eligible?
- —
No personal income docs; deal must DSCR.
Hard money
10% down · 12.0% · 12mo
- Down + closing
- —
- Monthly P&I
- —
- Monthly cashflow
- —
- DSCR
- —
- Eligible?
- —
Short-term bridge; refi at stabilization.
Rent comps 12 comps
| Address | Beds | Baths | Sqft | Rent | $/sqft | DOM | Units | Dist |
|---|---|---|---|---|---|---|---|---|
| 5415 Lupine Ave Twentynine Palms, CA | 3.0 | 2.0 | 1414 | $2,400 | $1.70 | 43d | 1 | 0.16mi |
| 5575 Encelia Dr Unit 29 Twentynine Palms, CA | 4.0 | 2.5 | 1496 | $2,095 | $1.40 | 1d | 1 | 0.33mi |
| 71745 Sunnyslope Dr Twentynine Palms, CA | 2.0 | 2.0 | 912 | $1,600 | $1.75 | 43d | 1 | 0.75mi |
| 5995 Encelia Dr Twentynine Palms, CA | 3.0 | 2.0 | 1235 | $2,499 | $2.02 | 4d | 1 | 0.83mi |
| 72256 Sunnyslope Dr Twentynine Palms, CA | 2.0 | 1.0 | 896 | $1,350 | $1.51 | 12d | 1 | 0.87mi |
| 5930 Regino Ave Unit 29 Twentynine Palms, CA | 3.0 | 2.0 | 1314 | $1,700 | $1.29 | 5d | 1 | 0.90mi |
| 72211 Sunnyvale Dr Twentynine Palms, CA | 2.0 | 1.0 | 998 | $1,500 | $1.50 | 3d | 1 | 0.92mi |
| 72255 Sunnyvale Dr Twentynine Palms, CA | 3.0 | 1.5 | 1187 | $1,600 | $1.35 | 24d | 1 | 0.95mi |
| 71593 Sunflower Dr Twentynine Palms, CA | 3.0 | 2.0 | 1314 | $1,995 | $1.52 | 12d | 1 | 0.95mi |
| 6182 Mojave Ave Twentynine Palms, CA | 2.0 | 1.0 | 998 | $1,300 | $1.30 | 24d | 1 | 1.04mi |
| 72548 Sunnyslope Dr Twentynine Palms, CA | 3.0 | 2.0 | 1647 | $2,150 | $1.31 | 4d | 1 | 1.10mi |
| 72949 Siesta Dr Twentynine Palms, CA | 3.0 | 1.5 | 1380 | $2,350 | $1.70 | 3d | 1 | 1.41mi |
Listing history 21 events
-
2026-06-18days on market $199,900 Active 21 DOM
-
2026-06-17days on market $199,900 Active 20 DOM
-
2026-06-16days on market $199,900 Active 19 DOM
-
2026-06-15days on market $199,900 Active 18 DOM
-
2026-06-13days on market $199,900 Active 16 DOM
-
2026-06-13days on market $199,900 Active 15 DOM
-
2026-06-09days on market $199,900 Active 12 DOM
-
2026-06-08days on market $199,900 Active 11 DOM
-
2026-06-07days on market $199,900 Active 10 DOM
-
2026-06-04days on market $199,900 Active 7 DOM
-
2026-06-03days on market $199,900 Active 6 DOM
-
2026-06-02days on market $199,900 Active 5 DOM
-
2026-06-01days on market $199,900 Active 4 DOM
-
2026-05-31days on market $199,900 Active 3 DOM
-
2026-05-02historical
-
2026-04-28price $199,999
-
2025-12-04$209,900 Active
-
2025-11-30historical
-
2025-10-11price $209,900
-
2025-09-07price $219,900
-
2025-08-30$350,000 Active
ⓘ Source: listings_history table (triggers on properties + properties_extension) + one-shot
backfill from property_details.listing_events for pre-trigger history.
Tax reassessment forecast CA · Resets to sale price
- Current annual tax
- $1,821 · $152/mo
- Projected year-2 tax
- $1,821 · $152/mo
- Expected delta
- $0/yr ($0/mo · 0.0%)
ⓘ Screening estimate from a state-policy table — verify with the county assessor before closing.
Climate risk First Street
- Flood 1/10 Low FEMA zone X (unshaded) · 0% chance over 30 yrs
- Wildfire 1/10 Low
- Heat 8/10 Severe 7 d/yr ≥108°F today · 19 d/yr by 30 yrs out
- Wind 1/10 Low
- Air quality 5/10 Major 8 unhealthy d/yr today · 10 by 30 yrs out
Nearby sold comps map
Loading sold comps map…
Walkable amenities ~0.75 mi
Loading nearby amenities…
Taxation est. · year 1
- Rental income
- $24,008
- − Mortgage interest
- −$11,198
- − Property taxes
- −$1,821
- − Insurance
- −$1,000
- − Repairs & maintenance
- −$1,921
- − Management
- −$1,921
- − Depreciation
- −$5,815
- Taxable income
- $333
- Est. tax owed @ 24.0%
- −$80
- After-tax cash flow
- $3,486/yr
For passive investors: Depreciation is non-cash, so a rental often shows a tax loss while cash-flowing — sheltering income. Rental losses are passive: they offset passive income freely, and up to $25,000/yr can offset ordinary (W-2) income if you actively participate and your MAGI is under $100k (phasing out to $0 by $150k); unused losses carry forward. On sale, claimed depreciation is recaptured at up to 25%, and gains may owe capital-gains tax (a 1031 exchange can defer both). Figures are a year-1 estimate at your 24.0% rate — not tax advice; consult a CPA.
Schools (NCES district)
- District
- Morongo Unified
- NCES district ID
- 0625860
- Math proficiency
- 15% ▼ -12.00%
- Reading proficiency
- 38% ▼ -3.00%
- Median HH income
- $39,399
- Composite
- 22.19/100
- National rank
- #8156
- State rank
- #395 of 517 in CA
Livability — Twentynine Palms
- Score
- 59/100
- State rank
- #622
- US rank
- #19731
Category grades
Schools grade is shown separately in the Schools card above.
Census & demographics
- Census place
- Twentynine Palms, CA
- County
- San Bernardino County · 2,030,291 people
- City population
- 26,277
- Metro
- Riverside-San Bernardino-Ontario, CA
- Population (ZIP)
- 26,277
- Household income
- $60,901
- Rent vs Own
- Severe rent burden
- 1057.0
Population outlook (San Bernardino County) Hauer SSP2
- Today (2025)
- 2,300,329 people
- By 2030
- 2,378,907 · +3.4%
- By 2040
- 2,523,137 · +9.7%
- By 2050
- 2,642,388 · +14.9%
- By 2075
- 2,880,769 · +25.2%
- By 2100
- 2,909,436 · +26.5%
Race, ethnicity, and origin ACS 2023
- Neighborhood character
- Diverse neighborhood (Simpson 0.70)
- Race & ethnicity
- White 49% Two or more races 24% Hispanic / Latino 24% Black 9% Asian 4% Pacific Islander 1% Native American 1%
- Hispanic origin (detail)
- Mexican 20%
- Common ancestry
- Italian 5% Lithuanian 3% Slovak 3%
- Foreign-born
- 9% · Canada, China, South Korea
- Languages at home
- 81% English-only · Spanish 12% Other Asian/Pacific 2% Tagalog/Filipino 1%
Political lean MEDSL · San Bernardino
- 2024 margin
- Toss-up / Even · D 47.5% · R 49.7% · Other 2.8%
- 2008→2024 swing
- -8.5pp toward R · 2008: 6.3pp · 2024: -2.1pp
- All cycles
- 2024: R+2.1 2020: D+10.7 2016: D+9.8 2012: D+5.4 2008: D+6.3
Not yet ingested
- Civics
- —
Market trends
- HPI YoY
- ▼ -12.15%
- Current HPI
- 380.5083
- Rent YoY
- ▲ 4.45%
- Metro
- Riverside-San Bernardino-Ontario, CA
- State GDP YoY
- ▲ 3.21%
- F500 in state
- 116
Industry mix (Fortune 500 HQ in CA)
| Industry | F500 HQs | Revenue |
|---|---|---|
| Technology | 27 | $1,492B |
|
||
| Financial Services | 3 | $174B |
|
||
| Retail | 3 | $44B |
|
||
| Insurance | 3 | $26B |
|
||
| Media / Entertainment | 2 | $115B |
|
||
| Pharmaceuticals / Biotech | 2 | $62B |
|
||
Price history
-42.9% since first listed7 events — show timeline
- 2026-05-02 Listing Removed — CRMLS
- 2026-04-28 Price Changed $199,999 CRMLS
- 2025-12-04 Listed $209,900 CRMLS
- 2025-11-30 Listing Removed — CRMLS
- 2025-10-11 Price Changed $209,900 CRMLS
- 2025-09-07 Price Changed $219,900 CRMLS
- 2025-08-30 Listed $350,000 CRMLS
Property tax history
+2.3%/yrLatest (2025): $1,821 · +6.0% YoY. Source: county tax records.
Cash-flow waterfall
monthlySold comps — $/sqft
last 12 mo · ≤1 miLoading sold comps…