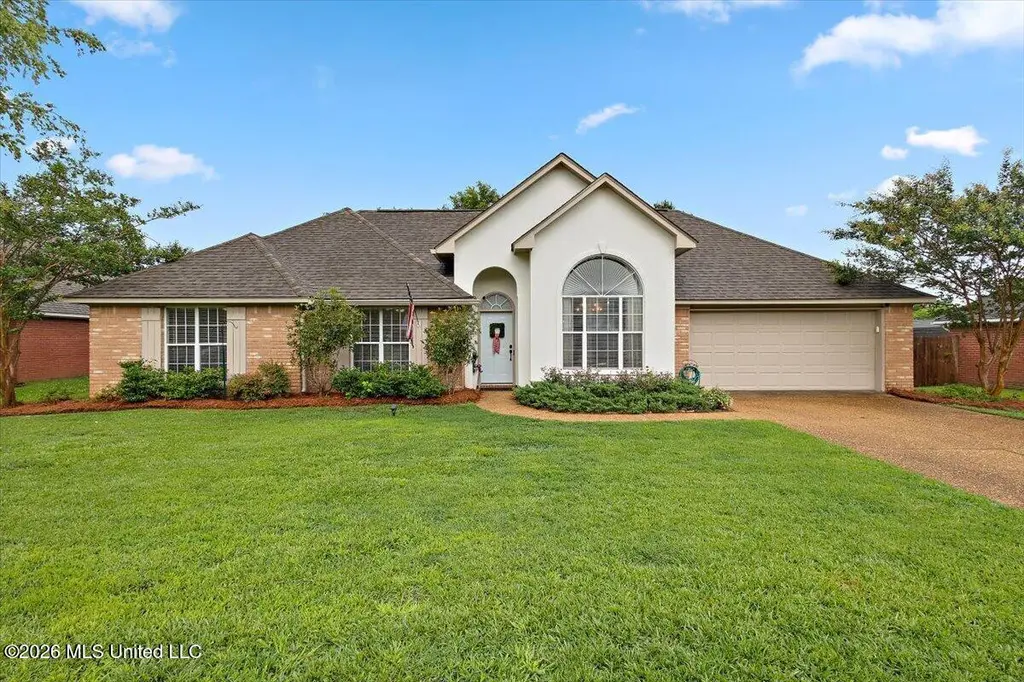
102 Avon Cv · Madison, MS
Flood risk 1/10 · Minimal
- FEMA flood zone
- X (unshaded)
- Chance of flooding over 30 yrs
- 0.0%
- Est. flood insurance / yr
- $507 – $1,088
Fire risk 2/10 · Minimal
- Est. fire insurance / yr
- $1,241 – $2,305
Heat risk 7/10 · Major
- Hot days now (above 108°F)
- 7 days/yr
- Hot days in 30 yrs
- 20 days/yr
Wind risk 7/10 · Major
- Chance of severe wind over 30 yrs
- 78.0%
Air-quality risk 2/10 · Minimal
- Unhealthy air days now
- 0 days/yr
- Unhealthy air days in 30 yrs
- 1 days/yr
Risk factors via First Street. Map © Google.
Why this score? — see what drove the D grade
The composite is a weighted blend of 9 inputs, each scored 0–100. Each bar is that input's sub-score; the figure is the points it added to the 100-point composite (weight × sub-score).
- Cash flow +17.2/30.0
- DSCR +5.4/10.0
- Schools +4.8/10.0
- Livability +4.0/5.0
- 1% rule +3.7/10.0
- Rent growth +3.2/5.0
- ARV discount +2.5/15.0
- Condition / age +2.5/5.0
- Appreciation +0.0/10.0
$315,000
🖨 Deal sheet 📄 Offer letter ✓ Due diligence
Listing remarks
Welcome home to immaculate perfection in Fairfield! This well-loved split-plan home offers the perfect blend of comfort, function, and style. The spacious living area with a fireplace flows beautifully into the dining area, creating a warm and inviting space for everyday living and entertaining. The generous primary suite features a private ensuite bath with dual vanities, creating a relaxing retreat at the end of the day. The kitchen is designed for gathering, complete with an island, abundant storage, and plenty of workspace for cooking and entertaining. Step outside to a backyard made for relaxing evenings or hosting family and friends. The remaining bedrooms are nicely sized and have a
Key facts
- Dual vanities
- Spacious living area
- Kitchen island
Tags
Property features AI
Finance
- HOA & community: Homeowners association with grounds maintenance included
Exterior
- Parking: 2-car garage with the garage facing the front
- Utilities: Public water; Public sewer; Electricity connected; Natural gas connected
- Home design: Single-family house; One level; Move-in ready
- Construction: Brick and stucco exterior; Architectural shingle roof; Slab foundation; Built (year per public records)
- Exterior features: Back yard fence; Clubhouse and pool in the community
Interior
- Kitchen: Built-in electric range; Dishwasher; Microwave
- Bathrooms: 2 full bathrooms
- Heating & cooling: Central heating (natural gas); Fireplace heating; Central air conditioning (electric and gas)
- Interior features: High ceilings; Fireplace
- Laundry & utility: Gas water heater
Neighborhood map
What this means for you Summary
Snapshot
- This is a 4-bed/4.0-bath single-family listed at $315k.
Deal economics
- At list price, monthly cash flow is $224 ($3k/yr) — positive.
- The deal already cash-flows at list — no discount required.
- To meet the 1% rule (rent ≥ 1% of price), the offer needs to be $275k (12.8% below list).
- Recommended offer: $275k (12.8% below list) — sets the bar for 1% rule.
- Cap rate 7.1% vs local median 3.7% in Madison — top-decile yield for the area; either an underpriced asset or a hidden risk that comps aren't pricing in. Stress-test before assuming the spread holds.
Location & tenants
- Location reads 81/100 on livability (#4 in MS, #1,556 nationally) — a professional / high-income tenant draw. Strengths: crime A+, employment A+, housing A+; Watch: amenities D-, commute F.
- Madison County School District (rural): math 54% / reading 54% proficiency, ranked #3 of 130 in MS (top 2%) — acceptable for families but not a draw, mixed tenant base, ~2y average lease.
- Zoned schools: Madison Station Elementary School (math 76% / reading 75%, grade A, #4 of 375 statewide, top 1%, 1,035 students, 100% FRL); Madison Middle School (math 66% / reading 57%, grade B+, #6 of 179 statewide, top 3%, 1,154 students, 100% FRL); Madison Central High School (math 5% / reading 63%, grade F, #78 of 197 statewide, top 39%, 1,246 students, 100% FRL) — zoned schools average 100% FRL vs 29% district-wide (70 pts higher); higher-poverty schools than district average — tighter screening recommended.
- Market conditions: Rents rising (+2.6%/yr); 628 active listings in the ZIP; high-income renter base; 553 units permitted in Madison County in 2024 (0 in 5+ unit buildings).
Forward outlook
- Local home prices are declining (-3.0%/yr); year-one equity from $2k of loan paydown is wiped out by about $9k of value loss. Plan a longer hold.
- Madison County population projected at +34% by 2050 — long-run rental-demand tailwind backs the buy-and-hold thesis.
Negotiation context
- Only 2 days on market — expect competitive offers; lowballing is unlikely to land.
Risks & watch-outs
- Climate carrying-cost: major wind risk, 78% chance of damaging wind over 30y; extreme-heat days projected 7→20/yr by 2055 (HVAC capex compounding) — expect insurance premiums to compound above CPI over the hold.
Questions for the listing agent
- What does the HOA fee cover, when was the last increase, and are there any pending special assessments or reserve-fund shortfalls?
- Is there a deadline driving the sale (1031 exchange, divorce, estate, relocation)? That informs how much negotiation room exists.
- Schools are A-rated — typically a magnet for longer-tenancy family renters. What's the average tenant stay here, and is there a school-zone premium baked into asking?
- The area grade is low — what's the realistic commute time and amenity access for the typical tenant pool here? Any planned neighborhood developments (good or bad) we should know about?
- What's the average days-on-market for RENTAL listings here right now (not sales)? A rising rental-DOM trend means longer vacancies and softer asking-rent achievability than the comps imply.
- What's the recent tenant-quality profile in this submarket — average credit score on applications, eviction rate, late-payment / NSF rate, and stable-employment percentage? A property-management company in the area should have these aggregated.
- How much new for-sale + rental construction is in the pipeline within 1–3 miles? Heavy new supply typically softens prices + rents 12–24 months out; constrained supply supports both.
Investment metrics
- 1% rule
- 0.87% ✗
- Cap rate
- 7.14%
- Cash-on-cash
- 3.04%
- DSCR
- 1.14
- GRM
- 9.6
CMA / ARV
- ARV (on-the-fly)
- $283,578
- Comps found
- 7
Show comp detail 7 sales within ~0.75 mi
| Address | Dist | Beds/Ba | Sqft | Sold | Price | $/sf | Match |
|---|---|---|---|---|---|---|---|
| 151 Stratford Dr | 0.25mi | 4/2.0 | 1,950 (+4%) | 1mo | $312,500 | $160 | 73 |
| 433 Fairfield Dr | 0.07mi | 4/2.5 | 1,937 (+3%) | 17mo | $297,500 | $154 | 71 |
| 302 Chatfield Cv | 0.13mi | 3/2.0 (-1) | 1,729 (-8%) | 3mo | $260,000 | $150 | 66 |
| 105 Concord Pl | 0.34mi | 3/2.0 (-1) | 1,845 (-2%) | 6mo | $294,900 | $160 | 63 |
| 426 Fairfield Dr | 0.12mi | 3/2.5 (-1) | 2,069 (+10%) | 8mo | $310,000 | $150 | 59 |
| 102 Fairfield Cir | 0.17mi | 3/2.0 (-1) | 1,889 (+1%) | 23mo | $285,000 | $151 | 59 |
| 104 Willington Way | 0.19mi | 3/2.0 (-1) | 2,085 (+11%) | 10mo | $312,000 | $150 | 51 |
Match score weights: distance 35% · size 25% · config 20% · recency 20%. Top-matched comps best support the ARV.
Projected returns pro-forma
-3.0% appreciation · 2.61% rent growth · sell at horizon
- IRR
- -11.9%
- Equity multiple
- 0.57×
- Total profit
- $-37,981
- Equity at exit
- $46,968
- IRR
- -3.4%
- Equity multiple
- 0.78×
- Total profit
- $-19,520
- Equity at exit
- $27,235
Cash invested: $88,200 (down + closing). Projections, not guarantees.
Landlord ↔ Tenant lean methodology
- Overall (STATE)
- 90 Strongly Landlord-Friendly
- State Mississippi
- 90 Strongly Landlord-Friendly · R+11
- County
- — inherits STATE
- City
- — inherits STATE
ZIP-level market 39110
- Home prices YoY
- -28.3%
- Rents YoY
- 2.6%
- Active inventory
- 628
- Price-to-rent
- 9.6×
Monthly cashflow live
- Estimated rent
- $2,745 medium interval (Pro) →
- Mortgage (P&I)
- −$1,652
- Tax from tax record
- −$133 /mo · $1,599/yr
- Insurance
- −$131
- HOA
- −$29
- Vacancy / Maint / Mgmt
- −$577
- Net cashflow
- $224
Break-even live
UW: 25.0% down · 7.5% · 30yr · 1.5% tax · 5.0% vac · 8.0% maint · 8.0% mgmt
Financing live
Cash to close
- Down payment
- $78,750
- Closing costs
- $9,450
- Reserves months
- —
- Total cash needed
- —
Loan-product check · same deal, 3 products live
Conventional
25% down · 7.5% · 30yr
- Down + closing
- —
- Monthly P&I
- —
- Monthly cashflow
- —
- DSCR
- —
- Eligible?
- —
Personal DTI + credit; lowest rate.
DSCR
20% down · 8.5% · 30yr
- Down + closing
- —
- Monthly P&I
- —
- Monthly cashflow
- —
- DSCR
- —
- Eligible?
- —
No personal income docs; deal must DSCR.
Hard money
10% down · 12.0% · 12mo
- Down + closing
- —
- Monthly P&I
- —
- Monthly cashflow
- —
- DSCR
- —
- Eligible?
- —
Short-term bridge; refi at stabilization.
HOA detail
- Monthly dues
- $29 · $348/yr
Listing history 4 events
-
2026-05-21$315,000 Active
-
1998-08-05soldstatus
-
1996-11-04soldstatus
-
1996-05-10soldstatus
ⓘ Source: listings_history table (triggers on properties + properties_extension) + one-shot
backfill from property_details.listing_events for pre-trigger history.
Tax reassessment forecast MS · Resets to sale price
- Current annual tax
- $1,599 · $133/mo
- Projected year-2 tax
- $2,489 · $207/mo
- Expected delta
- +$890/yr (+$74/mo · 55.6%)
ⓘ Screening estimate from a state-policy table — verify with the county assessor before closing.
Climate risk First Street
- Flood 1/10 Low FEMA zone X (unshaded) · 0% chance over 30 yrs
- Wildfire 2/10 Low
- Heat 7/10 Severe 7 d/yr ≥108°F today · 20 d/yr by 30 yrs out
- Wind 7/10 Severe 78% chance of damaging wind over 30 yrs
- Air quality 2/10 Low 0 unhealthy d/yr today · 1 by 30 yrs out
Nearby sold comps map
Loading sold comps map…
Walkable amenities ~0.75 mi
Loading nearby amenities…
Taxation est. · year 1
- Rental income
- $32,946
- − Mortgage interest
- −$17,645
- − Property taxes
- −$1,599
- − Insurance
- −$1,575
- − Repairs & maintenance
- −$2,636
- − Management
- −$2,636
- − HOA
- −$348
- − Depreciation
- −$9,164
- Taxable loss
- −$2,656
- Est. tax savings @ 24.0%
- +$637
- After-tax cash flow
- $3,320/yr
For passive investors: Depreciation is non-cash, so a rental often shows a tax loss while cash-flowing — sheltering income. Rental losses are passive: they offset passive income freely, and up to $25,000/yr can offset ordinary (W-2) income if you actively participate and your MAGI is under $100k (phasing out to $0 by $150k); unused losses carry forward. On sale, claimed depreciation is recaptured at up to 25%, and gains may owe capital-gains tax (a 1031 exchange can defer both). Figures are a year-1 estimate at your 24.0% rate — not tax advice; consult a CPA.
Schools (NCES district)
- District
- Madison County School District
- NCES district ID
- 2802790
- Math proficiency
- 54% ▼ -7.00%
- Reading proficiency
- 54% ▼ -7.00%
- Median HH income
- $70,579
- Composite
- 48.08/100
- National rank
- #2188
- State rank
- #3 of 130 in MS
Livability — Madison
- Score
- 81/100
- State rank
- #4
- US rank
- #1556
Category grades
Schools grade is shown separately in the Schools card above.
Census & demographics
- Census place
- Madison, MS
- County
- Madison County · 75,005 people
- City population
- 50,443
- Metro
- Jackson, MS
- Population (ZIP)
- 50,443
- Household income
- $125,506
- Rent vs Own
- Severe rent burden
- 227.0
Population outlook (Madison County) Hauer SSP2
- Today (2025)
- 122,509 people
- By 2030
- 131,737 · +7.5%
- By 2040
- 148,930 · +21.6%
- By 2050
- 164,300 · +34.1%
- By 2075
- 197,495 · +61.2%
- By 2100
- 211,429 · +72.6%
Race, ethnicity, and origin ACS 2023
- Neighborhood character
- Predominantly White (76%)
- Race & ethnicity
- White 76% Black 15% Asian 4% Two or more races 3% Hispanic / Latino 2%
- Common ancestry
- Italian 6% Slovak 3% Lithuanian 3%
- Foreign-born
- 5% · China, Canada
- Languages at home
- 92% English-only · Spanish 2% Other Indo-European 2% Chinese 1%
Political lean MEDSL · Madison
- 2024 margin
- R (+17.3) · D 40.8% · R 58.0% · Other 1.2%
- 2008→2024 swing
- -1.7pp toward R · 2008: -15.6pp · 2024: -17.3pp
- All cycles
- 2024: R+17.3 2020: R+11.8 2016: R+16.1 2012: R+15.7 2008: R+15.6
Not yet ingested
- Civics
- —
Market trends
- HPI YoY
- ▼ -60.99%
- Current HPI
- 154.6909
- Rent YoY
- ▲ 2.61%
- Metro
- Jackson, MS
- State GDP YoY
- —
- F500 in state
- 0
Price history
4 events — show timeline
- 2026-05-21 Listed $315,000 MLSU
- 1998-08-05 Sold (Public Records) — Public Records
- 1996-11-04 Sold (Public Records) — Public Records
- 1996-05-10 Sold (Public Records) — Public Records
Property tax history
-1.1%/yrLatest (2025): $1,599 · +0.0% YoY. Source: county tax records.
Cash-flow waterfall
monthlySold comps — $/sqft
last 12 mo · ≤1 miLoading sold comps…