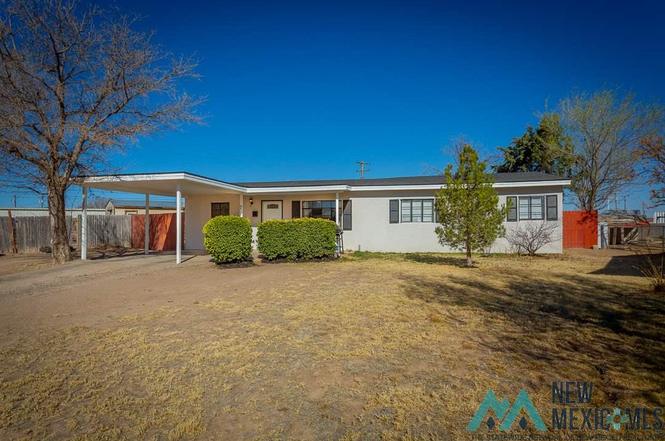
7 Oak Dr · Roswell, NM
Flood risk 1/10 · Minimal
- FEMA flood zone
- X (unshaded)
- Chance of flooding over 30 yrs
- 0.0%
- Est. flood insurance / yr
- $507 – $1,088
Fire risk 7/10 · Major
- Est. fire insurance / yr
- $706 – $1,312
Heat risk 5/10 · Moderate
- Hot days now (above 99°F)
- 7 days/yr
- Hot days in 30 yrs
- 20 days/yr
Wind risk 2/10 · Minimal
- Chance of severe wind over 30 yrs
- —
Air-quality risk 2/10 · Minimal
- Unhealthy air days now
- 1 days/yr
- Unhealthy air days in 30 yrs
- 1 days/yr
Risk factors via First Street. Map © Google.
Why this score? — see what drove the D+ grade
The composite is a weighted blend of 9 inputs, each scored 0–100. Each bar is that input's sub-score; the figure is the points it added to the 100-point composite (weight × sub-score).
- Cash flow +18.0/30.0
- ARV discount +7.5/15.0
- DSCR +5.6/10.0
- 1% rule +3.9/10.0
- Livability +3.8/5.0
- Schools +2.6/10.0
- Rent growth +2.5/5.0
- Condition / age +2.5/5.0
- Appreciation +0.0/10.0
$177,000
🖨 Deal sheet (PDF) 📄 Offer letter ✓ Due diligence
Listing remarks MLS
Nicely updated home with large backyard! This three bedroom one bath home has been updated throughout. An open concept floorplan with generously sized bedrooms, lots of storage, and lots of natural light are some of the things that make this property great! All three bedrooms feature wall to wall carpet and double closets. The backyard features a pergola, storage building, raised beds, and drive through gates for easy access.
Key facts
- Laminate floors
- Updated home
- Spacious dining area
Tags
Neighborhood map
What this means for you Summary
Snapshot
- This is a 4-bed/1.0-bath single-family listed at $177k.
Deal economics
- At list price, monthly cash flow is $152 ($2k/yr) — positive.
- The deal already cash-flows at list — no discount required.
- To meet the 1% rule (rent ≥ 1% of price), the offer needs to be $157k (11.1% below list).
- Recommended offer: $156k (12.0% below list) — sets the bar for market timing.
Location & tenants
- Location reads 75/100 on livability (#8 in NM, #4,339 nationally) — a middle-class / working-renter tenant base. Strengths: commute A+, cost of living A+, housing A+; Watch: employment D, crime F, amenities F.
- Roswell Independent Schools (town): math 11% / reading 52% proficiency, ranked #16 of 29 in NM (top 55%) — families likely to look elsewhere, expect single-tenant / working-renter base with shorter leases; 75% free/reduced lunch — lower-income household profile, screen leases tightly.
- Zoned schools: El Capitan Elementary (math 8% / reading 62%, grade F, #45 of 68 statewide, top 66%, 396 students, 100% FRL); Sierra Middle (math 8% / reading 44%, grade F, #16 of 27 statewide, top 58%, 627 students, 100% FRL); Goddard High (math 32% / reading 52%, grade F, #59 of 110 statewide, top 53%, 1,155 students, 0% FRL).
- Market conditions: 181 active listings in the ZIP; 1 comparable units currently listed for rent nearby; lower-income renter base — watch delinquency; 88 units permitted in Chaves County in 2024 (0 in 5+ unit buildings).
- This rent runs 45% of the median local income ($42k/yr) — at the standard rent-burdened threshold; future hikes will face affordability resistance.
Forward outlook
- Local home prices are declining (-3.0%/yr); year-one equity from $1k of loan paydown is wiped out by about $5k of value loss. Plan a longer hold.
Negotiation context
- It's been on market 190 days — a 12% lower offer ($156k) is reasonable based on typical stale-listing flexibility.
- 3 sale attempts since 5y ago; this cycle's ask is 11700% above the opening price — seller raised mid-cycle; expect resistance to lowballs.
Risks & watch-outs
- Watch-outs: built in 1953 — expect roof / HVAC / electrical / plumbing capex.
- Climate carrying-cost: major wildfire risk; extreme-heat days projected 7→20/yr by 2055 (HVAC capex compounding) — expect insurance premiums to compound above CPI over the hold.
Questions for the listing agent
- It's been on market 190 days. Have you received any prior offers? Is the seller open to a 12% concession, seller financing, or rate buy-down credit?
- Built in 1953 — when were the roof, HVAC, electrical panel, plumbing, and water heater last replaced?
- Why hasn't it sold? Are there any deal-killer items the seller is aware of (foundation, flood, title, zoning, code violations)?
- Is there a deadline driving the sale (1031 exchange, divorce, estate, relocation)? That informs how much negotiation room exists.
- Schools are F-rated, which usually means shorter tenancies and higher turnover. Who's the typical renter profile here, and what's been the actual vacancy rate?
- Crime grade is F in this area — have there been break-ins, vandalism, or insurance claims at this property in the last 3 years? What carrier currently insures it and at what premium?
- The area grade is low — what's the realistic commute time and amenity access for the typical tenant pool here? Any planned neighborhood developments (good or bad) we should know about?
- What's the average days-on-market for RENTAL listings here right now (not sales)? A rising rental-DOM trend means longer vacancies and softer asking-rent achievability than the comps imply.
- What's the recent tenant-quality profile in this submarket — average credit score on applications, eviction rate, late-payment / NSF rate, and stable-employment percentage? A property-management company in the area should have these aggregated.
- How much new for-sale + rental construction is in the pipeline within 1–3 miles? Heavy new supply typically softens prices + rents 12–24 months out; constrained supply supports both.
Investment metrics
- 1% rule
- 0.89% ✗
- Cap rate
- 7.33%
- Cash-on-cash
- 3.69%
- DSCR
- 1.16
- GRM
- 9.4
CMA / ARV
No comps found within radius.
Projected returns pro-forma
-3.0% appreciation · 3.0% rent growth · sell at horizon
- IRR
- -10.5%
- Equity multiple
- 0.62×
- Total profit
- $-19,029
- Equity at exit
- $26,391
- IRR
- -1.3%
- Equity multiple
- 0.91×
- Total profit
- $-4,299
- Equity at exit
- $15,304
Cash invested: $49,560 (down + closing). Projections, not guarantees.
Landlord ↔ Tenant lean methodology
- Overall (STATE)
- 55 Moderately Landlord-Leaning
- State New Mexico
- 55 Moderately Landlord-Leaning · D+3
- County
- — inherits STATE
- City
- — inherits STATE
ZIP-level market 88203
- Home prices YoY
- -34.1%
- Active inventory
- 181
- Price-to-rent
- 9.4×
Monthly cashflow live
- Estimated rent
- $1,574 medium interval (Pro) →
- Mortgage (P&I)
- −$928
- Tax from tax record
- −$89 /mo · $1,071/yr
- Insurance
- −$74
- HOA
- −$0
- Vacancy / Maint / Mgmt
- −$331
- Net cashflow
- $152
Break-even live
Sensitivity live
| Price | -10% $253 | -5% $203 | +0% $152 | +5% $102 | +10% $52 |
|---|---|---|---|---|---|
| Rent | -10% $28 | -5% $90 | +0% $152 | +5% $215 | +10% $277 |
| Rate | -1.0pp $242 | -0.5pp $197 | base $152 | +0.5pp $107 | +1.0pp $60 |
UW: 25.0% down · 7.5% · 30yr · 1.5% tax · 5.0% vac · 8.0% maint · 8.0% mgmt
Financing live
Cash to close
- Down payment
- $44,250
- Closing costs
- $5,310
- Reserves months
- —
- Total cash needed
- —
Loan-product check · same deal, 3 products live
Conventional
25% down · 7.5% · 30yr
- Down + closing
- —
- Monthly P&I
- —
- Monthly cashflow
- —
- DSCR
- —
- Eligible?
- —
Personal DTI + credit; lowest rate.
DSCR
20% down · 8.5% · 30yr
- Down + closing
- —
- Monthly P&I
- —
- Monthly cashflow
- —
- DSCR
- —
- Eligible?
- —
No personal income docs; deal must DSCR.
Hard money
10% down · 12.0% · 12mo
- Down + closing
- —
- Monthly P&I
- —
- Monthly cashflow
- —
- DSCR
- —
- Eligible?
- —
Short-term bridge; refi at stabilization.
Rent comps 1 comps
| Address | Beds | Baths | Sqft | Rent | $/sqft | DOM | Units | Dist |
|---|---|---|---|---|---|---|---|---|
| 613 S Hemlock Ave Roswell, NM | 3.0 | 1.0 | 1078 | $1,150 | $1.07 | 45d | 1 | 0.51mi |
Listing history 10 events
-
2026-05-20$1,500
-
2026-04-10price $177,000
-
2026-03-17price $182,000
-
2025-12-03price $187,000
-
2025-05-16historical $1,400
-
2025-05-08$1,400
-
2021-04-29soldstatus
-
2021-04-27soldstatus 429-char remark
Show marketing remark (429 chars)
Nicely updated home with large backyard! This three bedroom one bath home has been updated throughout. An open concept floorplan with generously sized bedrooms, lots of storage, and lots of natural light are some of the things that make this property great! All three bedrooms feature wall to wall carpet and double closets. The backyard features a pergola, storage building, raised beds, and drive through gates for easy access.
-
2021-03-16$130,000 429-char remark
Show marketing remark (429 chars)
Nicely updated home with large backyard! This three bedroom one bath home has been updated throughout. An open concept floorplan with generously sized bedrooms, lots of storage, and lots of natural light are some of the things that make this property great! All three bedrooms feature wall to wall carpet and double closets. The backyard features a pergola, storage building, raised beds, and drive through gates for easy access.
-
2019-07-30soldstatus
ⓘ Source: listings_history table (triggers on properties + properties_extension) + one-shot
backfill from property_details.listing_events for pre-trigger history.
Tax reassessment forecast NM · Resets to sale price
- Current annual tax
- $1,071 · $89/mo
- Projected year-2 tax
- $1,416 · $118/mo
- Expected delta
- +$345/yr (+$29/mo · 32.2%)
ⓘ Screening estimate from a state-policy table — verify with the county assessor before closing.
Climate risk First Street
- Flood 1/10 Low FEMA zone X (unshaded) · 0% chance over 30 yrs
- Wildfire 7/10 Severe
- Heat 5/10 Major 7 d/yr ≥99°F today · 20 d/yr by 30 yrs out
- Wind 2/10 Low
- Air quality 2/10 Low 1 unhealthy d/yr today · 1 by 30 yrs out
Nearby sold comps map
Loading sold comps map…
Walkable amenities ~0.75 mi
Loading nearby amenities…
Taxation est. · year 1
- Rental income
- $18,891
- − Mortgage interest
- −$9,915
- − Property taxes
- −$1,071
- − Insurance
- −$885
- − Repairs & maintenance
- −$1,511
- − Management
- −$1,511
- − Depreciation
- −$5,149
- Taxable loss
- −$1,151
- Est. tax savings @ 24.0%
- +$276
- After-tax cash flow
- $2,106/yr
For passive investors: Depreciation is non-cash, so a rental often shows a tax loss while cash-flowing — sheltering income. Rental losses are passive: they offset passive income freely, and up to $25,000/yr can offset ordinary (W-2) income if you actively participate and your MAGI is under $100k (phasing out to $0 by $150k); unused losses carry forward. On sale, claimed depreciation is recaptured at up to 25%, and gains may owe capital-gains tax (a 1031 exchange can defer both). Figures are a year-1 estimate at your 24.0% rate — not tax advice; consult a CPA.
Schools (NCES district)
- District
- Roswell Independent Schools
- NCES district ID
- 3502250
- Math proficiency
- 11% ▼ -9.00%
- Reading proficiency
- 52% ▲ 23.00%
- Median HH income
- $38,848
- Composite
- 26.21/100
- National rank
- #7262
- State rank
- #16 of 29 in NM
Livability — Roswell
- Score
- 75/100
- State rank
- #8
- US rank
- #4339
Category grades
Schools grade is shown separately in the Schools card above.
Census & demographics
- Census place
- Roswell, NM
- County
- Chaves County · 56,277 people
- City population
- 56,277
- Metro
- Roswell, NM
- Population (ZIP)
- 28,753
- Household income
- $42,207
- Rent vs Own
- Severe rent burden
- 995.0
Population outlook (Chaves County) Hauer SSP2
- Today (2025)
- 66,122 people
- By 2030
- 66,351 · +0.3%
- By 2040
- 66,818 · +1.1%
- By 2050
- 66,928 · +1.2%
- By 2075
- 65,474 · -1.0%
- By 2100
- 58,943 · -10.9%
Race, ethnicity, and origin ACS 2023
- Neighborhood character
- Predominantly Hispanic (65%)
- Race & ethnicity
- Hispanic / Latino 65% White 31% Two or more races 22% Black 2% Native American 1%
- Hispanic origin (detail)
- Mexican 58%
- Common ancestry
- Slovak 1% Serbian 1% Lithuanian 1%
- Foreign-born
- 12% · Canada
- Languages at home
- 62% English-only · Spanish 38%
Political lean MEDSL · Chaves
- 2024 margin
- Solid R (+44.8) · D 26.8% · R 71.6% · Other 1.6%
- 2008→2024 swing
- -20.2pp toward R · 2008: -24.7pp · 2024: -44.8pp
- All cycles
- 2024: R+44.8 2020: R+41.3 2016: R+36.4 2012: R+32.4 2008: R+24.7
Not yet ingested
- Civics
- —
Market trends
- HPI YoY
- ▼ -78.30%
- Current HPI
- 151.1401
- Rent YoY
- —
- Metro
- Roswell, NM
- State GDP YoY
- —
- F500 in state
- 0
Price history
-98.8% since first listed10 events — show timeline
- 2026-05-20 Listed for Rent $1,500 BUILDIUM
- 2026-04-10 Price Changed $177,000 NMMLS
- 2026-03-17 Price Changed $182,000 NMMLS
- 2025-12-03 Price Changed $187,000 NMMLS
- 2025-05-16 Rental Removed $1,400 BUILDIUM
- 2025-05-08 Listed for Rent $1,400 BUILDIUM
- 2021-04-29 Sold (Public Records) — Public Records
- 2021-04-27 Sold (MLS) — NMMLS
- 2021-03-16 Listed $130,000 NMMLS
- 2019-07-30 Sold (Public Records) — Public Records
Property tax history
+6.8%/yrLatest (2025): $1,071 · -0.9% YoY. Source: county tax records.
Cash-flow waterfall
monthlySold comps — $/sqft
last 12 mo · ≤1 miLoading sold comps…