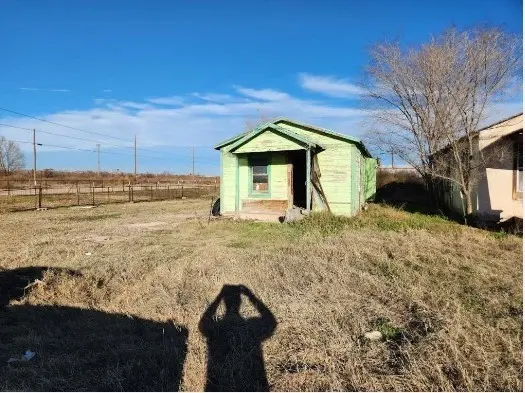
203 Galveston St · Big Spring, TX
Flood risk 10/10 · Severe
- FEMA flood zone
- AE
- Chance of flooding over 30 yrs
- 0.99%
- Est. flood insurance / yr
- $1,737 – $8,500
Fire risk 9/10 · Severe
- Est. fire insurance / yr
- $1,222 – $2,270
Heat risk 6/10 · Moderate
- Hot days now (above 102°F)
- 7 days/yr
- Hot days in 30 yrs
- 22 days/yr
Wind risk 2/10 · Minimal
- Chance of severe wind over 30 yrs
- 3.0%
Air-quality risk 1/10 · Minimal
- Unhealthy air days now
- 0 days/yr
- Unhealthy air days in 30 yrs
- 0 days/yr
Risk factors via First Street. Map © Google.
Why this score? — see what drove the D grade
The composite is a weighted blend of 9 inputs, each scored 0–100. Each bar is that input's sub-score; the figure is the points it added to the 100-point composite (weight × sub-score).
- Cash flow +15.0/30.0
- ARV discount +7.5/15.0
- 1% rule +5.0/10.0
- DSCR +5.0/10.0
- Livability +3.1/5.0
- Rent growth +2.5/5.0
- Schools +2.5/10.0
- Condition / age +2.5/5.0
- Appreciation +0.0/10.0
$26,189
🖨 Deal sheet 📄 Offer letter ✓ Due diligence
Listing remarks MLS
INVESTORS! 203 Galveston St is a fixer upper with a lot of potential, at a price you will love! The one-story home boasts one bedroom, one bathroom, and 528 square feet of livable space. It is definitely a wonderful starter home that you can make your own in no time. This home has easy access to I-20 with plenty of shopping and eateries nearby! If you want to experience nature in all its splendor, the property is minutes away from Big Spring State Park, and Comanche Trail Park. WE MAKE IT EASY TO OWN. This is a great opportunity! Don't wait, call us today to get more information on the owner's easy terms and smooth process that may be able to put the deed in your name and make this you the owner of this property. This property is part of an exclusive investor special package available for a limited time. Call us today and ask about the Big Spring Investor Package.
Key facts
- 3,397 sq ft lot
- Built 1930
- Listed 556 days
Neighborhood map
What this means for you Summary
Snapshot
- This is a 1-bed/1.0-bath single-family listed at $26k.
Deal economics
- At list price, monthly cash flow is $308 ($4k/yr) — positive.
- The deal already cash-flows at list — no discount required.
- Meets the 1% rule at list price ($1k rent vs $26k).
- Recommended offer: $23k (12.0% below list) — sets the bar for market timing.
Location & tenants
- Location reads 62/100 on livability (#948 in TX) — a middle-class / working-renter tenant base. Strengths: cost of living A+, housing A+, health & safety A+; Watch: employment C-, schools F, crime F.
- Big Spring ISD (town): math 29% / reading 30% proficiency, ranked #641 of 826 in TX (top 78%) — low school quality limits family demand, transient renter base, plan for 1-2y turnover; 63% free/reduced lunch — lower-income household profile, screen leases tightly.
- Market conditions: 266 active listings in the ZIP; 1 comparable units currently listed for rent nearby; 69 units permitted in Howard County in 2024 (5 in 5+ unit buildings).
Forward outlook
- Local home prices are declining (-3.0%/yr); year-one equity from $181 of loan paydown is wiped out by about $786 of value loss. Plan a longer hold.
- Howard County population projected at +42% by 2050 — long-run rental-demand tailwind backs the buy-and-hold thesis.
- At projected returns (-3.0% appreciation + 3.0% rent growth), your $7k cash investment doubles in ~3 years — after that, you're playing with house money.
Negotiation context
- It's been on market 557 days — a 12% lower offer ($23k) is reasonable based on typical stale-listing flexibility.
- 2 sale attempts since 4y ago with the ask held roughly flat each time — persistent listings suggest the price (not the market) is what's stuck; bring a comps-based counter.
Risks & watch-outs
- Watch-outs: flood insurance adds $427/mo; built in 1930 — expect roof / HVAC / electrical / plumbing capex.
- Climate carrying-cost: in FEMA flood zone AE (mandatory federal flood insurance); severe wildfire risk; extreme-heat days projected 7→22/yr by 2055 (HVAC capex compounding) — expect insurance premiums to compound above CPI over the hold.
Questions for the listing agent
- It's been on market 557 days. Have you received any prior offers? Is the seller open to a 12% concession, seller financing, or rate buy-down credit?
- Built in 1930 — when were the roof, HVAC, electrical panel, plumbing, and water heater last replaced?
- What's the actual annual flood-insurance premium (NFIP or private), and is the property in a SFHA with mandatory coverage?
- Why hasn't it sold? Are there any deal-killer items the seller is aware of (foundation, flood, title, zoning, code violations)?
- Is there a deadline driving the sale (1031 exchange, divorce, estate, relocation)? That informs how much negotiation room exists.
- Schools are F-rated, which usually means shorter tenancies and higher turnover. Who's the typical renter profile here, and what's been the actual vacancy rate?
- Crime grade is F in this area — have there been break-ins, vandalism, or insurance claims at this property in the last 3 years? What carrier currently insures it and at what premium?
- The area grade is low — what's the realistic commute time and amenity access for the typical tenant pool here? Any planned neighborhood developments (good or bad) we should know about?
- What's the average days-on-market for RENTAL listings here right now (not sales)? A rising rental-DOM trend means longer vacancies and softer asking-rent achievability than the comps imply.
- What's the recent tenant-quality profile in this submarket — average credit score on applications, eviction rate, late-payment / NSF rate, and stable-employment percentage? A property-management company in the area should have these aggregated.
- How much new for-sale + rental construction is in the pipeline within 1–3 miles? Heavy new supply typically softens prices + rents 12–24 months out; constrained supply supports both.
Investment metrics
- 1% rule
- 4.29% ✓
- Cap rate
- 39.97%
- Cash-on-cash
- 120.26%
- DSCR
- 6.35
- GRM
- 1.9
CMA / ARV
No comps found within radius.
Projected returns pro-forma
-3.0% appreciation · 3.0% rent growth · sell at horizon
- IRR
- 48.7%
- Equity multiple
- 3.14×
- Total profit
- $15,657
- Equity at exit
- $3,905
- IRR
- 54.4%
- Equity multiple
- 6.45×
- Total profit
- $39,987
- Equity at exit
- $2,264
Cash invested: $7,333 (down + closing). Projections, not guarantees.
Landlord ↔ Tenant lean methodology
- Overall (STATE)
- 87 Strongly Landlord-Friendly
- State Texas
- 87 Strongly Landlord-Friendly · R+5
- County
- — inherits STATE
- City
- — inherits STATE
ZIP-level market 79720
- Active inventory
- 266
- Price-to-rent
- 1.9×
Monthly cashflow live
- Estimated rent
- $1,125 medium interval (Pro) →
- Mortgage (P&I)
- −$137
- Tax from tax record
- −$5 /mo · $63/yr
- Insurance
- −$11
- Flood insurance flood zone
- −$427 /mo · $5,118/yr
- HOA
- −$0
- Vacancy / Maint / Mgmt
- −$236
- Net cashflow
- $308
Break-even live
UW: 25.0% down · 7.5% · 30yr · 1.5% tax · 5.0% vac · 8.0% maint · 8.0% mgmt
Financing live
Cash to close
- Down payment
- $6,547
- Closing costs
- $786
- Reserves months
- —
- Total cash needed
- —
Loan-product check · same deal, 3 products live
Conventional
25% down · 7.5% · 30yr
- Down + closing
- —
- Monthly P&I
- —
- Monthly cashflow
- —
- DSCR
- —
- Eligible?
- —
Personal DTI + credit; lowest rate.
DSCR
20% down · 8.5% · 30yr
- Down + closing
- —
- Monthly P&I
- —
- Monthly cashflow
- —
- DSCR
- —
- Eligible?
- —
No personal income docs; deal must DSCR.
Hard money
10% down · 12.0% · 12mo
- Down + closing
- —
- Monthly P&I
- —
- Monthly cashflow
- —
- DSCR
- —
- Eligible?
- —
Short-term bridge; refi at stabilization.
Rent comps 1 comps
| Address | Beds | Baths | Sqft | Rent | $/sqft | DOM | Units | Dist |
|---|---|---|---|---|---|---|---|---|
| 508 N San Antonio St Unit B Big Spring, TX | 1.0 | 1.0 | 600 | $1,700 | $2.83 | 17d | 1 | 0.55mi |
Listing history 19 events
-
2026-06-19days on market $26,189 Active 557 DOM
-
2026-06-18days on market $26,189 Active 556 DOM
-
2026-06-17days on market $26,189 Active 555 DOM
-
2026-06-16days on market $26,189 Active 554 DOM
-
2026-06-15days on market $26,189 Active 553 DOM
-
2026-06-14days on market $26,189 Active 551 DOM
-
2026-06-12days on market $26,189 Active 550 DOM
-
2026-06-09days on market $26,189 Active 547 DOM
-
2026-06-08days on market $26,189 Active 546 DOM
-
2026-06-07days on market $26,189 Active 545 DOM
-
2026-06-05days on market $26,189 Active 542 DOM
-
2026-06-02days on market $26,189 Active 540 DOM
-
2026-06-01days on market $26,189 Active 539 DOM
-
2026-05-31days on market $26,189 Active 538 DOM
-
2026-05-30days on market $26,189 Active 537 DOM
-
2024-12-09$26,189 Active 882-char remark
Show marketing remark (882 chars)
INVESTORS! 203 Galveston St is a fixer upper with a lot of potential, at a price you will love! The one-story home boasts one bedroom, one bathroom, and 528 square feet of livable space. It is definitely a wonderful starter home that you can make your own in no time. This home has easy access to I-20 with plenty of shopping and eateries nearby! If you want to experience nature in all its splendor, the property is minutes away from Big Spring State Park, and Comanche Trail Park. WE MAKE IT EASY TO OWN. This is a great opportunity! Don't wait, call us today to get more information on the owner's easy terms and smooth process that may be able to put the deed in your name and make this you the owner of this property. This property is part of an exclusive investor special package available for a limited time. Call us today and ask about the Big Spring Investor Package.
-
2024-12-09historical
Show marketing remark (882 chars)
INVESTORS! 203 Galveston St is a fixer upper with a lot of potential, at a price you will love! The one-story home boasts one bedroom, one bathroom, and 528 square feet of livable space. It is definitely a wonderful starter home that you can make your own in no time. This home has easy access to I-20 with plenty of shopping and eateries nearby! If you want to experience nature in all its splendor, the property is minutes away from Big Spring State Park, and Comanche Trail Park. WE MAKE IT EASY TO OWN. This is a great opportunity! Don't wait, call us today to get more information on the owner's easy terms and smooth process that may be able to put the deed in your name and make this you the owner of this property. This property is part of an exclusive investor special package available for a limited time. Call us today and ask about the Big Spring Investor Package.
-
2024-09-09price $26,189
-
2022-08-18$26,999 Active
ⓘ Source: listings_history table (triggers on properties + properties_extension) + one-shot
backfill from property_details.listing_events for pre-trigger history.
Tax reassessment forecast TX · Resets to sale price
- Current annual tax
- $63 · $5/mo
- Projected year-2 tax
- $479 · $40/mo
- Expected delta
- +$416/yr (+$35/mo · 662.1%)
ⓘ Screening estimate from a state-policy table — verify with the county assessor before closing.
Climate risk First Street
- Flood 10/10 Extreme FEMA zone AE · 99% chance over 30 yrs
- Wildfire 9/10 Extreme
- Heat 6/10 Major 7 d/yr ≥102°F today · 22 d/yr by 30 yrs out
- Wind 2/10 Low 3% chance of damaging wind over 30 yrs
- Air quality 1/10 Low 0 unhealthy d/yr today · 0 by 30 yrs out
Nearby sold comps map
Loading sold comps map…
Walkable amenities ~0.75 mi
Loading nearby amenities…
Taxation est. · year 1
- Rental income
- $13,494
- − Mortgage interest
- −$1,467
- − Property taxes
- −$63
- − Insurance
- −$5,249
- − Repairs & maintenance
- −$1,080
- − Management
- −$1,080
- − Depreciation
- −$762
- Taxable income
- $3,794
- Est. tax owed @ 24.0%
- −$911
- After-tax cash flow
- $2,790/yr
For passive investors: Depreciation is non-cash, so a rental often shows a tax loss while cash-flowing — sheltering income. Rental losses are passive: they offset passive income freely, and up to $25,000/yr can offset ordinary (W-2) income if you actively participate and your MAGI is under $100k (phasing out to $0 by $150k); unused losses carry forward. On sale, claimed depreciation is recaptured at up to 25%, and gains may owe capital-gains tax (a 1031 exchange can defer both). Figures are a year-1 estimate at your 24.0% rate — not tax advice; consult a CPA.
Schools (NCES district)
- District
- Big Spring ISD
- NCES district ID
- 4810200
- Math proficiency
- 29% ▼ -1.00%
- Reading proficiency
- 30% ▲ 4.00%
- Median HH income
- $42,916
- Composite
- 25.11/100
- National rank
- #7529
- State rank
- #641 of 826 in TX
Livability — Big Spring
- Score
- 62/100
- State rank
- #948
- US rank
- #16886
Category grades
Schools grade is shown separately in the Schools card above.
Census & demographics
- Census place
- Big Spring, TX
- County
- Howard County · 29,936 people
- City population
- 29,936
- Metro
- Big Spring, TX
- Population (ZIP)
- 29,936
- Household income
- $68,785
- Rent vs Own
- Severe rent burden
- 638.0
Population outlook (Howard County) Hauer SSP2
- Today (2025)
- 43,396 people
- By 2030
- 46,792 · +7.8%
- By 2040
- 54,096 · +24.7%
- By 2050
- 61,707 · +42.2%
- By 2075
- 79,809 · +83.9%
- By 2100
- 87,385 · +101.4%
Race, ethnicity, and origin ACS 2023
- Neighborhood character
- Diverse neighborhood (Simpson 0.59)
- Race & ethnicity
- Hispanic / Latino 45% White 45% Two or more races 17% Black 5% Asian 1%
- Hispanic origin (detail)
- Mexican 37%
- Common ancestry
- Slovak 1% Italian 1% Lithuanian 1%
- Foreign-born
- 10% · Canada
- Languages at home
- 71% English-only · Spanish 28%
Political lean MEDSL · Howard
- 2024 margin
- Solid R (+62.8) · D 18.2% · R 81.1%
- 2008→2024 swing
- -16.6pp toward R · 2008: -46.3pp · 2024: -62.8pp
- All cycles
- 2024: R+62.8 2020: R+58.4 2016: R+56.0 2012: R+58.2 2008: R+46.3
Not yet ingested
- Civics
- —
Market trends
- HPI YoY
- ▼ -207.13%
- Current HPI
- 140.8159
- Rent YoY
- —
- Metro
- Big Spring, TX
- State GDP YoY
- ▲ 3.95%
- F500 in state
- 110
Industry mix (Fortune 500 HQ in TX)
| Industry | F500 HQs | Revenue |
|---|---|---|
| Energy | 16 | $1,198B |
|
||
| Technology | 5 | $198B |
|
||
| Engineering / Construction | 4 | $72B |
|
||
| Energy Services | 3 | $60B |
|
||
| Utilities | 3 | $41B |
|
||
| Healthcare | 2 | $330B |
|
||
Price history
-3.0% since first listed4 events — show timeline
- 2024-12-09 Listing Removed — HARMLS
- 2024-12-09 Listed $26,189 HARMLS
- 2024-09-09 Price Changed $26,189 HARMLS
- 2022-08-18 Listed $26,999 HARMLS
Property tax history
-1.9%/yrLatest (2025): $63 · -41.2% YoY. Source: county tax records.
Cash-flow waterfall
monthlySold comps — $/sqft
last 12 mo · ≤1 miLoading sold comps…