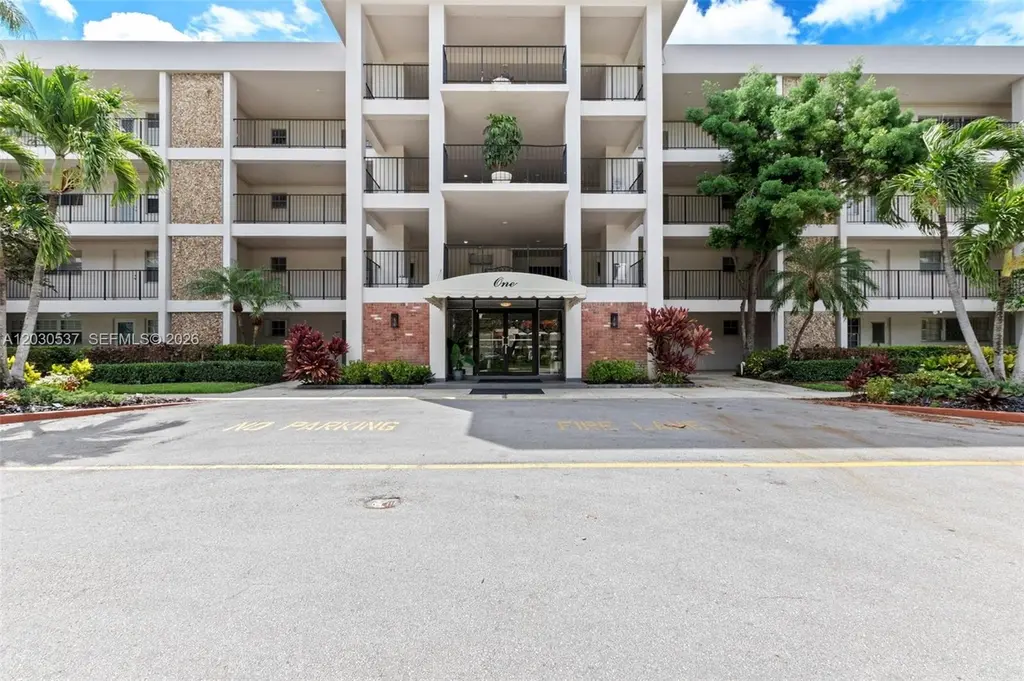
2800 N Palm Aire Dr #405 · Pompano Beach, FL
Flood risk 1/10 · Minimal
- FEMA flood zone
- X (unshaded)
- Chance of flooding over 30 yrs
- 0.0%
- Est. flood insurance / yr
- $507 – $1,088
Fire risk 1/10 · Minimal
- Est. fire insurance / yr
- $947 – $1,759
Heat risk 9/10 · Severe
- Hot days now (above 106°F)
- 5 days/yr
- Hot days in 30 yrs
- 16 days/yr
Wind risk 10/10 · Severe
- Chance of severe wind over 30 yrs
- 99.0%
Air-quality risk 3/10 · Minor
- Unhealthy air days now
- 3 days/yr
- Unhealthy air days in 30 yrs
- 3 days/yr
Risk factors via First Street. Map © Google.
Why this score? — see what drove the D+ grade
The composite is a weighted blend of 9 inputs, each scored 0–100. Each bar is that input's sub-score; the figure is the points it added to the 100-point composite (weight × sub-score).
- Cash flow +14.7/30.0
- ARV discount +7.5/15.0
- 1% rule +7.0/10.0
- DSCR +4.5/10.0
- Schools +4.1/10.0
- Livability +3.7/5.0
- Appreciation +3.4/10.0
- Condition / age +2.5/5.0
- Rent growth +2.4/5.0
$160,000
🖨 Deal sheet (PDF) 📄 Offer letter ✓ Due diligence
Listing remarks
Stunning 1 Bedroom, 1 Bath Condo in Beautiful Palm Aire Country Club. This Condo features New Floors, Modern Kitchen with Carefully Selected Quartz Counters and Stainless Steel Frigidaire Appliances- Refrigerator, Microwave, Stove and Dishwasher. Updated Bathroom. A/C is 2024, water Heater is 2026. This unit is Completely Move In Ready. An Added Plus- Minutes from Pompano's Top Golf and Premier Casinos & Restaurants
Key facts
- $437 HOA
- Parking
- Community pool
Property features AI
Finance
- Financial info: Pets allowed
- HOA & community: Monthly association fee; Association fee includes common areas, insurance, laundry, grounds maintenance, structure maintenance, pool(s), reserve fund, and roof; Association amenities: laundry, barbecue, picnic area, pool, elevator(s)
Exterior
- Parking: One assigned parking space
- Security: On-site security guard
- Home design: 4-story building; Entry on 4th floor; Updated/remodeled; Attached property; Block construction
- Construction: Block construction; Effective year built
- Exterior features: Glass-enclosed porch; Porch; Association pool; Security guard
Interior
- Kitchen: Dishwasher; Electric range; Microwave; Refrigerator; Disposal; Electric water heater
- Flooring: Laminate
- Bathrooms: 1 full bathroom
- Heating & cooling: Central heating (electric); Central air conditioning (electric); Ceiling fan(s)
- Interior features: Living/dining room; Elevator; Other
- Laundry & utility: Common area laundry
Neighborhood map
What this means for you Summary
Snapshot
- This is a 1-bed/1.0-bath condo listed at $160k.
Deal economics
- At list price, monthly cash flow is $41 ($490/yr) — positive.
- The deal already cash-flows at list — no discount required.
- Meets the 1% rule at list price ($2k rent vs $160k).
- Recommended offer: $158k (1.5% below list) — sets the bar for market timing.
- Cap rate 6.6% vs local median 3.1% in Pompano Beach — top-decile yield for the area; either an underpriced asset or a hidden risk that comps aren't pricing in. Stress-test before assuming the spread holds.
Location & tenants
- Location reads 74/100 on livability (#284 in FL, #4,541 nationally) — a middle-class / working-renter tenant base. Strengths: commute A+, housing A+, cost of living B+; Watch: schools D+, employment D+, amenities F.
- Broward (suburban): math 42% / reading 53% proficiency, ranked #46 of 73 in FL (top 63%) — families likely to look elsewhere, expect single-tenant / working-renter base with shorter leases.
- Market conditions: Rents soft (-0.3%/yr); 445 active listings in the ZIP; 40 comparable units currently listed for rent nearby; rentals at typical pace (median 22d on market — plan ~3-4 weeks tenant-placement turnaround); 2,111 units permitted in Broward County in 2024 (1,265 in 5+ unit buildings).
- This rent runs 39% of the median local income ($60k/yr) — at the standard rent-burdened threshold; future hikes will face affordability resistance.
Forward outlook
- Local home prices are declining (-3.0%/yr); year-one equity from $1k of loan paydown is wiped out by about $5k of value loss. Plan a longer hold.
- Broward County population projected at +34% by 2050 — long-run rental-demand tailwind backs the buy-and-hold thesis.
Negotiation context
- It's been on market 17 days — a 2% lower offer ($158k) is reasonable based on typical stale-listing flexibility.
- Current owner paid $105k; list at $160k implies a 52% gain — meaningful room to come down on a strong offer.
Risks & watch-outs
- Watch-outs: HOA is 23% of rent.
- Climate carrying-cost: severe wind risk, 99% chance of damaging wind over 30y; extreme-heat days projected 5→16/yr by 2055 (HVAC capex compounding) — expect insurance premiums to compound above CPI over the hold.
Questions for the listing agent
- Built in 1967 — when were the roof, HVAC, electrical panel, plumbing, and water heater last replaced?
- What does the HOA fee cover, when was the last increase, and are there any pending special assessments or reserve-fund shortfalls?
- Any open or pending special assessments — roof, HVAC, plumbing, elevator, façade? What's the per-unit balance and payoff schedule, and is the seller paying it off at close or rolling it to the buyer?
- Is there a deadline driving the sale (1031 exchange, divorce, estate, relocation)? That informs how much negotiation room exists.
- Schools are D-rated, which usually means shorter tenancies and higher turnover. Who's the typical renter profile here, and what's been the actual vacancy rate?
- The area grade is low — what's the realistic commute time and amenity access for the typical tenant pool here? Any planned neighborhood developments (good or bad) we should know about?
- What's the average days-on-market for RENTAL listings here right now (not sales)? A rising rental-DOM trend means longer vacancies and softer asking-rent achievability than the comps imply.
- What's the recent tenant-quality profile in this submarket — average credit score on applications, eviction rate, late-payment / NSF rate, and stable-employment percentage? A property-management company in the area should have these aggregated.
- How much new apartment / multifamily construction is in the pipeline within 1–3 miles? Heavy new supply (>2% of stock underway) typically softens rents 12–24 months out; light construction supports rent growth.
Investment metrics
- 1% rule
- 1.20% ✓
- Cap rate
- 6.60%
- Cash-on-cash
- 1.09%
- DSCR
- 1.05
- GRM
- 6.9
CMA / ARV
No comps found within radius.
Projected returns pro-forma
-3.0% appreciation · 0.0% rent growth · sell at horizon
- IRR
- -19.0%
- Equity multiple
- 0.36×
- Total profit
- $-28,709
- Equity at exit
- $23,857
- IRR
- -22.9%
- Equity multiple
- 0.05×
- Total profit
- $-42,399
- Equity at exit
- $13,834
Cash invested: $44,800 (down + closing). Projections, not guarantees.
Landlord ↔ Tenant lean methodology
- Overall (STATE)
- 87 Strongly Landlord-Friendly
- State Florida
- 87 Strongly Landlord-Friendly · R+3
- County
- — inherits STATE
- City
- — inherits STATE
ZIP-level market 33069
- Home prices YoY
- -1.1%
- Rents YoY
- -0.3%
- Active inventory
- 445
- Price-to-rent
- 6.9×
Monthly cashflow live
- Estimated rent
- $1,925 high interval (Pro) →
- Mortgage (P&I)
- −$839
- Tax from tax record
- −$137 /mo · $1,643/yr
- Insurance
- −$67
- HOA
- −$437
- Vacancy / Maint / Mgmt
- −$404
- Net cashflow
- $41
Break-even live
Sensitivity live
| Price | -10% $131 | -5% $86 | +0% $41 | +5% $-4 | +10% $-50 |
|---|---|---|---|---|---|
| Rent | -10% $-111 | -5% $-35 | +0% $41 | +5% $117 | +10% $193 |
| Rate | -1.0pp $121 | -0.5pp $82 | base $41 | +0.5pp $-1 | +1.0pp $-43 |
UW: 25.0% down · 7.5% · 30yr · 1.5% tax · 5.0% vac · 8.0% maint · 8.0% mgmt
Financing live
Cash to close
- Down payment
- $40,000
- Closing costs
- $4,800
- Reserves months
- —
- Total cash needed
- —
Loan-product check · same deal, 3 products live
Conventional
25% down · 7.5% · 30yr
- Down + closing
- —
- Monthly P&I
- —
- Monthly cashflow
- —
- DSCR
- —
- Eligible?
- —
Personal DTI + credit; lowest rate.
DSCR
20% down · 8.5% · 30yr
- Down + closing
- —
- Monthly P&I
- —
- Monthly cashflow
- —
- DSCR
- —
- Eligible?
- —
No personal income docs; deal must DSCR.
Hard money
10% down · 12.0% · 12mo
- Down + closing
- —
- Monthly P&I
- —
- Monthly cashflow
- —
- DSCR
- —
- Eligible?
- —
Short-term bridge; refi at stabilization.
Rent comps 40 comps
| Address | Beds | Baths | Sqft | Rent | $/sqft | DOM | Units | Dist |
|---|---|---|---|---|---|---|---|---|
| 2850 N Palm Aire Dr Pompano Beach, FL | 1.0 | 1.5 | 850 | $2,000 | $2.35 | 25d | 1 | 0.06mi |
| 2801 N Palm Aire Dr #308 Pompano Beach, FL | 2.0 | 2.0 | 1100 | $1,950 | $1.77 | 25d | 1 | 0.06mi |
| 2751 N Palm Aire Dr #402 Pompano Beach, FL | 2.0 | 2.0 | 1064 | $2,300 | $2.16 | 25d | 1 | 0.11mi |
| 2900 N Palm Aire Dr #405 Pompano Beach, FL | 1.0 | 1.0 | 860 | $1,625 | $1.89 | 18d | 1 | 0.12mi |
| 2900 N Palm Aire Dr #206 Pompano Beach, FL | 1.0 | 1.0 | 860 | $1,650 | $1.92 | 25d | 1 | 0.12mi |
| 2671 S Course Dr #506 Pompano Beach, FL | 2.0 | 2.0 | 1100 | $2,250 | $2.05 | 25d | 1 | 0.21mi |
| 2671 S Course Dr #108 Pompano Beach, FL | 2.0 | 2.0 | 1100 | $1,900 | $1.73 | 0d | 1 | 0.21mi |
| 2671 S Course Dr #506 Pompano Beach, FL | 2.0 | 2.0 | 1100 | $2,250 | $2.05 | 9d | 1 | 0.21mi |
| 2671 S Course Dr #806 Pompano Beach, FL | 2.0 | 2.0 | 1100 | $2,250 | $2.05 | 16d | 1 | 0.21mi |
| 2671 S Course Dr #206 Pompano Beach, FL | 2.0 | 2.0 | 1100 | $2,000 | $1.82 | 25d | 1 | 0.21mi |
| 2940 N Course Dr Pompano Beach, FL | 1.0 | 1.0 | 1100 | $1,050 | $0.95 | 25d | 1 | 0.22mi |
| 2940 N Course Dr #910 Pompano Beach, FL | 2.0 | 2.0 | 1100 | $1,950 | $1.77 | 25d | 1 | 0.22mi |
| 2940 N Course Dr #311 Pompano Beach, FL | 2.0 | 2.0 | 1100 | $2,500 | $2.27 | 12d | 1 | 0.22mi |
| 2650 S Course Dr #603 Pompano Beach, FL | 2.0 | 2.0 | 1100 | $3,000 | $2.73 | 20d | 1 | 0.28mi |
| 3050 N Palm Aire Dr #602 Pompano Beach, FL | 2.0 | 2.0 | 1100 | $1,895 | $1.72 | 22d | 1 | 0.31mi |
| 3050 N Palm Aire Dr #508 Pompano Beach, FL | 2.0 | 2.0 | 1100 | $2,100 | $1.91 | 25d | 1 | 0.31mi |
| 3050 N Palm Aire Dr #704 Pompano Beach, FL | 1.0 | 1.5 | 900 | $1,900 | $2.11 | 16d | 1 | 0.31mi |
| 3050 N Palm Aire Dr #704 Pompano Beach, FL | 1.0 | 1.5 | 900 | $1,900 | $2.11 | 18d | 1 | 0.31mi |
| 2500 SW 7th St Pompano Beach, FL | 3.0 | 1.0–3.0 | 1216 | $3,091 | $2.54 | 0d | 137 | 0.34mi |
| 2801 N Course Dr Pompano Beach, FL | 1.0–2.0 | 1.0–2.0 | 991 | $1,845 | $1.86 | 25d | 12 | 0.34mi |
| 2803 N Course Dr #203 Pompano Beach, FL | 2.0 | 2.0 | 1120 | $2,100 | $1.88 | 22d | 1 | 0.35mi |
| 2803 N Course Dr #203 Pompano Beach, FL | 2.0 | 2.0 | 1120 | $2,050 | $1.83 | 5d | 1 | 0.35mi |
| 3100 N Palm Aire Dr #107 Pompano Beach, FL | 1.0 | 2.0 | 960 | $1,800 | $1.88 | 25d | 1 | 0.39mi |
| 2901 S Palm Aire Dr #307 Pompano Beach, FL | 1.0 | 1.5 | 920 | $1,640 | $1.78 | 20d | 1 | 0.40mi |
| 3051 N Course Dr #509 Pompano Beach, FL | 2.0 | 2.0 | 1100 | $1,795 | $1.63 | 25d | 1 | 0.41mi |
| 3051 S Palm Aire Dr #407 Pompano Beach, FL | 2.0 | 2.0 | 1064 | $2,200 | $2.07 | 25d | 1 | 0.41mi |
| 3100 N Course Ln #208 Pompano Beach, FL | 2.0 | 2.0 | 1100 | $1,850 | $1.68 | 6d | 1 | 0.43mi |
| 3100 N Course Ln #208 Pompano Beach, FL | 2.0 | 2.0 | 1100 | $1,850 | $1.68 | 12d | 1 | 0.43mi |
| 2851 S Palm Aire Dr #407 Pompano Beach, FL | 1.0 | 1.5 | 900 | $1,675 | $1.86 | 25d | 1 | 0.44mi |
| 2851 S Palm Aire Dr #309 Pompano Beach, FL | 2.0 | 2.0 | 1100 | $1,750 | $1.59 | 25d | 1 | 0.44mi |
| 2851 S Palm Aire Dr #107 Pompano Beach, FL | 1.0 | 1.5 | 960 | $1,750 | $1.82 | 0d | 1 | 0.44mi |
| 2851 S Palm Aire Dr #309 Pompano Beach, FL | 2.0 | 2.0 | 1100 | $1,750 | $1.59 | 18d | 1 | 0.44mi |
| 2809 N Course Dr #205 Pompano Beach, FL | 1.0 | 1.0 | 735 | $1,700 | $2.31 | 25d | 1 | 0.45mi |
| 2829 N Course Dr #104 Pompano Beach, FL | 2.0 | 2.0 | 1020 | $1,950 | $1.91 | 22d | 1 | 0.45mi |
| 3150 N Palm Aire Dr #307 Pompano Beach, FL | 1.0 | 1.5 | 900 | $1,700 | $1.89 | 25d | 1 | 0.46mi |
| 2751 S Palm Aire Dr #107 Pompano Beach, FL | 2.0 | 2.0 | 1112 | $1,950 | $1.75 | 4d | 1 | 0.47mi |
| 3151 S Palm Aire Dr #407 Pompano Beach, FL | 2.0 | 2.0 | 1064 | $2,200 | $2.07 | 25d | 1 | 0.49mi |
| 3150 N Course Ln Pompano Beach, FL | 2.0–3.0 | 2.0 | 1300 | $1,800 | $1.38 | 23d | 3 | 0.50mi |
| 3150 N Course Ln Pompano Beach, FL | 2.0–3.0 | 2.0 | 1300 | $1,795 | $1.38 | 0d | 4 | 0.50mi |
| 3091 N Course Dr #303 Pompano Beach, FL | 2.0 | 2.0 | 1064 | $2,100 | $1.97 | 5d | 1 | 0.52mi |
HOA detail condo
- Monthly dues
- $437 · $5,244/yr
- Likely covers
- water
- Assessments
- None detected in remarks — confirm with the listing agent.
Listing history 10 events
-
2026-06-21days on market $160,000 Active 17 DOM
-
2026-06-18days on market $160,000 Active 14 DOM
-
2026-06-17days on market $160,000 Active 13 DOM
-
2026-06-16days on market $160,000 Active 12 DOM
-
2026-06-15days on market $160,000 Active 11 DOM
-
2026-06-13days on market $160,000 Active 9 DOM
-
2026-06-09days on market $160,000 Active 5 DOM
-
2026-06-08days on market $160,000 Active 4 DOM
-
2026-06-07remarks 421-char remark
-
2026-06-07$160,000 Active 3 DOM
ⓘ Source: listings_history table (triggers on properties + properties_extension) + one-shot
backfill from property_details.listing_events for pre-trigger history.
Tax reassessment forecast FL · Resets to sale price
- Current annual tax
- $1,643 · $137/mo
- Projected year-2 tax
- $1,643 · $137/mo
- Expected delta
- $0/yr ($0/mo · 0.0%)
ⓘ Screening estimate from a state-policy table — verify with the county assessor before closing.
Climate risk First Street
- Flood 1/10 Low FEMA zone X (unshaded) · 0% chance over 30 yrs
- Wildfire 1/10 Low
- Heat 9/10 Extreme 5 d/yr ≥106°F today · 16 d/yr by 30 yrs out
- Wind 10/10 Extreme 99% chance of damaging wind over 30 yrs
- Air quality 3/10 Moderate 3 unhealthy d/yr today · 3 by 30 yrs out
Nearby sold comps map
Loading sold comps map…
Walkable amenities ~0.75 mi
Loading nearby amenities…
Taxation est. · year 1
- Rental income
- $23,095
- − Mortgage interest
- −$8,962
- − Property taxes
- −$1,643
- − Insurance
- −$800
- − Repairs & maintenance
- −$1,848
- − Management
- −$1,848
- − HOA
- −$5,244
- − Depreciation
- −$4,655
- Taxable loss
- −$1,904
- Est. tax savings @ 24.0%
- +$457
- After-tax cash flow
- $947/yr
For passive investors: Depreciation is non-cash, so a rental often shows a tax loss while cash-flowing — sheltering income. Rental losses are passive: they offset passive income freely, and up to $25,000/yr can offset ordinary (W-2) income if you actively participate and your MAGI is under $100k (phasing out to $0 by $150k); unused losses carry forward. On sale, claimed depreciation is recaptured at up to 25%, and gains may owe capital-gains tax (a 1031 exchange can defer both). Figures are a year-1 estimate at your 24.0% rate — not tax advice; consult a CPA.
Schools (NCES district)
- District
- Broward
- NCES district ID
- 1200180
- Math proficiency
- 42% ▼ -18.00%
- Reading proficiency
- 53% ▼ -5.00%
- Median HH income
- $52,139
- Composite
- 40.88/100
- National rank
- #3621
- State rank
- #46 of 73 in FL
Livability — Pompano Beach
- Score
- 74/100
- State rank
- #284
- US rank
- #4541
Category grades
Schools grade is shown separately in the Schools card above.
Census & demographics
- Census place
- Pompano Beach, FL
- County
- Broward County · 1,963,430 people
- City population
- 155,861
- Metro
- Miami-Fort Lauderdale-Pompano Beach, FL
- Population (ZIP)
- 29,145
- Household income
- $59,683
- Rent vs Own
- Severe rent burden
- 1670.0
Population outlook (Broward County) Hauer SSP2
- Today (2025)
- 2,207,033 people
- By 2030
- 2,360,704 · +7.0%
- By 2040
- 2,661,208 · +20.6%
- By 2050
- 2,946,698 · +33.5%
- By 2075
- 3,602,273 · +63.2%
- By 2100
- 3,970,984 · +79.9%
Race, ethnicity, and origin ACS 2023
- Neighborhood character
- Highly diverse neighborhood (Simpson 0.72)
- Race & ethnicity
- Black 33% White 32% Hispanic / Latino 26% Two or more races 21% Asian 3%
- Hispanic origin (detail)
- Mexican 5% Puerto Rican 3% Cuban 3% Dominican 2%
- Common ancestry
- Hispanic 9% Estonian 2% Romanian 2%
- Foreign-born
- 33% · Canada, Jamaica
- Languages at home
- 61% English-only · Spanish 23% French/Haitian/Cajun 9% Other Indo-European 5%
Political lean MEDSL · Broward
- 2024 margin
- D (+17.0) · D 58.0% · R 41.0%
- 2008→2024 swing
- -17.8pp toward R · 2008: 34.7pp · 2024: 17.0pp
- All cycles
- 2024: D+17.0 2020: D+29.8 2016: D+35.0 2012: D+34.9 2008: D+34.7
Not yet ingested
- Civics
- —
Market trends
- HPI YoY
- ▼ -3.16%
- Current HPI
- 297.1774
- Rent YoY
- ▼ -0.29%
- Metro
- Miami-Fort Lauderdale-Pompano Beach, FL
- State GDP YoY
- ▲ 3.28%
- F500 in state
- 36
Industry mix (Fortune 500 HQ in FL)
| Industry | F500 HQs | Revenue |
|---|---|---|
| Industrial Technology | 2 | $29B |
|
||
| Insurance | 2 | $17B |
|
||
| Retail | 1 | $60B |
|
||
| Technology Distribution | 1 | $58B |
|
||
| Homebuilding | 1 | $35B |
|
||
| Technology Manufacturing | 1 | $35B |
|
||
Price history
+1190.3% since first listed5 events — show timeline
- 2026-06-04 Listed $160,000 MARMLS
- 2019-10-10 Sold (Public Records) $105,000 Public Records
- 2004-06-10 Sold (Public Records) $87,000 Public Records
- 1986-12-01 Sold (Public Records) $42,000 Public Records
- 1967-12-01 Sold (Public Records) $12,400 Public Records
Property tax history
+10.1%/yrLatest (2025): $1,643 · +4.7% YoY. Source: county tax records.
Cash-flow waterfall
monthlySold comps — $/sqft
last 12 mo · ≤1 miLoading sold comps…