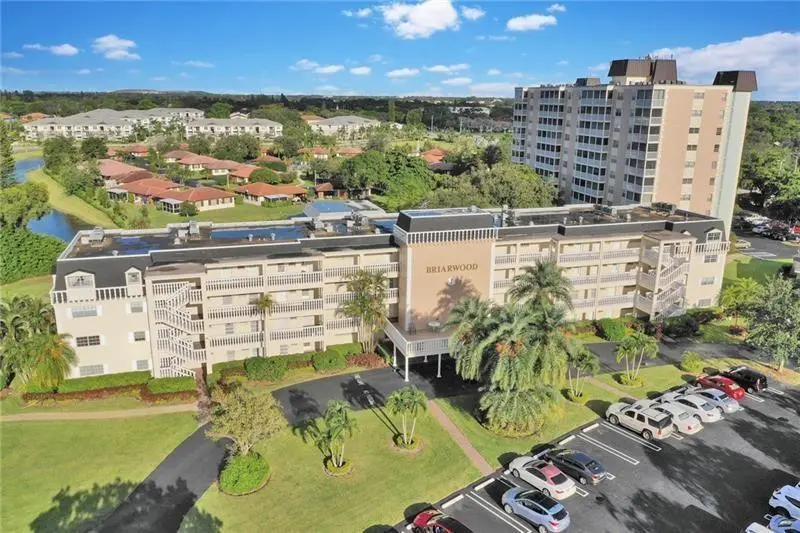
3535 Broken Woods Dr #307 · Coral Springs, FL
Flood risk No data
- FEMA flood zone
- —
- Chance of flooding over 30 yrs
- —
- Est. flood insurance / yr
- —
Fire risk No data
- Est. fire insurance / yr
- —
Heat risk No data
- Hot days now (above threshold)
- —
- Hot days in 30 yrs
- —
Wind risk No data
- Chance of severe wind over 30 yrs
- —
Air-quality risk No data
- Unhealthy air days now
- —
- Unhealthy air days in 30 yrs
- —
Risk factors via First Street. Map © Google.
Why this score? — see what drove the D grade
The composite is a weighted blend of 9 inputs, each scored 0–100. Each bar is that input's sub-score; the figure is the points it added to the 100-point composite (weight × sub-score).
- Cash flow +12.0/30.0
- ARV discount +7.5/15.0
- 1% rule +7.2/10.0
- Schools +4.1/10.0
- Livability +4.0/5.0
- DSCR +3.5/10.0
- Rent growth +2.5/5.0
- Condition / age +2.5/5.0
- Appreciation +0.0/10.0
$175,000
🖨 Deal sheet (PDF) 📄 Offer letter ✓ Due diligence
Listing remarks
This updated 2BR / 2BA is located in the heart of downtown Coral Springs in the prestigious 55+ Briarwood Community. Located in close proximity to restaurants, shopping and hospital. Unit features renovated kitchen and bathrooms with water view. This unit is turnkey ready. HOA includes, water, trash, use of heated pool, library and clubhouse. Call this your home, don’t wait! .
Key facts
- Clubhouse
- Renovated bathrooms
- Renovated kitchen
Tags
Property features AI
Finance
- Other: Pets allowed with breed restrictions
- HOA & community: Association with amenities including picnic area, parking, pool, trash chute, and maintenance; HOA fees paid quarterly; HOA covers grounds maintenance, trash, water, common areas, and roof repairs; Senior community
Exterior
- Parking: 1 parking space; Guest parking available
- Security: Other security features
- Utilities: Public water; Public sewer; Cable available
- Home design: Condominium; Resale unit; Faces west; 4-story building
- Construction: Block construction; Flat roof; Building area recorded by appraiser (1,124)
- Exterior features: Screened porch; Waterfront: Yes (no specific waterfront features listed)
Interior
- Kitchen: Electric range; Dishwasher; Refrigerator; Garbage disposal; Owned water purifier; Owned water softener; Electric water heater
- Bedrooms: 2 bedrooms on the main level
- Flooring: Carpet; Laminate; Tile
- Bathrooms: 2 full bathrooms on the main level
- Heating & cooling: Central electric heating; Central air conditioning; Ceiling fans
- Interior features: Split bedroom layout
Neighborhood map
What this means for you Summary
Snapshot
- This is a 2-bed/2.0-bath condo listed at $175k.
Deal economics
- At list price, monthly cash flow is $-42 ($-509/yr) — negative.
- To cash-flow at today's rent, offer at most $168k (4.3% below list).
- Meets the 1% rule at list price ($2k rent vs $175k).
- Recommended offer: $159k (9.0% below list) — sets the bar for market timing.
- Cap rate 6.0% vs local median 3.6% in Coral Springs — top-decile yield for the area; either an underpriced asset or a hidden risk that comps aren't pricing in. Stress-test before assuming the spread holds.
Location & tenants
- Location reads 79/100 on livability (#145 in FL, #2,163 nationally) — a middle-class / working-renter tenant base. Strengths: housing A+, health & safety A+, crime A; Watch: amenities F, cost of living F.
- Broward (suburban): math 42% / reading 53% proficiency, ranked #46 of 73 in FL (top 63%) — families likely to look elsewhere, expect single-tenant / working-renter base with shorter leases.
- Zoned schools: James S. Hunt Elementary School (math 49% / reading 37%, grade F, #1,366 of 2,144 statewide, top 64%, 502 students, 76% FRL); Forest Glen Middle School (math 46% / reading 49%, grade C-, #288 of 571 statewide, top 51%, 1,115 students, 62% FRL); Coral Springs High School (math 16% / reading 38%, grade F, #478 of 667 statewide, top 73%, 2,320 students, 59% FRL).
- Market conditions: Rents soft (-0.0%/yr); 370 active listings in the ZIP; 40 comparable units currently listed for rent nearby; rentals at typical pace (median 24d on market — plan ~3-4 weeks tenant-placement turnaround); 2,111 units permitted in Broward County in 2024 (1,265 in 5+ unit buildings).
- This rent runs 34% of the median local income ($74k/yr) — at the standard rent-burdened threshold; future hikes will face affordability resistance.
Forward outlook
- Local home prices are declining (-3.0%/yr); year-one equity from $1k of loan paydown is wiped out by about $5k of value loss. Plan a longer hold.
- Broward County population projected at +34% by 2050 — long-run rental-demand tailwind backs the buy-and-hold thesis.
Negotiation context
- It's been on market 102 days — a 9% lower offer ($159k) is reasonable based on typical stale-listing flexibility.
- 4 sale attempts; this cycle's ask is 8650% above the opening price — seller raised mid-cycle; expect resistance to lowballs.
- Current owner paid $53k; list at $175k implies a 230% gain — meaningful room to come down on a strong offer.
Risks & watch-outs
- Watch-outs: HOA is 30% of rent.
Questions for the listing agent
- What do current leases actually rent for vs. the listed asking? Can we see a recent rent roll and the last 12 months of T-12 income?
- It's been on market 102 days. Have you received any prior offers? Is the seller open to a 9% concession, seller financing, or rate buy-down credit?
- Built in 1970 — when were the roof, HVAC, electrical panel, plumbing, and water heater last replaced?
- What does the HOA fee cover, when was the last increase, and are there any pending special assessments or reserve-fund shortfalls?
- Any open or pending special assessments — roof, HVAC, plumbing, elevator, façade? What's the per-unit balance and payoff schedule, and is the seller paying it off at close or rolling it to the buyer?
- Why hasn't it sold? Are there any deal-killer items the seller is aware of (foundation, flood, title, zoning, code violations)?
- Is there a deadline driving the sale (1031 exchange, divorce, estate, relocation)? That informs how much negotiation room exists.
- Schools are A-rated — typically a magnet for longer-tenancy family renters. What's the average tenant stay here, and is there a school-zone premium baked into asking?
- The area grade is low — what's the realistic commute time and amenity access for the typical tenant pool here? Any planned neighborhood developments (good or bad) we should know about?
- What's the average days-on-market for RENTAL listings here right now (not sales)? A rising rental-DOM trend means longer vacancies and softer asking-rent achievability than the comps imply.
- What's the recent tenant-quality profile in this submarket — average credit score on applications, eviction rate, late-payment / NSF rate, and stable-employment percentage? A property-management company in the area should have these aggregated.
- How much new apartment / multifamily construction is in the pipeline within 1–3 miles? Heavy new supply (>2% of stock underway) typically softens rents 12–24 months out; light construction supports rent growth.
Investment metrics
- 1% rule
- 1.22% ✓
- Cap rate
- 6.00%
- Cash-on-cash
- -1.04%
- DSCR
- 0.95
- GRM
- 6.9
CMA / ARV
No comps found within radius.
Projected returns pro-forma
-3.0% appreciation · 0.0% rent growth · sell at horizon
- IRR
- -22.8%
- Equity multiple
- 0.25×
- Total profit
- $-36,943
- Equity at exit
- $26,093
- IRR
- -35.4%
- Equity multiple
- -0.19×
- Total profit
- $-58,319
- Equity at exit
- $15,131
Cash invested: $49,000 (down + closing). Projections, not guarantees.
Landlord ↔ Tenant lean methodology
- Overall (STATE)
- 87 Strongly Landlord-Friendly
- State Florida
- 87 Strongly Landlord-Friendly · R+3
- County
- — inherits STATE
- City
- — inherits STATE
ZIP-level market 33065
- Home prices YoY
- -22.0%
- Rents YoY
- -0.0%
- Active inventory
- 370
- Price-to-rent
- 6.9×
Monthly cashflow live
- Estimated rent
- $2,126 high interval (Pro) →
- Mortgage (P&I)
- −$918
- Tax from tax record
- −$87 /mo · $1,040/yr
- Insurance
- −$73
- HOA
- −$645
- Vacancy / Maint / Mgmt
- −$447
- Net cashflow
- $-42
Break-even live
Sensitivity live
| Price | -10% $57 | -5% $7 | +0% $-42 | +5% $-92 | +10% $-141 |
|---|---|---|---|---|---|
| Rent | -10% $-210 | -5% $-126 | +0% $-42 | +5% $42 | +10% $126 |
| Rate | -1.0pp $46 | -0.5pp $2 | base $-42 | +0.5pp $-88 | +1.0pp $-134 |
UW: 25.0% down · 7.5% · 30yr · 1.5% tax · 5.0% vac · 8.0% maint · 8.0% mgmt
Financing live
Cash to close
- Down payment
- $43,750
- Closing costs
- $5,250
- Reserves months
- —
- Total cash needed
- —
Loan-product check · same deal, 3 products live
Conventional
25% down · 7.5% · 30yr
- Down + closing
- —
- Monthly P&I
- —
- Monthly cashflow
- —
- DSCR
- —
- Eligible?
- —
Personal DTI + credit; lowest rate.
DSCR
20% down · 8.5% · 30yr
- Down + closing
- —
- Monthly P&I
- —
- Monthly cashflow
- —
- DSCR
- —
- Eligible?
- —
No personal income docs; deal must DSCR.
Hard money
10% down · 12.0% · 12mo
- Down + closing
- —
- Monthly P&I
- —
- Monthly cashflow
- —
- DSCR
- —
- Eligible?
- —
Short-term bridge; refi at stabilization.
Rent comps 40 comps
| Address | Beds | Baths | Sqft | Rent | $/sqft | DOM | Units | Dist |
|---|---|---|---|---|---|---|---|---|
| 8982 W Sample Rd #204 Coral Springs, FL | 2.0 | 2.0 | 1260 | $2,200 | $1.75 | 9d | 1 | 0.17mi |
| 3591 NW 88th Dr Coral Springs, FL | 1.0–3.0 | 1.0–2.5 | 1244 | $2,845 | $2.29 | 3d | 6 | 0.18mi |
| 8958 W Sample Rd #8958 Coral Springs, FL | 2.0 | 1.5 | 970 | $2,250 | $2.32 | 26d | 1 | 0.20mi |
| 8958 W Sample Rd Coral Springs, FL | 2.0 | 1.5 | 970 | $2,250 | $2.32 | 4d | 1 | 0.20mi |
| 9150 NW 38th Dr Coral Springs, FL | 1.0–2.0 | 1.5–2.0 | 950 | $2,280 | $2.40 | 26d | 2 | 0.20mi |
| 9150 NW 38th Dr Coral Springs, FL | 1.0–2.0 | 1.5–2.0 | 950 | $2,200 | $2.32 | 4d | 2 | 0.20mi |
| 3712 N University Dr #3712 Coral Springs, FL | 2.0 | 2.0 | 737 | $1,700 | $2.31 | 23d | 1 | 0.21mi |
| 3664 N University Dr Unit C7 Coral Springs, FL | 2.0 | 2.0 | 737 | $1,800 | $2.44 | 26d | 1 | 0.21mi |
| 3596 N University Dr Coral Springs, FL | 2.0 | 2.0 | 731 | $2,000 | $2.74 | 26d | 1 | 0.21mi |
| 3662 N University Dr Unit F7 Coral Springs, FL | 2.0 | 2.0 | 737 | $1,999 | $2.71 | 26d | 1 | 0.21mi |
| 3554 N University Dr Unit 3554 Coral Springs, FL | 2.0 | 2.0 | 737 | $1,700 | $2.31 | 26d | 1 | 0.21mi |
| 3225 N University Dr Coral Springs, FL | 2.0 | 2.0 | 737 | $1,900 | $2.58 | 6d | 1 | 0.22mi |
| 8804 NW 38th Dr Unit 3 Coral Springs, FL | 3.0 | 2.0 | 1300 | $2,650 | $2.04 | 26d | 1 | 0.24mi |
| 3748 N University Dr Unit A8 Coral Springs, FL | 2.0 | 2.0 | 737 | $1,650 | $2.24 | 26d | 1 | 0.25mi |
| 3748 N University Dr Unit A8 Coral Springs, FL | 2.0 | 2.0 | 737 | $1,650 | $2.24 | 12d | 1 | 0.25mi |
| 9203 NW 38th Dr #2 Coral Springs, FL | 2.0 | 1.0 | 950 | $1,850 | $1.95 | 7d | 1 | 0.26mi |
| 3210 N University Dr Coral Springs, FL | 3.0 | 1.0–2.0 | 994 | $2,858 | $2.87 | 0d | 90 | 0.30mi |
| 8801 W Sample Rd Coral Springs, FL | 2.0 | 1.5–2.0 | 1099 | $2,125 | $1.93 | 21d | 2 | 0.31mi |
| 8801 W Sample Rd Coral Springs, FL | 2.0 | 1.5–2.0 | 1099 | $2,125 | $1.93 | 26d | 2 | 0.31mi |
| 8705 NW 38th Dr Unit 7B Coral Springs, FL | 2.0 | 2.0 | 1054 | $1,900 | $1.80 | 26d | 1 | 0.32mi |
| 8704 NW 35th St #208 Coral Springs, FL | 2.0 | 2.0 | 945 | $1,800 | $1.90 | 23d | 1 | 0.33mi |
| 8703 W Sample Rd Unit 107 Savannah Coral Springs, FL | 2.0 | 2.0 | 1165 | $1,894 | $1.63 | 9d | 1 | 0.34mi |
| 8703 W Sample Rd Unit 103 Charleston Coral Springs, FL | 1.0 | 1.0 | 856 | $1,603 | $1.87 | 23d | 1 | 0.34mi |
| 8703 W Sample Rd Apt 207 Coral Springs, FL | 2.0 | 2.0 | 1165 | $2,104 | $1.81 | 23d | 1 | 0.34mi |
| 8703 W Sample Rd Unit 211 Savannah Coral Springs, FL | 2.0 | 2.0 | 1165 | $2,119 | $1.82 | 26d | 1 | 0.35mi |
| 9120 NW 40th St #18 Coral Springs, FL | 2.0 | 2.5 | 1010 | $2,095 | $2.07 | 18d | 1 | 0.37mi |
| 9286 NW 40th St Coral Springs, FL | 2.0 | 1.5 | 910 | $1,725 | $1.90 | 26d | 1 | 0.38mi |
| 9270 NW 40th St Coral Springs, FL | 2.0 | 1.5 | 988 | $2,200 | $2.23 | 15d | 1 | 0.39mi |
| 8911 NW 28th Dr Unit B Coral Springs, FL | 2.0 | 2.5 | 1200 | $2,395 | $2.00 | 26d | 1 | 0.41mi |
| 8911 NW 28th Dr Coral Springs, FL | 2.0 | 3.0 | 1200 | $2,395 | $2.00 | 26d | 1 | 0.41mi |
| 8911 NW 28th Dr Unit B-32 Coral Springs, FL | 2.0 | 2.5 | 1200 | $2,395 | $2.00 | 26d | 1 | 0.41mi |
| 8911 NW 28th Dr Unit B-32 Coral Springs, FL | 2.0 | 2.5 | 1200 | $2,395 | $2.00 | 5d | 1 | 0.41mi |
| 8911 NW 28th Dr Unit B-32 Coral Springs, FL | 2.0 | 2.5 | 1200 | $2,295 | $1.91 | 13d | 1 | 0.41mi |
| 8604 NW 35th St #102 Coral Springs, FL | 1.0 | 1.0 | 720 | $1,500 | $2.08 | 16d | 1 | 0.41mi |
| 8903 NW 28th Dr Unit B Coral Springs, FL | 1.0 | 1.5 | 950 | $1,700 | $1.79 | 19d | 1 | 0.43mi |
| 8903 NW 28th Dr Unit B Coral Springs, FL | 1.0 | 1.5 | 850 | $1,700 | $2.00 | 26d | 1 | 0.43mi |
| 4147 NW 90th Ave Coral Springs, FL | 2.0 | 1.0 | 850 | $1,862 | $2.19 | 26d | 2 | 0.43mi |
| 4147 NW 90th Ave Coral Springs, FL | 2.0 | 1.0 | 850 | $1,850 | $2.18 | 16d | 2 | 0.43mi |
| 4150 NW 90th Ave #202 Coral Springs, FL | 2.0 | 1.0 | 850 | $1,750 | $2.06 | 26d | 1 | 0.43mi |
| 8605 W Sample Rd #111 Coral Springs, FL | 2.0 | 2.0 | 1000 | $1,910 | $1.91 | 23d | 1 | 0.43mi |
HOA detail condo
- Monthly dues
- $645 · $7,740/yr
- Likely covers
- watertrashpool
- Assessments
- None detected in remarks — confirm with the listing agent.
Listing history 22 events
-
2026-06-21days on market $175,000 Active 102 DOM
-
2026-06-18days on market $175,000 Active 99 DOM
-
2026-06-17days on market $175,000 Active 98 DOM
-
2026-06-16days on market $175,000 Active 97 DOM
-
2026-06-15days on market $175,000 Active 96 DOM
-
2026-06-13days on market $175,000 Active 94 DOM
-
2026-06-09days on market $175,000 Active 90 DOM
-
2026-06-07days on market $175,000 Active 88 DOM
-
2026-06-04days on market $175,000 Active 85 DOM
-
2026-06-03days on market $175,000 Active 84 DOM
-
2026-06-02days on market $175,000 Active 83 DOM
-
2026-06-01days on market $175,000 Active 82 DOM
-
2026-05-31days on market $175,000 Active 81 DOM
-
2026-05-08$2,000
-
2026-05-08historical $2,000
-
2026-03-06$2,000
-
2026-03-02$175,000 Active
-
2025-11-22historical $1,950
-
2025-09-18price $1,950
-
2025-06-01$2,100
-
1986-04-23soldstatus $53,000
-
1982-09-01soldstatus $57,500
ⓘ Source: listings_history table (triggers on properties + properties_extension) + one-shot
backfill from property_details.listing_events for pre-trigger history.
Tax reassessment forecast FL · Resets to sale price
- Current annual tax
- $1,040 · $87/mo
- Projected year-2 tax
- $1,452 · $121/mo
- Expected delta
- +$413/yr (+$34/mo · 39.7%)
ⓘ Screening estimate from a state-policy table — verify with the county assessor before closing.
Nearby sold comps map
Loading sold comps map…
Walkable amenities ~0.75 mi
Loading nearby amenities…
Taxation est. · year 1
- Rental income
- $25,517
- − Mortgage interest
- −$9,803
- − Property taxes
- −$1,040
- − Insurance
- −$875
- − Repairs & maintenance
- −$2,041
- − Management
- −$2,041
- − HOA
- −$7,740
- − Depreciation
- −$5,091
- Taxable loss
- −$3,114
- Est. tax savings @ 24.0%
- +$747
- After-tax cash flow
- $238/yr
For passive investors: Depreciation is non-cash, so a rental often shows a tax loss while cash-flowing — sheltering income. Rental losses are passive: they offset passive income freely, and up to $25,000/yr can offset ordinary (W-2) income if you actively participate and your MAGI is under $100k (phasing out to $0 by $150k); unused losses carry forward. On sale, claimed depreciation is recaptured at up to 25%, and gains may owe capital-gains tax (a 1031 exchange can defer both). Figures are a year-1 estimate at your 24.0% rate — not tax advice; consult a CPA.
Schools (NCES district)
- District
- Broward
- NCES district ID
- 1200180
- Math proficiency
- 42% ▼ -18.00%
- Reading proficiency
- 53% ▼ -5.00%
- Median HH income
- $52,139
- Composite
- 40.88/100
- National rank
- #3621
- State rank
- #46 of 73 in FL
Livability — Coral Springs
- Score
- 79/100
- State rank
- #145
- US rank
- #2163
Category grades
Schools grade is shown separately in the Schools card above.
Census & demographics
- Census place
- Coral Springs, FL
- County
- Broward County · 1,963,430 people
- City population
- 101,171
- Metro
- Miami-Fort Lauderdale-Pompano Beach, FL
- Population (ZIP)
- 58,916
- Household income
- $74,226
- Rent vs Own
- Severe rent burden
- 3488.0
Population outlook (Broward County) Hauer SSP2
- Today (2025)
- 2,207,033 people
- By 2030
- 2,360,704 · +7.0%
- By 2040
- 2,661,208 · +20.6%
- By 2050
- 2,946,698 · +33.5%
- By 2075
- 3,602,273 · +63.2%
- By 2100
- 3,970,984 · +79.9%
Race, ethnicity, and origin ACS 2023
- Neighborhood character
- Highly diverse neighborhood (Simpson 0.72)
- Race & ethnicity
- Hispanic / Latino 33% White 30% Black 28% Two or more races 21% Asian 3%
- Hispanic origin (detail)
- Mexican 4% Puerto Rican 5% Cuban 2% Dominican 3%
- Common ancestry
- Hispanic 9% Romanian 2% Estonian 1%
- Foreign-born
- 35% · Canada, Jamaica, China
- Languages at home
- 61% English-only · Spanish 26% French/Haitian/Cajun 8% Other Indo-European 3%
Political lean MEDSL · Broward
- 2024 margin
- D (+17.0) · D 58.0% · R 41.0%
- 2008→2024 swing
- -17.8pp toward R · 2008: 34.7pp · 2024: 17.0pp
- All cycles
- 2024: D+17.0 2020: D+29.8 2016: D+35.0 2012: D+34.9 2008: D+34.7
Not yet ingested
- Civics
- —
Market trends
- HPI YoY
- ▼ -113.43%
- Current HPI
- 402.3476
- Rent YoY
- ▬ -0.03%
- Metro
- Miami-Fort Lauderdale-Pompano Beach, FL
- State GDP YoY
- ▲ 3.28%
- F500 in state
- 36
Industry mix (Fortune 500 HQ in FL)
| Industry | F500 HQs | Revenue |
|---|---|---|
| Industrial Technology | 2 | $29B |
|
||
| Insurance | 2 | $17B |
|
||
| Retail | 1 | $60B |
|
||
| Technology Distribution | 1 | $58B |
|
||
| Homebuilding | 1 | $35B |
|
||
| Technology Manufacturing | 1 | $35B |
|
||
Price history
-96.5% since first listed9 events — show timeline
- 2026-05-08 Listed for Rent $2,000 RMLSFL
- 2026-05-08 Rental Removed $2,000 GFLMLS
- 2026-03-06 Listed for Rent $2,000 GFLMLS
- 2026-03-02 Listed $175,000 Beaches MLS
- 2025-11-22 Rental Removed $1,950 GFLMLS
- 2025-09-18 Price Changed $1,950 GFLMLS
- 2025-06-01 Listed for Rent $2,100 GFLMLS
- 1986-04-23 Sold (Public Records) $53,000 Public Records
- 1982-09-01 Sold (Public Records) $57,500 Public Records
Property tax history
+5.1%/yrLatest (2025): $1,040 · +5.4% YoY. Source: county tax records.
Cash-flow waterfall
monthlySold comps — $/sqft
last 12 mo · ≤1 miLoading sold comps…