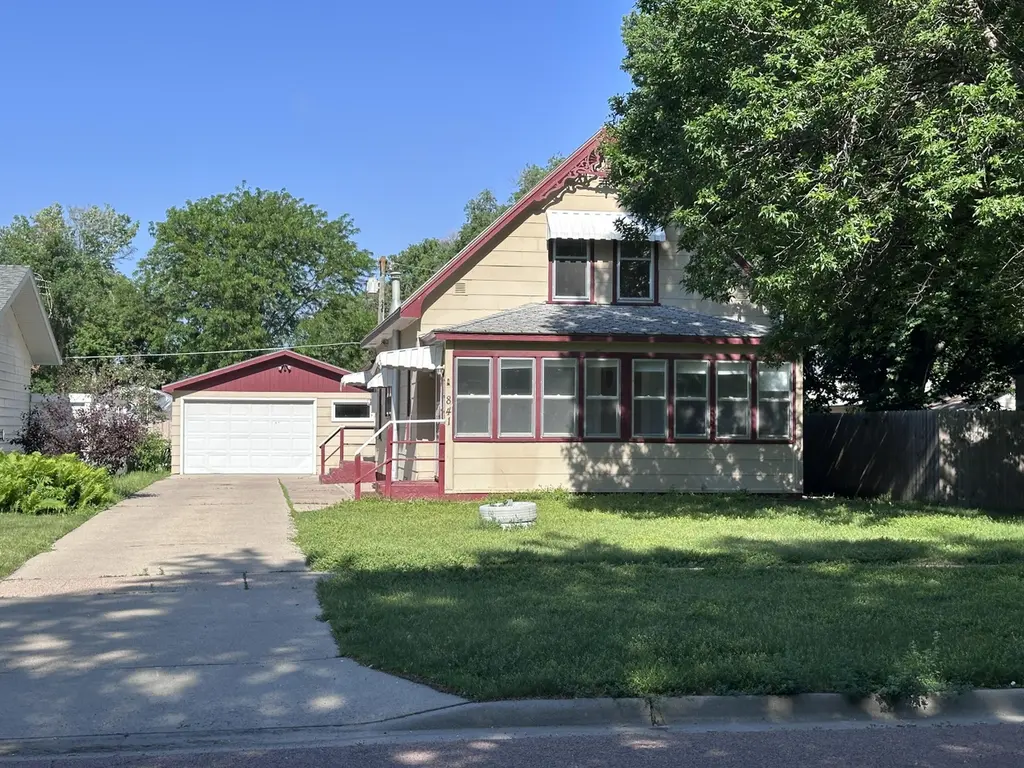
841 Michigan Ave SW · Huron, SD
Flood risk 1/10 · Minimal
- FEMA flood zone
- X (unshaded)
- Chance of flooding over 30 yrs
- 0.0%
- Est. flood insurance / yr
- $473 – $860
Fire risk 4/10 · Minor
- Est. fire insurance / yr
- $1,342 – $2,492
Heat risk 3/10 · Minor
- Hot days now (above 100°F)
- 7 days/yr
- Hot days in 30 yrs
- 14 days/yr
Wind risk 2/10 · Minimal
- Chance of severe wind over 30 yrs
- —
Air-quality risk 2/10 · Minimal
- Unhealthy air days now
- 1 days/yr
- Unhealthy air days in 30 yrs
- 1 days/yr
Risk factors via First Street. Map © Google.
Why this score? — see what drove the C- grade
The composite is a weighted blend of 9 inputs, each scored 0–100. Each bar is that input's sub-score; the figure is the points it added to the 100-point composite (weight × sub-score).
- Cash flow +16.8/30.0
- ARV discount +15.0/15.0
- DSCR +5.2/10.0
- Livability +3.6/5.0
- 1% rule +3.5/10.0
- Schools +3.1/10.0
- Rent growth +2.5/5.0
- Condition / age +2.5/5.0
- Appreciation +0.0/10.0
$135,000
🖨 Deal sheet (PDF) 📄 Offer letter ✓ Due diligence
Key facts
- 8,250 sq ft lot
- Garage
- Built 1925
Tags
Property features AI
Exterior
- Parking: One-car garage with garage door opener
- Home design: Residential property
- Exterior features: Paved road access; Lot dimensions approximately 50 x 165; Zoned R-2
Interior
- Bathrooms: Two three-quarter bathrooms
- Heating & cooling: Central cooling
- Interior features: Refrigerator included; Washer included; Dryer included; Has cooling
- Laundry & utility: Washer and dryer included
Neighborhood map
What this means for you Summary
Snapshot
- This is a 2-bed/2.0-bath single-family listed at $135k.
Deal economics
- At list price, monthly cash flow is $87 ($1k/yr) — positive.
- The deal already cash-flows at list — no discount required.
- To meet the 1% rule (rent ≥ 1% of price), the offer needs to be $115k (14.5% below list).
- Recommended offer: $115k (14.5% below list) — sets the bar for 1% rule.
- Cap rate 7.1% vs local median 4.0% in Huron — top-decile yield for the area; either an underpriced asset or a hidden risk that comps aren't pricing in. Stress-test before assuming the spread holds.
Location & tenants
- Location reads 72/100 on livability (#48 in SD) — a middle-class / working-renter tenant base. Strengths: cost of living A+, housing A+; Watch: employment C-, health & safety C-, amenities F.
- Huron School District 02-2 (town): math 30% / reading 44% proficiency, ranked #55 of 59 in SD (top 93%) — families likely to look elsewhere, expect single-tenant / working-renter base with shorter leases.
- Zoned schools: Huron Colony Elementary - 13 (math 24% / reading 24%, 17 students, 0% FRL); Huron Middle School - 02 (math 33% / reading 51%, grade D-, #93 of 143 statewide, top 67%, 695 students, 59% FRL); Huron High School - 01 (math 32% / reading 62%, grade D-, #108 of 151 statewide, top 71%, 836 students, 46% FRL).
- Market conditions: 149 active listings in the ZIP; 30 units permitted in Beadle County in 2024 (6 in 5+ unit buildings).
Forward outlook
- Local home prices are declining (-3.0%/yr); year-one equity from $933 of loan paydown is wiped out by about $4k of value loss. Plan a longer hold.
- Beadle County population projected at +39% by 2050 — long-run rental-demand tailwind backs the buy-and-hold thesis.
Negotiation context
- It's been on market 17 days — a 2% lower offer ($133k) is reasonable based on typical stale-listing flexibility.
- Current owner paid $50k; list at $135k implies a 170% gain — meaningful room to come down on a strong offer.
Risks & watch-outs
- Watch-outs: built in 1925 — expect roof / HVAC / electrical / plumbing capex.
Questions for the listing agent
- Built in 1925 — when were the roof, HVAC, electrical panel, plumbing, and water heater last replaced?
- Is there a deadline driving the sale (1031 exchange, divorce, estate, relocation)? That informs how much negotiation room exists.
- Schools are D-rated, which usually means shorter tenancies and higher turnover. Who's the typical renter profile here, and what's been the actual vacancy rate?
- What's the average days-on-market for RENTAL listings here right now (not sales)? A rising rental-DOM trend means longer vacancies and softer asking-rent achievability than the comps imply.
- What's the recent tenant-quality profile in this submarket — average credit score on applications, eviction rate, late-payment / NSF rate, and stable-employment percentage? A property-management company in the area should have these aggregated.
- How much new for-sale + rental construction is in the pipeline within 1–3 miles? Heavy new supply typically softens prices + rents 12–24 months out; constrained supply supports both.
Investment metrics
- 1% rule
- 0.85% ✗
- Cap rate
- 7.07%
- Cash-on-cash
- 2.77%
- DSCR
- 1.12
- GRM
- 9.7
CMA / ARV
- ARV (on-the-fly)
- $163,572
- Comps found
- 12
Show comp detail 12 sales within ~0.75 mi
| Address | Dist | Beds/Ba | Sqft | Sold | Price | $/sf | Match |
|---|---|---|---|---|---|---|---|
| 1134 7th St SW | 0.15mi | 3/1.0 (+1) | 1,852 (-3%) | 6mo | $158,500 | $86 | 74 |
| 645 10th St SW | 0.32mi | 3/2.5 (+1) | 1,964 (+3%) | 12mo | $171,000 | $87 | 63 |
| 658 9th St SW | 0.30mi | 2/2.0 | 2,016 (+6%) | 16mo | $211,000 | $105 | 63 |
| 465 Nebraska Ave SW | 0.57mi | 3/1.5 (+1) | 1,904 (+0%) | 5mo | $65,000 | $34 | 62 |
| 621 3rd St SW | 0.56mi | 3/1.5 (+1) | 1,890 (-1%) | 5mo | $98,000 | $52 | 61 |
| 747 Minnesota Ave SW | 0.11mi | 3/2.0 (+1) | 2,158 (+14%) | 20mo | $245,000 | $114 | 51 |
| 840 Colorado Ave SW | 0.44mi | 3/1.5 (+1) | 2,112 (+11%) | 5mo | $185,000 | $88 | 50 |
| 731 14th St SW | 0.46mi | 3/2.0 (+1) | 2,148 (+13%) | 9mo | $164,000 | $76 | 45 |
| 634 5th St SW | 0.41mi | 3/1.0 (+1) | 2,119 (+11%) | 10mo | $142,000 | $67 | 45 |
| 719 Wisconsin Ave SW | 0.73mi | 2/1.0 | 1,952 (+3%) | 22mo | $140,000 | $72 | 39 |
| 1241 3rd St SW | 0.52mi | 3/1.5 (+1) | 1,640 (-14%) | 18mo | $110,000 | $67 | 31 |
| 741 Wisconsin Ave SW | 0.73mi | 2/1.5 | 1,668 (-12%) | 18mo | $150,000 | $90 | 29 |
Match score weights: distance 35% · size 25% · config 20% · recency 20%. Top-matched comps best support the ARV.
Projected returns pro-forma
-3.0% appreciation · 3.0% rent growth · sell at horizon
- IRR
- -12.0%
- Equity multiple
- 0.57×
- Total profit
- $-16,360
- Equity at exit
- $20,129
- IRR
- -2.9%
- Equity multiple
- 0.81×
- Total profit
- $-7,280
- Equity at exit
- $11,672
Cash invested: $37,800 (down + closing). Projections, not guarantees.
Landlord ↔ Tenant lean methodology
- Overall (STATE)
- 83 Strongly Landlord-Friendly
- State South Dakota
- 83 Strongly Landlord-Friendly · R+16
- County
- — inherits STATE
- City
- — inherits STATE
ZIP-level market 57350
- Active inventory
- 149
- Price-to-rent
- 9.7×
Monthly cashflow live
- Estimated rent
- $1,154 medium interval (Pro) →
- Mortgage (P&I)
- −$708
- Tax from tax record
- −$60 /mo · $723/yr
- Insurance
- −$56
- HOA
- −$0
- Vacancy / Maint / Mgmt
- −$242
- Net cashflow
- $87
Break-even live
Sensitivity live
| Price | -10% $164 | -5% $126 | +0% $87 | +5% $49 | +10% $11 |
|---|---|---|---|---|---|
| Rent | -10% $-4 | -5% $42 | +0% $87 | +5% $133 | +10% $179 |
| Rate | -1.0pp $155 | -0.5pp $122 | base $87 | +0.5pp $52 | +1.0pp $17 |
UW: 25.0% down · 7.5% · 30yr · 1.5% tax · 5.0% vac · 8.0% maint · 8.0% mgmt
Financing live
Cash to close
- Down payment
- $33,750
- Closing costs
- $4,050
- Reserves months
- —
- Total cash needed
- —
Loan-product check · same deal, 3 products live
Conventional
25% down · 7.5% · 30yr
- Down + closing
- —
- Monthly P&I
- —
- Monthly cashflow
- —
- DSCR
- —
- Eligible?
- —
Personal DTI + credit; lowest rate.
DSCR
20% down · 8.5% · 30yr
- Down + closing
- —
- Monthly P&I
- —
- Monthly cashflow
- —
- DSCR
- —
- Eligible?
- —
No personal income docs; deal must DSCR.
Hard money
10% down · 12.0% · 12mo
- Down + closing
- —
- Monthly P&I
- —
- Monthly cashflow
- —
- DSCR
- —
- Eligible?
- —
Short-term bridge; refi at stabilization.
Listing history 12 events
-
2026-06-21days on market $135,000 Active 17 DOM
-
2026-06-21days on market $135,000 Active 16 DOM
-
2026-06-18days on market $135,000 Active 14 DOM
-
2026-06-17days on market $135,000 Active 13 DOM
-
2026-06-16days on market $135,000 Active 12 DOM
-
2026-06-15days on market $135,000 Active 11 DOM
-
2026-06-13days on market $135,000 Active 9 DOM
-
2026-06-12days on market $135,000 Active 8 DOM
-
2026-06-09days on market $135,000 Active 5 DOM
-
2026-06-08days on market $135,000 Active 4 DOM
-
2026-06-08days on market $135,000 Active 3 DOM
-
2026-06-05$135,000 Active 1 DOM
ⓘ Source: listings_history table (triggers on properties + properties_extension) + one-shot
backfill from property_details.listing_events for pre-trigger history.
Tax reassessment forecast SD · Resets to sale price
- Current annual tax
- $723 · $60/mo
- Projected year-2 tax
- $1,768 · $147/mo
- Expected delta
- +$1,045/yr (+$87/mo · 144.5%)
ⓘ Screening estimate from a state-policy table — verify with the county assessor before closing.
Climate risk First Street
- Flood 1/10 Low FEMA zone X (unshaded) · 0% chance over 30 yrs
- Wildfire 4/10 Moderate
- Heat 3/10 Moderate 7 d/yr ≥100°F today · 14 d/yr by 30 yrs out
- Wind 2/10 Low
- Air quality 2/10 Low 1 unhealthy d/yr today · 1 by 30 yrs out
Nearby sold comps map
Loading sold comps map…
Walkable amenities ~0.75 mi
Loading nearby amenities…
Taxation est. · year 1
- Rental income
- $13,851
- − Mortgage interest
- −$7,562
- − Property taxes
- −$723
- − Insurance
- −$675
- − Repairs & maintenance
- −$1,108
- − Management
- −$1,108
- − Depreciation
- −$3,927
- Taxable loss
- −$1,253
- Est. tax savings @ 24.0%
- +$301
- After-tax cash flow
- $1,349/yr
For passive investors: Depreciation is non-cash, so a rental often shows a tax loss while cash-flowing — sheltering income. Rental losses are passive: they offset passive income freely, and up to $25,000/yr can offset ordinary (W-2) income if you actively participate and your MAGI is under $100k (phasing out to $0 by $150k); unused losses carry forward. On sale, claimed depreciation is recaptured at up to 25%, and gains may owe capital-gains tax (a 1031 exchange can defer both). Figures are a year-1 estimate at your 24.0% rate — not tax advice; consult a CPA.
Schools (NCES district)
- District
- Huron School District 02-2
- NCES district ID
- 4635480
- Math proficiency
- 30% ▼ -7.00%
- Reading proficiency
- 44% ▼ -2.00%
- Median HH income
- $43,613
- Composite
- 31.35/100
- National rank
- #5998
- State rank
- #55 of 59 in SD
Livability — Huron
- Score
- 72/100
- State rank
- #48
- US rank
- #6463
Category grades
Schools grade is shown separately in the Schools card above.
Census & demographics
- Census place
- Huron, SD
- Population (ZIP)
- 16,148
Population outlook (Beadle County) Hauer SSP2
- Today (2025)
- 20,094 people
- By 2030
- 21,218 · +5.6%
- By 2040
- 24,042 · +19.6%
- By 2050
- 27,931 · +39.0%
- By 2075
- 43,296 · +115.5%
- By 2100
- 65,888 · +227.9%
Race, ethnicity, and origin ACS 2023
- Neighborhood character
- Majority White (65%)
- Race & ethnicity
- White 65% Hispanic / Latino 16% Asian 11% Two or more races 7% Pacific Islander 2% Native American 1% Black 1%
- Hispanic origin (detail)
- Mexican 7% Puerto Rican 2%
- Common ancestry
- Portuguese 8% Iranian 4% Lithuanian 2%
- Foreign-born
- 15% · Canada, Philippines, Vietnam
- Languages at home
- 80% English-only · Spanish 9% Other Asian/Pacific 7% Vietnamese 2%
Political lean MEDSL · Beadle
- 2024 margin
- Solid R (+40.1) · D 28.8% · R 68.8% · Other 2.4%
- 2008→2024 swing
- -32.8pp toward R · 2008: -7.3pp · 2024: -40.1pp
- All cycles
- 2024: R+40.1 2020: R+38.1 2016: R+37.6 2012: R+18.6 2008: R+7.3
Not yet ingested
- Civics
- —
Market trends
- HPI YoY
- ▼ -116.91%
- Current HPI
- 141.3376
- Rent YoY
- —
- Metro
- —
- State GDP YoY
- ▲ 0.70%
- F500 in state
- 2
Industry mix (Fortune 500 HQ in SD)
| Industry | F500 HQs | Revenue |
|---|---|---|
| Utilities | 1 | $1B |
|
||
Price history
+170.0% since first listed2 events — show timeline
- 2026-06-04 Listed $135,000 HBOR
- 2015-01-13 Sold (Public Records) $50,000 Public Records
Property tax history
-3.9%/yrLatest (2026): $723 · -46.5% YoY. Source: county tax records.
Cash-flow waterfall
monthlySold comps — $/sqft
last 12 mo · ≤1 miLoading sold comps…