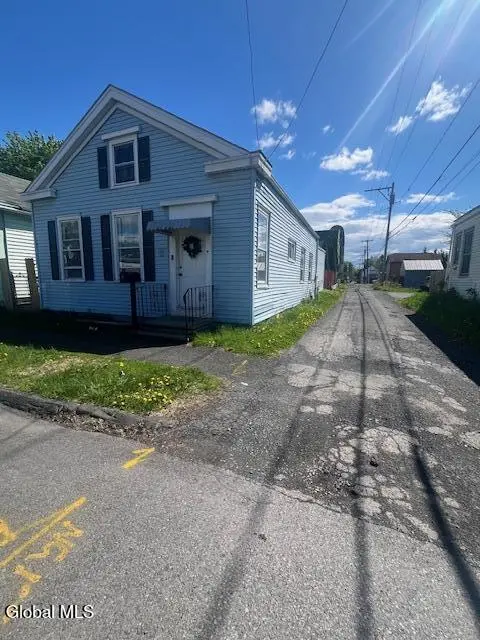
40 113th St · Troy, NY
Flood risk 7/10 · Major
- FEMA flood zone
- X
- Chance of flooding over 30 yrs
- 0.74%
- Est. flood insurance / yr
- $473 – $860
Fire risk 3/10 · Minor
- Est. fire insurance / yr
- $691 – $1,283
Heat risk 4/10 · Minor
- Hot days now (above 95°F)
- 7 days/yr
- Hot days in 30 yrs
- 18 days/yr
Wind risk 3/10 · Minor
- Chance of severe wind over 30 yrs
- 6.0%
Air-quality risk 2/10 · Minimal
- Unhealthy air days now
- 0 days/yr
- Unhealthy air days in 30 yrs
- 1 days/yr
Risk factors via First Street. Map © Google.
Why this score? — see what drove the B grade
The composite is a weighted blend of 9 inputs, each scored 0–100. Each bar is that input's sub-score; the figure is the points it added to the 100-point composite (weight × sub-score).
- Cash flow +27.2/30.0
- ARV discount +15.0/15.0
- DSCR +9.5/10.0
- 1% rule +7.4/10.0
- Livability +4.0/5.0
- Schools +2.8/10.0
- Rent growth +2.5/5.0
- Condition / age +2.5/5.0
- Appreciation +0.0/10.0
$149,000
🖨 Deal sheet (PDF) 📄 Offer letter ✓ Due diligence
Listing remarks MLS
WOW! Best deal in Town. Bright, just renovated, in move-in condition. New kitchen cabinets, New stove and refrigerator, lovely yard. Immediate occupancy -- Very Good Condition
Key facts
- Great curb appeal
- Bathroom expanded
- Entire yard fenced
Tags
Property features AI
Exterior
- Parking: 3 parking spaces
- Utilities: Public water; Public sewer
- Home design: Single family residence; Living area approximately 1,548; Vinyl siding
- Construction: Vinyl siding construction
- Exterior features: Exterior lighting
Interior
- Kitchen: Dishwasher; Gas oven; Refrigerator
- Bedrooms: Bedroom on the first floor; Bedroom on the second floor; Office on the first floor (can function as a bedroom or flexible space)
- Bathrooms: 1 full bathroom on the first floor
- Heating & cooling: Forced air heating; Natural gas heating
- Interior features: 7 total rooms; Crawl space basement; Interior lighting
Neighborhood map
What this means for you Summary
Snapshot
- This is a 2-bed/1.0-bath single-family listed at $149k.
Deal economics
- At list price, monthly cash flow is $371 ($4k/yr) — positive.
- The deal already cash-flows at list — no discount required.
- Meets the 1% rule at list price ($2k rent vs $149k).
- Recommended offer: $145k (3.0% below list) — sets the bar for market timing.
- Cap rate 9.7% vs local median 5.3% in Troy — top-decile yield for the area; either an underpriced asset or a hidden risk that comps aren't pricing in. Stress-test before assuming the spread holds.
Location & tenants
- Location reads 81/100 on livability (#88 in NY, #1,350 nationally) — a professional / high-income tenant draw. Strengths: amenities A+, commute A+, housing A+; Watch: employment C-, crime F.
- Lansingburgh Central School District (urban): math 31% / reading 35% proficiency, ranked #566 of 590 in NY (top 96%) — families likely to look elsewhere, expect single-tenant / working-renter base with shorter leases.
- Zoned schools: Turnpike Elementary School (534 students, 61% FRL); Knickerbacker Middle School (math 15% / reading 35%, grade F, #601 of 729 statewide, top 82%, 471 students, 75% FRL); Lansingburgh Senior High School (math 92%, 638 students, 75% FRL) — zoned schools average 70% FRL vs 51% district-wide (19 pts higher); higher-poverty schools than district average — tighter screening recommended.
- Market conditions: 76 active listings in the ZIP; 17 comparable units currently listed for rent nearby; rentals at typical pace (median 21d on market — plan ~3-4 weeks tenant-placement turnaround); 405 units permitted in Rensselaer County in 2024 (224 in 5+ unit buildings).
Forward outlook
- Local home prices are declining (-3.0%/yr); year-one equity from $1k of loan paydown is wiped out by about $4k of value loss. Plan a longer hold.
- Rensselaer County population projected to shrink 6% by 2050 — rents likely to lag national; underwrite the cash flow, not the appreciation.
Negotiation context
- It's been on market 40 days — a 3% lower offer ($145k) is reasonable based on typical stale-listing flexibility.
- 6 sale attempts since 28y ago with the ask held roughly flat each time — persistent listings suggest the price (not the market) is what's stuck; bring a comps-based counter.
- Current owner paid $60k; list at $149k implies a 148% gain — meaningful room to come down on a strong offer.
Risks & watch-outs
- Watch-outs: flood insurance adds $56/mo; built in 1890 — expect roof / HVAC / electrical / plumbing capex.
- Climate carrying-cost: major flood risk — expect insurance premiums to compound above CPI over the hold.
Questions for the listing agent
- It's been on market 40 days. Have you received any prior offers? Is the seller open to a 3% concession, seller financing, or rate buy-down credit?
- Built in 1890 — when were the roof, HVAC, electrical panel, plumbing, and water heater last replaced?
- What's the actual annual flood-insurance premium (NFIP or private), and is the property in a SFHA with mandatory coverage?
- Is there a deadline driving the sale (1031 exchange, divorce, estate, relocation)? That informs how much negotiation room exists.
- Crime grade is F in this area — have there been break-ins, vandalism, or insurance claims at this property in the last 3 years? What carrier currently insures it and at what premium?
- What's the average days-on-market for RENTAL listings here right now (not sales)? A rising rental-DOM trend means longer vacancies and softer asking-rent achievability than the comps imply.
- What's the recent tenant-quality profile in this submarket — average credit score on applications, eviction rate, late-payment / NSF rate, and stable-employment percentage? A property-management company in the area should have these aggregated.
- How much new for-sale + rental construction is in the pipeline within 1–3 miles? Heavy new supply typically softens prices + rents 12–24 months out; constrained supply supports both.
Investment metrics
- 1% rule
- 1.24% ✓
- Cap rate
- 9.73%
- Cash-on-cash
- 12.28%
- DSCR
- 1.55
- GRM
- 6.7
CMA / ARV
- ARV (median comp)
- $231,540
- List price
- $149,000
- Delta
- -35.65%
- Verdict
- UNDERPRICED
- Comps
- 20 within 1.0 mi
Show comp detail 12 sales within ~0.75 mi
| Address | Dist | Beds/Ba | Sqft | Sold | Price | $/sf | Match |
|---|---|---|---|---|---|---|---|
| 477 9th Ave | 0.21mi | 3/2.0 (+1) | 1,440 (-8%) | 2mo | $185,000 | $128 | 66 |
| 13 111th St | 0.25mi | 3/2.0 (+1) | 1,440 (-8%) | 2mo | $158,000 | $110 | 64 |
| 476 W Park Pl | 0.15mi | 2/2.5 | 1,632 (+4%) | 18mo | $280,000 | $172 | 64 |
| 22 115th St | 0.22mi | 3/2.0 (+1) | 1,655 (+6%) | 9mo | $225,000 | $136 | 64 |
| 425 7th Ave | 0.22mi | 3/1.0 (+1) | 1,503 (-4%) | 21mo | $175,000 | $116 | 61 |
| 351 6th Ave | 0.42mi | 3/1.5 (+1) | 1,488 (-5%) | 15mo | $212,000 | $142 | 53 |
| 362 3rd Ave | 0.43mi | 3/1.5 (+1) | 1,418 (-10%) | 8mo | $216,000 | $152 | 51 |
| 660 5th Ave | 0.44mi | 2/1.0 | 1,750 (+12%) | 12mo | $250,000 | $143 | 50 |
| 6 Breslin Ave | 0.57mi | 3/1.5 (+1) | 1,396 (-11%) | 12mo | $242,500 | $174 | 38 |
| 752 7th Ave | 0.69mi | 3/2.0 (+1) | 1,394 (-11%) | 3mo | $236,380 | $170 | 38 |
| 302 6th Ave | 0.55mi | 3/1.5 (+1) | 1,725 (+10%) | 16mo | $255,000 | $148 | 38 |
| 668 6th Ave | 0.48mi | 3/1.0 (+1) | 1,340 (-14%) | 16mo | $114,660 | $86 | 35 |
Match score weights: distance 35% · size 25% · config 20% · recency 20%. Top-matched comps best support the ARV.
Projected returns pro-forma
-3.0% appreciation · 3.0% rent growth · sell at horizon
- IRR
- -0.3%
- Equity multiple
- 0.99×
- Total profit
- $-424
- Equity at exit
- $22,216
- IRR
- 9.4%
- Equity multiple
- 1.73×
- Total profit
- $30,347
- Equity at exit
- $12,883
Cash invested: $41,720 (down + closing). Projections, not guarantees.
Landlord ↔ Tenant lean methodology
- Overall (STATE)
- 15 Strongly Tenant-Friendly
- State New York
- 15 Strongly Tenant-Friendly · D+10
- County
- — inherits STATE
- City
- — inherits STATE
ZIP-level market 12182
- Home prices YoY
- -15.6%
- Active inventory
- 76
- Price-to-rent
- 6.7×
Monthly cashflow live
- Estimated rent
- $1,844 high interval (Pro) →
- Mortgage (P&I)
- −$781
- Tax est. 1.5%
- −$186 /mo · $2,235/yr
- Insurance
- −$62
- Flood insurance flood zone
- −$56 /mo · $666/yr
- HOA
- −$0
- Vacancy / Maint / Mgmt
- −$387
- Net cashflow
- $371
Break-even live
Sensitivity live
| Price | -10% $474 | -5% $423 | +0% $371 | +5% $320 | +10% $268 |
|---|---|---|---|---|---|
| Rent | -10% $226 | -5% $299 | +0% $371 | +5% $444 | +10% $517 |
| Rate | -1.0pp $447 | -0.5pp $409 | base $371 | +0.5pp $333 | +1.0pp $294 |
UW: 25.0% down · 7.5% · 30yr · 1.5% tax · 5.0% vac · 8.0% maint · 8.0% mgmt
Financing live
Cash to close
- Down payment
- $37,250
- Closing costs
- $4,470
- Reserves months
- —
- Total cash needed
- —
Loan-product check · same deal, 3 products live
Conventional
25% down · 7.5% · 30yr
- Down + closing
- —
- Monthly P&I
- —
- Monthly cashflow
- —
- DSCR
- —
- Eligible?
- —
Personal DTI + credit; lowest rate.
DSCR
20% down · 8.5% · 30yr
- Down + closing
- —
- Monthly P&I
- —
- Monthly cashflow
- —
- DSCR
- —
- Eligible?
- —
No personal income docs; deal must DSCR.
Hard money
10% down · 12.0% · 12mo
- Down + closing
- —
- Monthly P&I
- —
- Monthly cashflow
- —
- DSCR
- —
- Eligible?
- —
Short-term bridge; refi at stabilization.
Rent comps 17 comps
| Address | Beds | Baths | Sqft | Rent | $/sqft | DOM | Units | Dist |
|---|---|---|---|---|---|---|---|---|
| 12 Stoneledge Dr Apt 1 Troy, NY | 2.0 | 2.0 | 1210 | $2,000 | $1.65 | 45d | 1 | 0.59mi |
| 290 2nd Ave Troy, NY | 3.0 | 1.0 | 1400 | $1,600 | $1.14 | 23d | 1 | 0.60mi |
| 413 Diamond Rock Cir Troy, NY | 2.0 | 2.0 | 1252 | $2,100 | $1.68 | 21d | 1 | 0.63mi |
| 413 Diamond Rock Cir Troy, NY | 2.0 | 2.0 | 1252 | $2,100 | $1.68 | 16d | 1 | 0.63mi |
| 100 Waters View Cir Cohoes, NY | 1.0–2.0 | 1.0–2.5 | 1281 | $2,413 | $1.88 | 16d | 13 | 0.66mi |
| 750 2nd Ave Troy, NY | 1.0–3.0 | 1.0–1.5 | 1185 | $1,263 | $1.07 | 16d | 1 | 0.70mi |
| 53 Park Ave Cohoes, NY | 3.0 | 1.0 | 1875 | $1,600 | $0.85 | 16d | 1 | 0.72mi |
| 157 6th Ave Unit 2 Troy, NY | 3.0 | 1.0 | 1300 | $1,350 | $1.04 | 21d | 1 | 0.94mi |
| 140 5th Ave Unit 2 Troy, NY | 3.0 | 1.0 | 1200 | $1,395 | $1.16 | 25d | 1 | 0.99mi |
| 11 Parker Ln Unit 5 Waterford, NY | 2.0 | 2.5 | 1500 | $2,800 | $1.87 | 16d | 1 | 1.10mi |
| 192 Saratoga St Cohoes, NY | 1.0–3.0 | 1.0–3.0 | 1157 | $1,998 | $1.73 | 16d | 4 | 1.25mi |
| 12 White St Cohoes, NY | 3.0 | 2.0 | 1790 | $2,895 | $1.62 | 21d | 1 | 1.36mi |
| 196 Main St Cohoes, NY | 2.0 | 1.0 | 1200 | $1,375 | $1.15 | 25d | 1 | 1.36mi |
| 338 Saratoga St Unit 2 Cohoes, NY | 3.0 | 1.5 | 1200 | $1,495 | $1.25 | 45d | 1 | 1.37mi |
| 129 Main St Cohoes, NY | 2.0 | 1.0 | 1104 | $1,350 | $1.22 | 45d | 1 | 1.38mi |
| 53 Main St Unit 3 Cohoes, NY | 3.0 | 1.0 | 1200 | $1,345 | $1.12 | 25d | 1 | 1.41mi |
| 300 Ontario St Cohoes, NY | 3.0 | 1.0 | 1100 | $1,600 | $1.45 | 16d | 1 | 1.42mi |
Listing history 40 events
-
2026-06-22days on market $149,000 Active 40 DOM
-
2026-06-18days on market $149,000 Active 37 DOM
-
2026-06-17days on market $149,000 Active 36 DOM
-
2026-06-16days on market $149,000 Active 35 DOM
-
2026-06-15price $149,000 Active 34 DOM
-
2026-06-15days on market $155,000 Active 34 DOM
-
2026-06-14days on market $155,000 Active 32 DOM
-
2026-06-10days on market $155,000 Active 29 DOM
-
2026-06-09days on market $155,000 Active 28 DOM
-
2026-06-08days on market $155,000 Active 27 DOM
-
2026-06-07days on market $155,000 Active 26 DOM
-
2026-06-05days on market $155,000 Active 23 DOM
-
2026-06-03days on market $155,000 Active 22 DOM
-
2026-06-02days on market $155,000 Active 21 DOM
-
2026-06-01days on market $155,000 Active 20 DOM
-
2026-05-31days on market $155,000 Active 19 DOM
-
2026-05-31days on market $155,000 Active 18 DOM
-
2026-05-11$155,000 Active 453-char remark
-
2018-06-27soldstatus $60,000 Closed (Final Sale) 178-char remark
Show marketing remark (178 chars)
WOW! Best deal in Town. Bright, just renovated, in move-in condition. New kitchen cabinets, New stove and refrigerator, lovely yard. Immediate occupancy -- Very Good Condition
-
2017-03-28historical 178-char remark
Show marketing remark (178 chars)
WOW! Best deal in Town. Bright, just renovated, in move-in condition. New kitchen cabinets, New stove and refrigerator, lovely yard. Immediate occupancy -- Very Good Condition
-
2017-02-03price $69,800 178-char remark
Show marketing remark (178 chars)
WOW! Best deal in Town. Bright, just renovated, in move-in condition. New kitchen cabinets, New stove and refrigerator, lovely yard. Immediate occupancy -- Very Good Condition
-
2017-02-02price $69,900 178-char remark
Show marketing remark (178 chars)
WOW! Best deal in Town. Bright, just renovated, in move-in condition. New kitchen cabinets, New stove and refrigerator, lovely yard. Immediate occupancy -- Very Good Condition
-
2017-01-30price $79,900 178-char remark
Show marketing remark (178 chars)
WOW! Best deal in Town. Bright, just renovated, in move-in condition. New kitchen cabinets, New stove and refrigerator, lovely yard. Immediate occupancy -- Very Good Condition
-
2017-01-30price $69,900 178-char remark
Show marketing remark (178 chars)
WOW! Best deal in Town. Bright, just renovated, in move-in condition. New kitchen cabinets, New stove and refrigerator, lovely yard. Immediate occupancy -- Very Good Condition
-
2017-01-20price $79,899 178-char remark
Show marketing remark (178 chars)
WOW! Best deal in Town. Bright, just renovated, in move-in condition. New kitchen cabinets, New stove and refrigerator, lovely yard. Immediate occupancy -- Very Good Condition
-
2017-01-08$79,900 New 178-char remark
Show marketing remark (178 chars)
WOW! Best deal in Town. Bright, just renovated, in move-in condition. New kitchen cabinets, New stove and refrigerator, lovely yard. Immediate occupancy -- Very Good Condition
-
2017-01-01historical
-
2016-12-27price $89,900
-
2016-11-22price $79,900
-
2016-10-07$89,900 New
-
2011-03-03soldstatus $26,000
-
2010-12-10soldstatus $26,000
-
2010-10-13historical
-
2010-10-06$19,900
-
2010-09-02historical
-
2010-02-22$29,900
-
1998-04-08soldstatus $54,000
-
1998-04-01soldstatus $54,000
-
1998-02-28historical
-
1998-01-28$57,500
ⓘ Source: listings_history table (triggers on properties + properties_extension) + one-shot
backfill from property_details.listing_events for pre-trigger history.
Climate risk First Street
- Flood 7/10 Severe FEMA zone X · 74% chance over 30 yrs
- Wildfire 3/10 Moderate
- Heat 4/10 Moderate 7 d/yr ≥95°F today · 18 d/yr by 30 yrs out
- Wind 3/10 Moderate 6% chance of damaging wind over 30 yrs
- Air quality 2/10 Low 0 unhealthy d/yr today · 1 by 30 yrs out
Nearby sold comps map
Loading sold comps map…
Walkable amenities ~0.75 mi
Loading nearby amenities…
Taxation est. · year 1
- Rental income
- $22,127
- − Mortgage interest
- −$8,346
- − Property taxes
- −$2,235
- − Insurance
- −$1,412
- − Repairs & maintenance
- −$1,770
- − Management
- −$1,770
- − Depreciation
- −$4,335
- Taxable income
- $2,260
- Est. tax owed @ 24.0%
- −$542
- After-tax cash flow
- $3,915/yr
For passive investors: Depreciation is non-cash, so a rental often shows a tax loss while cash-flowing — sheltering income. Rental losses are passive: they offset passive income freely, and up to $25,000/yr can offset ordinary (W-2) income if you actively participate and your MAGI is under $100k (phasing out to $0 by $150k); unused losses carry forward. On sale, claimed depreciation is recaptured at up to 25%, and gains may owe capital-gains tax (a 1031 exchange can defer both). Figures are a year-1 estimate at your 24.0% rate — not tax advice; consult a CPA.
Schools (NCES district)
- District
- Lansingburgh Central School District
- NCES district ID
- 3616740
- Math proficiency
- 31% ▼ -7.00%
- Reading proficiency
- 35% ▼ -6.00%
- Median HH income
- $44,807
- Composite
- 28.19/100
- National rank
- #6810
- State rank
- #566 of 590 in NY
Livability — Troy
- Score
- 81/100
- State rank
- #88
- US rank
- #1350
Category grades
Schools grade is shown separately in the Schools card above.
Census & demographics
- Census place
- Troy, NY
- City population
- 53,479
- Population (ZIP)
- 14,273
Population outlook (Rensselaer County) Hauer SSP2
- Today (2025)
- 162,400 people
- By 2030
- 161,746 · -0.4%
- By 2040
- 158,095 · -2.7%
- By 2050
- 152,966 · -5.8%
- By 2075
- 140,767 · -13.3%
- By 2100
- 124,727 · -23.2%
Race, ethnicity, and origin ACS 2023
- Neighborhood character
- Predominantly White (70%)
- Race & ethnicity
- White 70% Black 14% Two or more races 12% Hispanic / Latino 7%
- Hispanic origin (detail)
- Puerto Rican 6%
- Common ancestry
- Lithuanian 7% Romanian 3% Iranian 1%
- Foreign-born
- 3% · Canada, Jamaica
- Languages at home
- 94% English-only · Spanish 4% Other Indo-European 1%
Political lean MEDSL · Rensselaer
- 2024 margin
- Toss-up / Even · D 50.7% · R 49.3%
- 2008→2024 swing
- -8.0pp toward R · 2008: 9.3pp · 2024: 1.4pp
- All cycles
- 2024: D+1.4 2020: D+5.6 2016: R+2.9 2012: D+11.8 2008: D+9.3
Not yet ingested
- Civics
- —
Market trends
- HPI YoY
- ▼ -50.58%
- Current HPI
- 273.5758
- Rent YoY
- —
- Metro
- —
- State GDP YoY
- ▲ 2.60%
- F500 in state
- 92
Industry mix (Fortune 500 HQ in NY)
| Industry | F500 HQs | Revenue |
|---|---|---|
| Financial Services | 10 | $950B |
|
||
| Consumer Goods | 9 | $162B |
|
||
| Insurance | 4 | $225B |
|
||
| Telecommunications | 2 | $144B |
|
||
| Pharmaceuticals | 2 | $112B |
|
||
| Media / Entertainment | 2 | $69B |
|
||
Price history
+159.1% since first listed24 events — show timeline
- 2026-06-15 Price Changed $149,000 Global MLS
- 2026-05-11 Listed $155,000 Global MLS
- 2018-06-27 Sold (MLS) $60,000 Global MLS
- 2017-03-28 Listing Removed — Global MLS
- 2017-02-03 Price Changed $69,800 Global MLS
- 2017-02-02 Price Changed $69,900 Global MLS
- 2017-01-30 Price Changed $79,900 Global MLS
- 2017-01-30 Price Changed $69,900 Global MLS
- 2017-01-20 Price Changed $79,899 Global MLS
- 2017-01-08 Listed $79,900 Global MLS
- 2017-01-01 Listing Removed — Global MLS
- 2016-12-27 Price Changed $89,900 Global MLS
- 2016-11-22 Price Changed $79,900 Global MLS
- 2016-10-07 Listed $89,900 Global MLS
- 2011-03-03 Sold (Public Records) $26,000 Public Records
- 2010-12-10 Sold (MLS) $26,000 Global MLS
- 2010-10-13 Listing Removed — Global MLS
- 2010-10-06 Listed $19,900 Global MLS
- 2010-09-02 Listing Removed — Global MLS
- 2010-02-22 Listed $29,900 Global MLS
- 1998-04-08 Sold (Public Records) $54,000 Public Records
- 1998-04-01 Sold (MLS) $54,000 Global MLS
- 1998-02-28 Listing Removed — Global MLS
- 1998-01-28 Listed $57,500 Global MLS
Property tax history
+18.9%/yrLatest (2025): $7,516 · -15.3% YoY. Source: county tax records.
Cash-flow waterfall
monthlySold comps — $/sqft
last 12 mo · ≤1 miLoading sold comps…