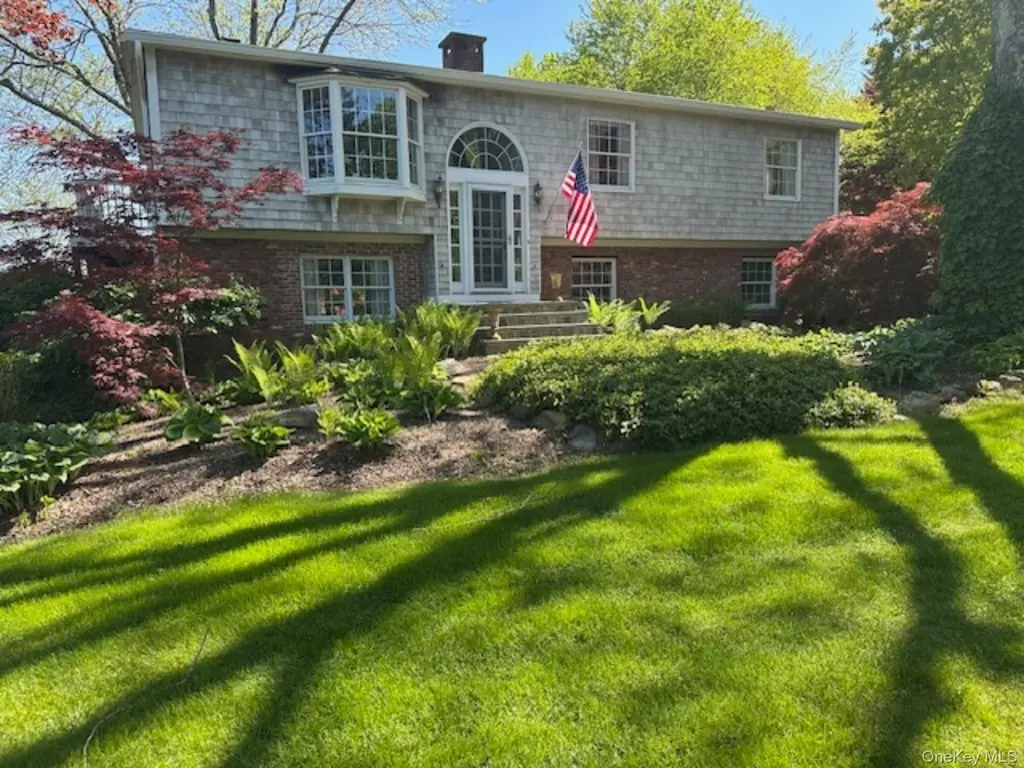
475 Mooney Hill Rd · Lake Carmel, NY
Flood risk 1/10 · Minimal
- FEMA flood zone
- X (unshaded)
- Chance of flooding over 30 yrs
- 0.0%
- Est. flood insurance / yr
- $473 – $860
Fire risk 5/10 · Moderate
- Est. fire insurance / yr
- $691 – $1,283
Heat risk 4/10 · Minor
- Hot days now (above 97°F)
- 7 days/yr
- Hot days in 30 yrs
- 15 days/yr
Wind risk 4/10 · Minor
- Chance of severe wind over 30 yrs
- 17.0%
Air-quality risk 3/10 · Minor
- Unhealthy air days now
- 2 days/yr
- Unhealthy air days in 30 yrs
- 3 days/yr
Risk factors via First Street. Map © Google.
Why this score? — see what drove the C grade
The composite is a weighted blend of 9 inputs, each scored 0–100. Each bar is that input's sub-score; the figure is the points it added to the 100-point composite (weight × sub-score).
- Cash flow +24.2/30.0
- DSCR +7.8/10.0
- 1% rule +6.4/10.0
- Schools +5.0/10.0
- ARV discount +4.0/15.0
- Livability +3.3/5.0
- Rent growth +2.5/5.0
- Condition / age +2.5/5.0
- Appreciation +0.0/10.0
$699,000
🖨 Deal sheet 📄 Offer letter ✓ Due diligence
Listing remarks
12 MONTH HOME WARRANTY INCLUDED! When you buy, if any appliance stops working, you're COVERED! If you have any plumbing issues, you're COVERED, if you have electrical issues, you're COVERED! Welcome to 475 Mooney Hill Road, a beautifully maintained and thoughtfully updated home nestled on over an acre of meticulously landscaped grounds in Patterson. Lovingly cared for by the same owners for more than four decades, this exceptional property offers a rare combination of comfort, craftsmanship, and outdoor beauty. Step outside to your own private retreat featuring an in-ground pool with pool house, a tranquil water garden, lush perennial plantings, and a stunning wraparound deck overlooking t
Key facts
- 1.04 acre lot
- 2 garage spots
- Pool
Property features AI
Exterior
- Parking: Driveway parking for up to 5 vehicles; Attached garage with 2 spaces
- Utilities: Electricity connected (NYSEG); Septic tank
- Home design: Single family residence
- Construction: Cedar construction
- Exterior features: Private in-ground pool with fencing; Not waterfront
Interior
- Kitchen: Convection oven; Dishwasher; Gas cooktop; Microwave; Refrigerator; Stainless steel appliances
- Bedrooms: Total rooms: 7; Attic: full; Basement: finished full walk-out access
- Bathrooms: 2 full bathrooms; 1 half bathroom
- Heating & cooling: Central air; Baseboard heating; Hot water heating; Oil heating
- Interior features: Eat-in kitchen; Entrance foyer; Formal dining room; Granite counters; Primary bathroom
- Laundry & utility: Dryer
Neighborhood map
What this means for you Summary
Snapshot
- This is a 3-bed/2.0-bath single-family listed at $699k.
Deal economics
- At list price, monthly cash flow is $1k ($17k/yr) — positive.
- The deal already cash-flows at list — no discount required.
- Meets the 1% rule at list price ($8k rent vs $699k).
- Cap rate 8.7% vs local median 2.3% in Lake Carmel — top-decile yield for the area; either an underpriced asset or a hidden risk that comps aren't pricing in. Stress-test before assuming the spread holds.
Location & tenants
- Location reads 66/100 on livability (#650 in NY) — a middle-class / working-renter tenant base. Strengths: employment A+, housing A+; Watch: schools D-, amenities F, commute F.
- Carmel Central School District (suburban): math 46% / reading 63% proficiency, ranked #258 of 590 in NY (top 44%) — acceptable for families but not a draw, mixed tenant base, ~2y average lease; only 17% free/reduced lunch — higher-income household profile.
- Market conditions: 49 active listings in the ZIP; 1 comparable units currently listed for rent nearby; 142 units permitted in Putnam County in 2024 (75 in 5+ unit buildings).
Forward outlook
- Local home prices are declining (-3.0%/yr); year-one equity from $5k of loan paydown is wiped out by about $21k of value loss. Plan a longer hold.
- Putnam County population projected to shrink 3% by 2050 — rents likely to lag national; underwrite the cash flow, not the appreciation.
Negotiation context
- Only 9 days on market — expect competitive offers; lowballing is unlikely to land.
- 3 sale attempts with the ask held roughly flat each time — persistent listings suggest the price (not the market) is what's stuck; bring a comps-based counter.
- Current owner paid $70k; list at $699k implies a 899% gain — meaningful room to come down on a strong offer.
Risks & watch-outs
- Climate carrying-cost: moderate wildfire risk — expect insurance premiums to compound above CPI over the hold.
Questions for the listing agent
- Built in 1978 — when were the roof, HVAC, electrical panel, plumbing, and water heater last replaced?
- Is there a deadline driving the sale (1031 exchange, divorce, estate, relocation)? That informs how much negotiation room exists.
- Schools are D-rated, which usually means shorter tenancies and higher turnover. Who's the typical renter profile here, and what's been the actual vacancy rate?
- What's the average days-on-market for RENTAL listings here right now (not sales)? A rising rental-DOM trend means longer vacancies and softer asking-rent achievability than the comps imply.
- What's the recent tenant-quality profile in this submarket — average credit score on applications, eviction rate, late-payment / NSF rate, and stable-employment percentage? A property-management company in the area should have these aggregated.
- How much new for-sale + rental construction is in the pipeline within 1–3 miles? Heavy new supply typically softens prices + rents 12–24 months out; constrained supply supports both.
Investment metrics
- 1% rule
- 1.14% ✓
- Cap rate
- 8.70%
- Cash-on-cash
- 8.59%
- DSCR
- 1.38
- GRM
- 7.3
CMA / ARV
- ARV (median comp)
- $648,918
- List price
- $699,000
- Delta
- 7.86%
- Verdict
- FAIR
- Comps
- 20 within 1.0 mi
Show comp detail 7 sales within ~0.75 mi
| Address | Dist | Beds/Ba | Sqft | Sold | Price | $/sf | Match |
|---|---|---|---|---|---|---|---|
| 495 Mooney Hill Rd | 0.08mi | 3/2.5 | 1,742 (-8%) | 6mo | $548,500 | $315 | 76 |
| 395 Mooney Hill Rd | 0.35mi | 3/2.0 | 1,962 (+4%) | 2mo | $500,000 | $255 | 75 |
| 93 Cross Rd | 0.28mi | 2/2.0 (-1) | 1,920 (+2%) | 10mo | $550,000 | $286 | 71 |
| 294 Route 292 | 0.53mi | 3/2.0 | 1,912 (+1%) | 7mo | $490,000 | $256 | 67 |
| 144 Route 292 | 0.42mi | 3/2.0 | 1,725 (-9%) | 5mo | $900,000 | $522 | 62 |
| 46 Baldwin Rd | 0.22mi | 3/3.0 | 1,790 (-5%) | 20mo | $590,000 | $330 | 60 |
| 44 Meadowbrook Ct | 0.72mi | 3/2.5 | 1,906 (+1%) | 19mo | $525,000 | $275 | 47 |
Match score weights: distance 35% · size 25% · config 20% · recency 20%. Top-matched comps best support the ARV.
Projected returns pro-forma
-3.0% appreciation · 3.0% rent growth · sell at horizon
- IRR
- -3.2%
- Equity multiple
- 0.88×
- Total profit
- $-23,897
- Equity at exit
- $104,223
- IRR
- 6.5%
- Equity multiple
- 1.48×
- Total profit
- $94,756
- Equity at exit
- $60,437
Cash invested: $195,720 (down + closing). Projections, not guarantees.
Landlord ↔ Tenant lean methodology
- Overall (STATE)
- 15 Strongly Tenant-Friendly
- State New York
- 15 Strongly Tenant-Friendly · D+10
- County
- — inherits STATE
- City
- — inherits STATE
ZIP-level market 12563
- Home prices YoY
- -12.7%
- Active inventory
- 49
- Price-to-rent
- 7.3×
Monthly cashflow live
- Estimated rent
- $8,000 medium interval (Pro) →
- Mortgage (P&I)
- −$3,666
- Tax from tax record
- −$963 /mo · $11,552/yr
- Insurance
- −$291
- HOA
- −$0
- Vacancy / Maint / Mgmt
- −$1,680
- Net cashflow
- $1,400
Break-even live
UW: 25.0% down · 7.5% · 30yr · 1.5% tax · 5.0% vac · 8.0% maint · 8.0% mgmt
Financing live
Cash to close
- Down payment
- $174,750
- Closing costs
- $20,970
- Reserves months
- —
- Total cash needed
- —
Loan-product check · same deal, 3 products live
Conventional
25% down · 7.5% · 30yr
- Down + closing
- —
- Monthly P&I
- —
- Monthly cashflow
- —
- DSCR
- —
- Eligible?
- —
Personal DTI + credit; lowest rate.
DSCR
20% down · 8.5% · 30yr
- Down + closing
- —
- Monthly P&I
- —
- Monthly cashflow
- —
- DSCR
- —
- Eligible?
- —
No personal income docs; deal must DSCR.
Hard money
10% down · 12.0% · 12mo
- Down + closing
- —
- Monthly P&I
- —
- Monthly cashflow
- —
- DSCR
- —
- Eligible?
- —
Short-term bridge; refi at stabilization.
Rent comps 1 comps
| Address | Beds | Baths | Sqft | Rent | $/sqft | DOM | Units | Dist |
|---|---|---|---|---|---|---|---|---|
| 90 Cushman Rd Patterson, NY | 3.0 | 2.0 | 2286 | $8,000 | $3.50 | 11d | 1 | 1.17mi |
Listing history 17 events
-
2026-06-13days on market $699,000 Active 9 DOM
-
2026-06-10days on market $699,000 Active 7 DOM
-
2026-06-09days on market $699,000 Active 6 DOM
-
2026-06-08days on market $699,000 Active 5 DOM
-
2026-06-07days on market $699,000 Active 4 DOM
-
2026-06-05statusdays on market $699,000 Active 1 DOM
-
2026-06-03days on market $699,000 Coming Soon 3 DOM
-
2026-06-02days on market $699,000 Coming Soon 2 DOM
-
2026-06-01remarks 699-char remark
-
2026-06-01pricestatusdays on market $699,000 Coming Soon 1 DOM
-
2026-04-24$699,900 Active 1956-char remark
-
2026-04-20historical $699,900 1956-char remark
-
2026-03-25historical
-
2025-11-06price $785,000
-
2025-11-05price $749,000
-
2025-09-24$825,000 Active
-
1979-06-21soldstatus $70,000
ⓘ Source: listings_history table (triggers on properties + properties_extension) + one-shot
backfill from property_details.listing_events for pre-trigger history.
Tax reassessment forecast NY · Partial reset (capped growth)
- Current annual tax
- $11,552 · $963/mo
- Projected year-2 tax
- $11,683 · $974/mo
- Expected delta
- +$131/yr (+$11/mo · 1.1%)
ⓘ Screening estimate from a state-policy table — verify with the county assessor before closing.
Climate risk First Street
- Flood 1/10 Low FEMA zone X (unshaded) · 0% chance over 30 yrs
- Wildfire 5/10 Major
- Heat 4/10 Moderate 7 d/yr ≥97°F today · 15 d/yr by 30 yrs out
- Wind 4/10 Moderate 17% chance of damaging wind over 30 yrs
- Air quality 3/10 Moderate 2 unhealthy d/yr today · 3 by 30 yrs out
Nearby sold comps map
Loading sold comps map…
Walkable amenities ~0.75 mi
Loading nearby amenities…
Taxation est. · year 1
- Rental income
- $96,000
- − Mortgage interest
- −$39,155
- − Property taxes
- −$11,552
- − Insurance
- −$3,495
- − Repairs & maintenance
- −$7,680
- − Management
- −$7,680
- − Depreciation
- −$20,335
- Taxable income
- $6,104
- Est. tax owed @ 24.0%
- −$1,465
- After-tax cash flow
- $15,341/yr
For passive investors: Depreciation is non-cash, so a rental often shows a tax loss while cash-flowing — sheltering income. Rental losses are passive: they offset passive income freely, and up to $25,000/yr can offset ordinary (W-2) income if you actively participate and your MAGI is under $100k (phasing out to $0 by $150k); unused losses carry forward. On sale, claimed depreciation is recaptured at up to 25%, and gains may owe capital-gains tax (a 1031 exchange can defer both). Figures are a year-1 estimate at your 24.0% rate — not tax advice; consult a CPA.
Schools (NCES district)
- District
- Carmel Central School District
- NCES district ID
- 3606570
- Math proficiency
- 46% ▼ -15.00%
- Reading proficiency
- 63% ▲ 11.00%
- Median HH income
- $87,665
- Composite
- 50.05/100
- National rank
- #1914
- State rank
- #258 of 590 in NY
Livability — Lake Carmel
- Score
- 66/100
- State rank
- #650
- US rank
- #12139
Category grades
Schools grade is shown separately in the Schools card above.
Census & demographics
- Population (ZIP)
- 7,456
Population outlook (Putnam County) Hauer SSP2
- Today (2025)
- 99,705 people
- By 2030
- 99,650 · -0.1%
- By 2040
- 98,641 · -1.1%
- By 2050
- 96,348 · -3.4%
- By 2075
- 94,412 · -5.3%
- By 2100
- 88,728 · -11.0%
Race, ethnicity, and origin ACS 2023
- Neighborhood character
- Predominantly White (69%)
- Race & ethnicity
- White 69% Hispanic / Latino 17% Black 9% Two or more races 6% Asian 2%
- Hispanic origin (detail)
- Mexican 4% Puerto Rican 3% Cuban 1% Dominican 3%
- Common ancestry
- Romanian 5% Portuguese 2% Slovak 1%
- Foreign-born
- 14% · Canada, South Korea, Dominican Republic
- Languages at home
- 79% English-only · Spanish 12% Other Indo-European 3% Russian/Polish/Slavic 2%
Political lean MEDSL · Putnam
- 2024 margin
- R (+13.7) · D 43.2% · R 56.8%
- 2008→2024 swing
- -6.2pp toward R · 2008: -7.5pp · 2024: -13.7pp
- All cycles
- 2024: R+13.7 2020: R+7.9 2016: R+17.8 2012: R+11.2 2008: R+7.5
Not yet ingested
- Civics
- —
Market trends
- HPI YoY
- ▼ -36.07%
- Current HPI
- 247.1582
- Rent YoY
- —
- Metro
- —
- State GDP YoY
- ▲ 2.60%
- F500 in state
- 92
Industry mix (Fortune 500 HQ in NY)
| Industry | F500 HQs | Revenue |
|---|---|---|
| Financial Services | 10 | $950B |
|
||
| Consumer Goods | 9 | $162B |
|
||
| Insurance | 4 | $225B |
|
||
| Telecommunications | 2 | $144B |
|
||
| Pharmaceuticals | 2 | $112B |
|
||
| Media / Entertainment | 2 | $69B |
|
||
Price history
+898.6% since first listed10 events — show timeline
- 2026-06-04 Listed $699,000 OneKey® MLS as Distributed by MLS Grid
- 2026-06-01 Coming Soon — OneKey® MLS as Distributed by MLS Grid
- 2026-05-27 Listing Removed — OneKey® MLS as Distributed by MLS Grid
- 2026-04-24 Listed $699,900 OneKey® MLS as Distributed by MLS Grid
- 2026-04-20 Coming Soon — OneKey® MLS as Distributed by MLS Grid
- 2026-03-25 Listing Removed — OneKey® MLS as Distributed by MLS Grid
- 2025-11-06 Price Changed $785,000 OneKey® MLS as Distributed by MLS Grid
- 2025-11-05 Price Changed $749,000 OneKey® MLS as Distributed by MLS Grid
- 2025-09-24 Listed $825,000 OneKey® MLS as Distributed by MLS Grid
- 1979-06-21 Sold (Public Records) $70,000 Public Records
Property tax history
+9.6%/yrLatest (2025): $11,552 · -0.5% YoY. Source: county tax records.
Cash-flow waterfall
monthlySold comps — $/sqft
last 12 mo · ≤1 miLoading sold comps…