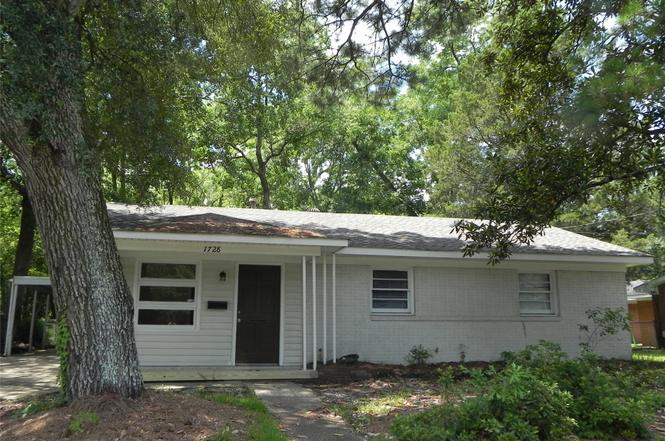
1728 Robison Hill Rd · Montgomery, AL
Flood risk 1/10 · Minimal
- FEMA flood zone
- X (unshaded)
- Chance of flooding over 30 yrs
- 0.0%
- Est. flood insurance / yr
- $507 – $1,088
Fire risk 1/10 · Minimal
- Est. fire insurance / yr
- $916 – $1,700
Heat risk 7/10 · Major
- Hot days now (above 107°F)
- 7 days/yr
- Hot days in 30 yrs
- 19 days/yr
Wind risk 8/10 · Major
- Chance of severe wind over 30 yrs
- 80.0%
Air-quality risk 3/10 · Minor
- Unhealthy air days now
- 4 days/yr
- Unhealthy air days in 30 yrs
- 4 days/yr
Risk factors via First Street. Map © Google.
Why this score? — see what drove the C grade
The composite is a weighted blend of 9 inputs, each scored 0–100. Each bar is that input's sub-score; the figure is the points it added to the 100-point composite (weight × sub-score).
- Cash flow +24.2/30.0
- ARV discount +7.9/15.0
- DSCR +7.8/10.0
- 1% rule +4.9/10.0
- Rent growth +3.8/5.0
- Livability +3.2/5.0
- Condition / age +2.5/5.0
- Schools +1.7/10.0
- Appreciation +0.0/10.0
$138,950
🖨 Deal sheet 📄 Offer letter ✓ Due diligence
Listing remarks MLS
This cute home has 3 bedrooms, 2 bathrooms, 2 separate spacious living areas, a nice size kitchen that is open to the eat-in area, and a separate laundry room. Covered patio huge fenced backyard, you can sit under the covered patio while enjoying the large back yard. Also has a detached storage building. Carport will keep you out of the rain. This home has it all!
Key facts
- Covered porch
- Large backyard
- Granite countertops
Tags
Property features AI
Finance
- Other: City lot with mature trees; Lot dimensions approximately 50 x 174
Exterior
- Parking: Attached carport; Driveway; One carport space
- Utilities: Public water; Public sewer; Electricity available; Natural gas available; Cable available; High-speed internet available
- Home design: Single-story home; Brick construction; Slab foundation
- Construction: Brick exterior; Built (year per public records)
- Exterior features: Fully fenced yard; Covered porch; Porch; Outdoor storage
Interior
- Kitchen: Eat-in kitchen; Dishwasher; Electric range
- Bedrooms: Two first-floor bedrooms
- Flooring: Carpet; Tile; Vinyl
- Bathrooms: Two full bathrooms, both on the first floor
- Heating & cooling: Central heating (gas); Central electric air conditioning
- Interior features: Carpet, tile and vinyl flooring; Family room; Living room; Eat-in kitchen; Covered porch; Storage
- Laundry & utility: First-floor laundry; Gas water heater
Neighborhood map
What this means for you Summary
Snapshot
- This is a 3-bed/2.0-bath single-family listed at $139k.
Deal economics
- At list price, monthly cash flow is $276 ($3k/yr) — positive.
- The deal already cash-flows at list — no discount required.
- To meet the 1% rule (rent ≥ 1% of price), the offer needs to be $138k (0.6% below list).
- Recommended offer: $138k (0.6% below list) — sets the bar for 1% rule.
- Cap rate 8.7% vs local median 6.0% in Montgomery — top-decile yield for the area; either an underpriced asset or a hidden risk that comps aren't pricing in. Stress-test before assuming the spread holds.
Location & tenants
- Location reads 65/100 on livability (#138 in AL) — a middle-class / working-renter tenant base. Strengths: cost of living A+, housing A+; Watch: schools C-, employment D, crime F.
- Montgomery County (urban): math 9% / reading 31% proficiency, ranked #106 of 129 in AL (top 82%) — low school quality limits family demand, transient renter base, plan for 1-2y turnover; 70% free/reduced lunch — lower-income household profile, screen leases tightly.
- Market conditions: Rents rising fast (+5.0%/yr); 67 active listings in the ZIP; 40 comparable units currently listed for rent nearby; rentals at typical pace (median 21d on market — plan ~3-4 weeks tenant-placement turnaround); 45% of comp listings sitting > 30 days — soft ceiling on asking rent; lower-income renter base — watch delinquency; 460 units permitted in Montgomery County in 2024 (37 in 5+ unit buildings).
- At $1,381/mo this rent would consume 51% of the median local household income ($32k/yr) (locally 642% of renters already pay >50% of income on rent) — very limited rent-growth headroom before tenants either downsize or default.
Forward outlook
- Local home prices are declining (-3.0%/yr); year-one equity from $960 of loan paydown is wiped out by about $4k of value loss. Plan a longer hold.
- Montgomery County population projected to shrink 8% by 2050 — rents likely to lag national; underwrite the cash flow, not the appreciation.
- At projected returns (-3.0% appreciation + 5.0% rent growth), your $39k cash investment doubles in ~10 years — after that, you're playing with house money.
Negotiation context
- Only 4 days on market — expect competitive offers; lowballing is unlikely to land.
- 10 sale attempts since 16y ago with the ask held roughly flat each time — persistent listings suggest the price (not the market) is what's stuck; bring a comps-based counter.
- Current owner paid $66k; list at $139k implies a 112% gain — meaningful room to come down on a strong offer.
Risks & watch-outs
- Climate carrying-cost: severe wind risk, 80% chance of damaging wind over 30y; extreme-heat days projected 7→19/yr by 2055 (HVAC capex compounding) — expect insurance premiums to compound above CPI over the hold.
Questions for the listing agent
- Built in 1960 — when were the roof, HVAC, electrical panel, plumbing, and water heater last replaced?
- Is there a deadline driving the sale (1031 exchange, divorce, estate, relocation)? That informs how much negotiation room exists.
- Crime grade is F in this area — have there been break-ins, vandalism, or insurance claims at this property in the last 3 years? What carrier currently insures it and at what premium?
- What's the average days-on-market for RENTAL listings here right now (not sales)? A rising rental-DOM trend means longer vacancies and softer asking-rent achievability than the comps imply.
- What's the recent tenant-quality profile in this submarket — average credit score on applications, eviction rate, late-payment / NSF rate, and stable-employment percentage? A property-management company in the area should have these aggregated.
- How much new for-sale + rental construction is in the pipeline within 1–3 miles? Heavy new supply typically softens prices + rents 12–24 months out; constrained supply supports both.
Investment metrics
- 1% rule
- 0.99% ✗
- Cap rate
- 8.68%
- Cash-on-cash
- 8.52%
- DSCR
- 1.38
- GRM
- 8.4
CMA / ARV
- ARV (on-the-fly)
- $140,049
- Comps found
- 12
Show comp detail 12 sales within ~0.75 mi
| Address | Dist | Beds/Ba | Sqft | Sold | Price | $/sf | Match |
|---|---|---|---|---|---|---|---|
| 1728 Robison Hill Rd | 0.00mi | 3/2.0 | 1,574 (+2%) | 1mo | $65,500 | $42 | 95 |
| 1955 Gorgas St | 0.36mi | 2/2.0 (-1) | 1,536 (-0%) | 2mo | $150,000 | $98 | 77 |
| 3221 Gatsby Ln | 0.50mi | 3/2.0 | 1,491 (-3%) | 0mo | $150,000 | $101 | 71 |
| 2009 Commodore St | 0.29mi | 3/2.0 | 1,661 (+8%) | 4mo | $65,000 | $39 | 70 |
| 1232 Zephyr Hills Dr | 0.59mi | 4/2.0 (+1) | 1,497 (-3%) | 1mo | $128,675 | $86 | 62 |
| 2045 Gorgas St | 0.38mi | 3/1.0 | 1,337 (-13%) | 0mo | $120,000 | $90 | 56 |
| 1934 Gorgas St | 0.40mi | 2/2.0 (-1) | 1,347 (-12%) | 2mo | $139,504 | $104 | 54 |
| 2121 E 3rd St | 0.73mi | 3/1.0 | 1,600 (+4%) | 4mo | $15,000 | $9 | 52 |
| 1300 Zephyr Hills Dr | 0.63mi | 3/2.0 | 1,389 (-10%) | 6mo | $91,500 | $66 | 50 |
| 2948 Canterbury Dr | 0.70mi | 3/2.0 | 1,702 (+11%) | 4mo | $155,000 | $91 | 47 |
| 2958 Old Farm Rd | 0.55mi | 2/2.0 (-1) | 1,712 (+11%) | 6mo | $159,000 | $93 | 45 |
| 3243 Durham Dr | 0.68mi | 4/2.0 (+1) | 1,363 (-11%) | 1mo | $150,000 | $110 | 43 |
Match score weights: distance 35% · size 25% · config 20% · recency 20%. Top-matched comps best support the ARV.
Projected returns pro-forma
-3.0% appreciation · 5.05% rent growth · sell at horizon
- IRR
- -1.4%
- Equity multiple
- 0.95×
- Total profit
- $-2,079
- Equity at exit
- $20,718
- IRR
- 10.1%
- Equity multiple
- 1.85×
- Total profit
- $33,011
- Equity at exit
- $12,014
Cash invested: $38,906 (down + closing). Projections, not guarantees.
Landlord ↔ Tenant lean methodology
- Overall (STATE)
- 90 Strongly Landlord-Friendly
- State Alabama
- 90 Strongly Landlord-Friendly · R+15
- County
- — inherits STATE
- City
- — inherits STATE
ZIP-level market 36107
- Home prices YoY
- -10.9%
- Rents YoY
- 5.0%
- Active inventory
- 67
- Price-to-rent
- 8.4×
Monthly cashflow live
- Estimated rent
- $1,381 high interval (Pro) →
- Mortgage (P&I)
- −$729
- Tax from tax record
- −$28 /mo · $337/yr
- Insurance
- −$58
- HOA
- −$0
- Vacancy / Maint / Mgmt
- −$290
- Net cashflow
- $276
Break-even live
UW: 25.0% down · 7.5% · 30yr · 1.5% tax · 5.0% vac · 8.0% maint · 8.0% mgmt
Financing live
Cash to close
- Down payment
- $34,738
- Closing costs
- $4,168
- Reserves months
- —
- Total cash needed
- —
Loan-product check · same deal, 3 products live
Conventional
25% down · 7.5% · 30yr
- Down + closing
- —
- Monthly P&I
- —
- Monthly cashflow
- —
- DSCR
- —
- Eligible?
- —
Personal DTI + credit; lowest rate.
DSCR
20% down · 8.5% · 30yr
- Down + closing
- —
- Monthly P&I
- —
- Monthly cashflow
- —
- DSCR
- —
- Eligible?
- —
No personal income docs; deal must DSCR.
Hard money
10% down · 12.0% · 12mo
- Down + closing
- —
- Monthly P&I
- —
- Monthly cashflow
- —
- DSCR
- —
- Eligible?
- —
Short-term bridge; refi at stabilization.
Rent comps 40 comps
| Address | Beds | Baths | Sqft | Rent | $/sqft | DOM | Units | Dist |
|---|---|---|---|---|---|---|---|---|
| 1814 Pinecrest Dr Montgomery, AL | 3.0 | 1.0 | 1053 | $990 | $0.94 | 44d | 1 | 0.12mi |
| 1827 Pinecrest Dr Montgomery, AL | 4.0 | 3.0 | 1893 | $1,550 | $0.82 | 13d | 1 | 0.15mi |
| 2736 Chevy Chase Dr Montgomery, AL | 3.0 | 1.0 | 1100 | $1,300 | $1.18 | 44d | 1 | 0.19mi |
| 1839 Robison Hill Rd Montgomery, AL | 4.0 | 2.0 | 1370 | $1,550 | $1.13 | 21d | 1 | 0.26mi |
| 1842 Gillespie Dr Montgomery, AL | 4.0 | 2.0 | 1620 | $1,650 | $1.02 | 44d | 1 | 0.30mi |
| 2014 Commodore St Montgomery, AL | 3.0 | 2.0 | 1613 | $1,450 | $0.90 | 13d | 1 | 0.32mi |
| 2053 Gorgas St Montgomery, AL | 3.0 | 1.0 | 1955 | $1,200 | $0.61 | 21d | 1 | 0.38mi |
| 1814 Sylvan Dr Montgomery, AL | 3.0 | 2.0 | 1785 | $1,400 | $0.78 | 21d | 1 | 0.42mi |
| 2045 Bullard St Unit 1043526P Montgomery, AL | 3.0 | 2.0 | 1797 | $2,198 | $1.22 | 44d | 1 | 0.44mi |
| 2226 Carter Hill Rd Montgomery, AL | 2.0 | 1.0 | 1506 | $905 | $0.60 | 44d | 1 | 0.58mi |
| 3136 Harrison Rd Montgomery, AL | 3.0 | 1.5 | 1355 | $1,025 | $0.76 | 44d | 1 | 0.61mi |
| 2983 Old Farm Rd Montgomery, AL | 3.0 | 2.0 | 2000 | $1,725 | $0.86 | 21d | 1 | 0.63mi |
| 3318 Habersham Rd Montgomery, AL | 3.0 | 2.0 | 1134 | $1,250 | $1.10 | 13d | 1 | 0.67mi |
| 2020 E 3rd St Montgomery, AL | 2.0 | 1.0 | 1186 | $750 | $0.63 | 21d | 1 | 0.76mi |
| 3323 Bedford Ln Montgomery, AL | 3.0 | 2.0 | 1134 | $1,200 | $1.06 | 21d | 1 | 0.81mi |
| 3346 Bedford Ln Montgomery, AL | 3.0 | 1.0 | 1134 | $1,295 | $1.14 | 13d | 1 | 0.84mi |
| 1425 Blairwood Montgomery, AL | 3.0 | 2.0 | 1700 | $1,850 | $1.09 | 13d | 1 | 0.84mi |
| 1450 Crenshaw Pl S Montgomery, AL | 3.0 | 2.0 | 1641 | $1,775 | $1.08 | 44d | 1 | 0.86mi |
| 3359 Bedford Ln Montgomery, AL | 4.0 | 2.0 | 1786 | $1,600 | $0.90 | 13d | 1 | 0.87mi |
| 1216 Karen Rd Montgomery, AL | 3.0 | 2.0 | 1620 | $1,350 | $0.83 | 13d | 1 | 0.91mi |
| 2043 Hazel Hedge Ln Montgomery, AL | 4.0 | 3.0 | 2001 | $1,650 | $0.82 | 13d | 1 | 0.91mi |
| 1229 Karen Rd Montgomery, AL | 4.0 | 2.0 | 1344 | $1,590 | $1.18 | 44d | 1 | 0.94mi |
| 2000 Cherry St Montgomery, AL | 2.0 | 1.0 | 1106 | $950 | $0.86 | 44d | 1 | 1.01mi |
| 1117 Karen Rd Montgomery, AL | 3.0 | 1.0 | 1308 | $1,195 | $0.91 | 44d | 1 | 1.02mi |
| 1154 Lakewood Dr Montgomery, AL | 3.0 | 2.0 | 1066 | $1,350 | $1.27 | 44d | 1 | 1.02mi |
| 3352 Ridgefield Dr Montgomery, AL | 3.0 | 2.0 | 1932 | $1,761 | $0.91 | 21d | 1 | 1.05mi |
| 926 Green Ridge Ct Montgomery, AL | 3.0 | 2.0 | 1665 | $1,381 | $0.83 | 13d | 1 | 1.08mi |
| 311 Bradley Dr Montgomery, AL | 3.0 | 1.0 | 1104 | $825 | $0.75 | 44d | 1 | 1.14mi |
| 1738 Fairforest Dr Montgomery, AL | 3.0 | 2.0 | 2166 | $1,895 | $0.87 | 44d | 1 | 1.15mi |
| 2009 Palmetto St Montgomery, AL | 3.0 | 1.0 | 1487 | $1,050 | $0.71 | 44d | 1 | 1.21mi |
| 2727 Boultier St Montgomery, AL | 1.0–3.0 | 1.0–2.0 | 1070 | $1,582 | $1.48 | 13d | 3 | 1.24mi |
| 1216 Beechdale Rd Montgomery, AL | 4.0 | 2.0 | 1495 | $1,325 | $0.89 | 44d | 1 | 1.28mi |
| 844 Sir Michael Dr Montgomery, AL | 4.0 | 2.0 | 1502 | $1,650 | $1.10 | 44d | 1 | 1.30mi |
| 817 Dumont Dr Montgomery, AL | 3.0 | 2.0 | 1635 | $1,800 | $1.10 | 13d | 1 | 1.31mi |
| 3309 Hillcrest Ln Unit 1043908P Montgomery, AL | 4.0 | 2.0 | 1625 | $2,885 | $1.78 | 21d | 1 | 1.34mi |
| 122 Oak Forest Dr Montgomery, AL | 3.0 | 1.0 | 1092 | $975 | $0.89 | 21d | 1 | 1.34mi |
| 2113 Brewton St Montgomery, AL | 3.0 | 1.0 | 1363 | $1,150 | $0.84 | 44d | 1 | 1.37mi |
| 2430 Price St Montgomery, AL | 2.0 | 1.5 | 1275 | $1,175 | $0.92 | 13d | 1 | 1.38mi |
| 3233 Hillcrest Ln Montgomery, AL | 3.0 | 2.0 | 1278 | $1,395 | $1.09 | 21d | 1 | 1.40mi |
| 2440 Price St Unit C Montgomery, AL | 3.0 | 2.0 | 1800 | $1,050 | $0.58 | 44d | 1 | 1.40mi |
Listing history 5 events
-
2026-06-18days on market $138,950 Active 4 DOM
-
2026-06-17days on market $138,950 Active 3 DOM
-
2026-06-16days on market $138,950 Active 2 DOM
-
2026-06-15remarks 397-char remark
-
2026-06-15$138,950 Active 1 DOM
ⓘ Source: listings_history table (triggers on properties + properties_extension) + one-shot
backfill from property_details.listing_events for pre-trigger history.
Tax reassessment forecast AL · Resets to sale price
- Current annual tax
- $337 · $28/mo
- Projected year-2 tax
- $570 · $47/mo
- Expected delta
- +$233/yr (+$19/mo · 69.1%)
ⓘ Screening estimate from a state-policy table — verify with the county assessor before closing.
Climate risk First Street
- Flood 1/10 Low FEMA zone X (unshaded) · 0% chance over 30 yrs
- Wildfire 1/10 Low
- Heat 7/10 Severe 7 d/yr ≥107°F today · 19 d/yr by 30 yrs out
- Wind 8/10 Severe 80% chance of damaging wind over 30 yrs
- Air quality 3/10 Moderate 4 unhealthy d/yr today · 4 by 30 yrs out
Nearby sold comps map
Loading sold comps map…
Walkable amenities ~0.75 mi
Loading nearby amenities…
Taxation est. · year 1
- Rental income
- $16,572
- − Mortgage interest
- −$7,783
- − Property taxes
- −$337
- − Insurance
- −$695
- − Repairs & maintenance
- −$1,326
- − Management
- −$1,326
- − Depreciation
- −$4,042
- Taxable income
- $1,063
- Est. tax owed @ 24.0%
- −$255
- After-tax cash flow
- $3,061/yr
For passive investors: Depreciation is non-cash, so a rental often shows a tax loss while cash-flowing — sheltering income. Rental losses are passive: they offset passive income freely, and up to $25,000/yr can offset ordinary (W-2) income if you actively participate and your MAGI is under $100k (phasing out to $0 by $150k); unused losses carry forward. On sale, claimed depreciation is recaptured at up to 25%, and gains may owe capital-gains tax (a 1031 exchange can defer both). Figures are a year-1 estimate at your 24.0% rate — not tax advice; consult a CPA.
Schools (NCES district)
- District
- Montgomery County
- NCES district ID
- 0102430
- Math proficiency
- 9% ▼ -21.00%
- Reading proficiency
- 31% ▼ -1.00%
- Median HH income
- $43,902
- Composite
- 17.24/100
- National rank
- #9093
- State rank
- #106 of 129 in AL
Livability — Montgomery
- Score
- 65/100
- State rank
- #138
- US rank
- #13416
Category grades
Schools grade is shown separately in the Schools card above.
Census & demographics
- Census place
- Montgomery, AL
- County
- Montgomery County · 190,016 people
- City population
- 175,913
- Metro
- Montgomery, AL
- Population (ZIP)
- 8,001
- Household income
- $32,492
- Rent vs Own
- Severe rent burden
- 642.0
Population outlook (Montgomery County) Hauer SSP2
- Today (2025)
- 224,008 people
- By 2030
- 221,460 · -1.1%
- By 2040
- 214,179 · -4.4%
- By 2050
- 204,912 · -8.5%
- By 2075
- 177,821 · -20.6%
- By 2100
- 145,134 · -35.2%
Race, ethnicity, and origin ACS 2023
- Neighborhood character
- Diverse neighborhood (Simpson 0.69)
- Race & ethnicity
- Black 43% White 27% Hispanic / Latino 23% Two or more races 20%
- Hispanic origin (detail)
- Mexican 8% Cuban 3%
- Common ancestry
- Slovak 1% Iranian 1% Serbian 1%
- Foreign-born
- 11% · Canada
- Languages at home
- 83% English-only · Spanish 13%
Political lean MEDSL · Montgomery
- 2024 margin
- Solid D (+30.7) · D 64.8% · R 34.1% · Other 1.1%
- 2008→2024 swing
- +11.5pp toward D · 2008: 19.2pp · 2024: 30.7pp
- All cycles
- 2024: D+30.7 2020: D+31.5 2016: D+26.2 2012: D+24.3 2008: D+19.2
Not yet ingested
- Civics
- —
Market trends
- HPI YoY
- ▼ -18.16%
- Current HPI
- 147.8065
- Rent YoY
- ▲ 5.05%
- Metro
- Montgomery, AL
- State GDP YoY
- ▲ 2.94%
- F500 in state
- 4
Industry mix (Fortune 500 HQ in AL)
| Industry | F500 HQs | Revenue |
|---|---|---|
| Financial Services | 1 | $8B |
|
||
| Healthcare | 1 | $5B |
|
||
Price history
+63.7% since first listed18 events — show timeline
- 2026-06-14 Listed $138,950 MAAR
- 2026-05-11 Sold (MLS) $65,500 MAAR
- 2026-04-27 Pending — MAAR
- 2026-04-14 Listed $55,000 MAAR
- 2024-11-13 Rental Removed $1,350 MAAR
- 2024-09-19 Listed for Rent $1,350 MAAR
- 2023-04-04 Pending — MAAR
- 2023-03-31 Sold (MLS) $65,000 MAAR
- 2023-03-05 Contingent — MAAR
- 2023-03-02 Listed $70,000 MAAR
- 2018-06-13 Sold (Public Records) $60,000 Public Records
- 2018-06-12 Sold (MLS) $60,000 MAAR
- 2017-09-27 Listed $67,900 MAAR
- 2016-05-18 Listed $61,500 MAAR
- 2015-05-28 Listed $71,500 MAAR
- 2014-01-27 Listed $72,000 MAAR
- 2011-08-15 Listed $84,900 MAAR
- 2010-08-26 Listed $84,900 MAAR
Property tax history
-3.8%/yrLatest (2023): $337 · +55.6% YoY. Source: county tax records.
Cash-flow waterfall
monthlySold comps — $/sqft
last 12 mo · ≤1 miLoading sold comps…