209 W Miracle Strip Pkwy Unit E203 · Mary Esther, FL
Flood risk No data
- FEMA flood zone
- —
- Chance of flooding over 30 yrs
- —
- Est. flood insurance / yr
- —
Fire risk No data
- Est. fire insurance / yr
- —
Heat risk No data
- Hot days now (above threshold)
- —
- Hot days in 30 yrs
- —
Wind risk No data
- Chance of severe wind over 30 yrs
- —
Air-quality risk No data
- Unhealthy air days now
- —
- Unhealthy air days in 30 yrs
- —
Risk factors via First Street. Map © Google.
Why this score? — see what drove the D- grade
The composite is a weighted blend of 9 inputs, each scored 0–100. Each bar is that input's sub-score; the figure is the points it added to the 100-point composite (weight × sub-score).
- ARV discount +12.6/15.0
- 1% rule +6.2/10.0
- Schools +5.2/10.0
- Livability +4.5/5.0
- Condition / age +3.8/5.0
- Rent growth +2.4/5.0
- Cash flow +1.9/30.0
- DSCR +0.0/10.0
- Appreciation +0.0/10.0
$151,500
🖨 Deal sheet 📄 Offer letter ✓ Due diligence
Listing remarks MLS
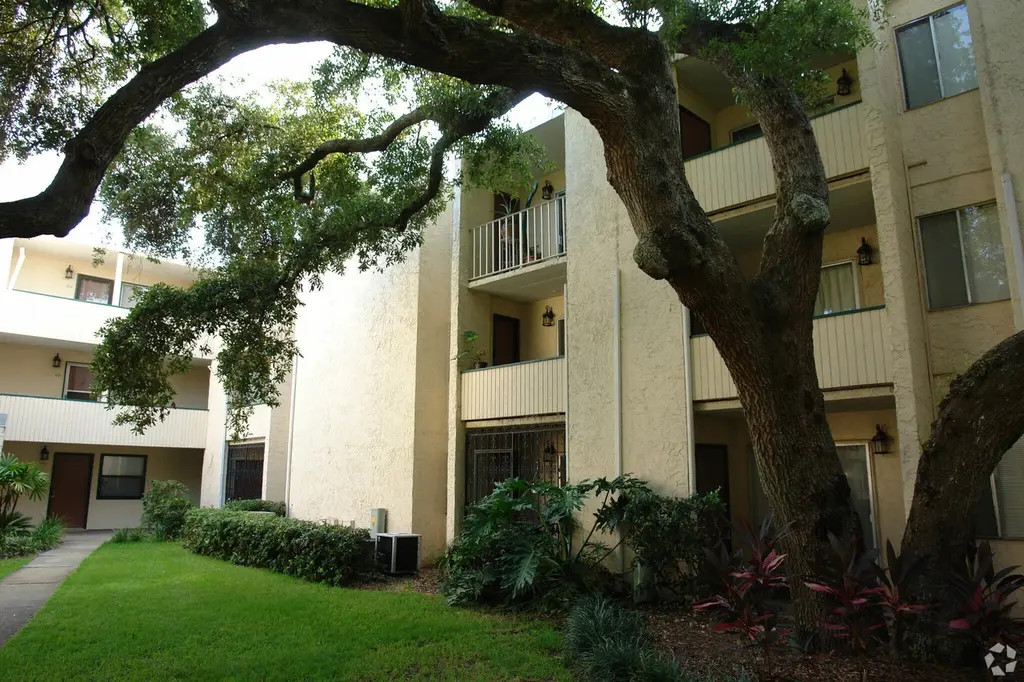
Welcome to easy coastal living at The Cedars in Mary Esther! This beautifully maintained 2-bedroom, fully furnished condo offers a true turnkey opportunity ideal for a primary residence, second home, or investment property near Hurlburt Field, area beaches, shopping, and dining. Fully furnished and truly turnkey — move in, rent, or enjoy immediately from day one. Step inside to a bright and inviting layout featuring comfortable living spaces and thoughtfully furnished interiors designed for immediate move-in convenience... Property is currently operating as a short-term rental and is being sold fully furnished, offering a turnkey opportunity for buyers seeking personal use or investment potential. Buyers should verify rental guidelines and HOA requirements.
Key facts
- Short-term rental
- Fully furnished
- Turnkey opportunity
Tags
Neighborhood map
What this means for you Summary
Snapshot
- This is a 2-bed/1.0-bath condo listed at $152k. Condition is rated good.
Deal economics
- At list price, monthly cash flow is $-567 ($-7k/yr) — negative.
- The deal already cash-flows at list — no discount required.
- Meets the 1% rule at list price ($2k rent vs $152k).
- Recommended offer: $138k (9.0% below list) — sets the bar for market timing.
- Cap rate 1.8% vs local median 4.8% in Mary Esther — below-typical yield; the buyer is paying a premium for something (appreciation thesis, condition, location) that the cap rate doesn't capture.
Location & tenants
- Location reads 89/100 on livability (#2 in FL, #137 nationally) — a professional / high-income tenant draw. Strengths: crime A+, commute A+, cost of living A+.
- Okaloosa (other): math 60% / reading 60% proficiency, ranked #12 of 73 in FL (top 16%) — acceptable for families but not a draw, mixed tenant base, ~2y average lease.
- Market conditions: Rents soft (-0.5%/yr); 175 active listings in the ZIP; 5 comparable units currently listed for rent nearby; rentals at typical pace (median 21d on market — plan ~3-4 weeks tenant-placement turnaround); solid renter incomes; 1,268 units permitted in Okaloosa County in 2024 (175 in 5+ unit buildings).
Forward outlook
- Local home prices are declining (-3.0%/yr); year-one equity from $1k of loan paydown is wiped out by about $5k of value loss. Plan a longer hold.
- Okaloosa County population projected at +37% by 2050 — long-run rental-demand tailwind backs the buy-and-hold thesis.
Negotiation context
- It's been on market 101 days — a 9% lower offer ($138k) is reasonable based on typical stale-listing flexibility.
- 7 sale attempts since 25y ago with the ask held roughly flat each time — persistent listings suggest the price (not the market) is what's stuck; bring a comps-based counter.
Risks & watch-outs
- Watch-outs: HOA is 51% of rent.
Questions for the listing agent
- What do current leases actually rent for vs. the listed asking? Can we see a recent rent roll and the last 12 months of T-12 income?
- It's been on market 101 days. Have you received any prior offers? Is the seller open to a 9% concession, seller financing, or rate buy-down credit?
- Built in 1974 — when were the roof, HVAC, electrical panel, plumbing, and water heater last replaced?
- What does the HOA fee cover, when was the last increase, and are there any pending special assessments or reserve-fund shortfalls?
- Any open or pending special assessments — roof, HVAC, plumbing, elevator, façade? What's the per-unit balance and payoff schedule, and is the seller paying it off at close or rolling it to the buyer?
- Why hasn't it sold? Are there any deal-killer items the seller is aware of (foundation, flood, title, zoning, code violations)?
- Is there a deadline driving the sale (1031 exchange, divorce, estate, relocation)? That informs how much negotiation room exists.
- Schools are B-rated — typically a magnet for longer-tenancy family renters. What's the average tenant stay here, and is there a school-zone premium baked into asking?
- The area grade is low — what's the realistic commute time and amenity access for the typical tenant pool here? Any planned neighborhood developments (good or bad) we should know about?
- What's the average days-on-market for RENTAL listings here right now (not sales)? A rising rental-DOM trend means longer vacancies and softer asking-rent achievability than the comps imply.
- What's the recent tenant-quality profile in this submarket — average credit score on applications, eviction rate, late-payment / NSF rate, and stable-employment percentage? A property-management company in the area should have these aggregated.
- How much new apartment / multifamily construction is in the pipeline within 1–3 miles? Heavy new supply (>2% of stock underway) typically softens rents 12–24 months out; light construction supports rent growth.
Investment metrics
- 1% rule
- 1.12% ✓
- Cap rate
- 1.80%
- Cash-on-cash
- -16.03%
- DSCR
- 0.29
- GRM
- 7.4
CMA / ARV
- ARV (median comp)
- $170,737
- List price
- $151,500
- Delta
- -11.27%
- Verdict
- UNDERPRICED
- Comps
- 20 within 1.0 mi
Projected returns pro-forma
-3.0% appreciation · 0.0% rent growth · sell at horizon
- IRR
- -55.5%
- Equity multiple
- -0.53×
- Total profit
- $-65,063
- Equity at exit
- $22,589
- IRR
- —
- Equity multiple
- -1.83×
- Total profit
- $-120,097
- Equity at exit
- $13,099
Cash invested: $42,420 (down + closing). Projections, not guarantees.
Landlord ↔ Tenant lean methodology
- Overall (STATE)
- 87 Strongly Landlord-Friendly
- State Florida
- 87 Strongly Landlord-Friendly · R+3
- County
- — inherits STATE
- City
- — inherits STATE
ZIP-level market 32569
- Home prices YoY
- -26.5%
- Rents YoY
- -0.5%
- Active inventory
- 175
- Price-to-rent
- 7.4×
Monthly cashflow live
- Estimated rent
- $1,697 high interval (Pro) →
- Mortgage (P&I)
- −$794
- Tax est. 1.5%
- −$189 /mo · $2,272/yr
- Insurance
- −$63
- HOA est. from 18 same-building comps
- −$860
- Vacancy / Maint / Mgmt
- −$356
- Net cashflow
- $-567
Break-even live
UW: 25.0% down · 7.5% · 30yr · 1.5% tax · 5.0% vac · 8.0% maint · 8.0% mgmt
Financing live
Cash to close
- Down payment
- $37,875
- Closing costs
- $4,545
- Reserves months
- —
- Total cash needed
- —
Loan-product check · same deal, 3 products live
Conventional
25% down · 7.5% · 30yr
- Down + closing
- —
- Monthly P&I
- —
- Monthly cashflow
- —
- DSCR
- —
- Eligible?
- —
Personal DTI + credit; lowest rate.
DSCR
20% down · 8.5% · 30yr
- Down + closing
- —
- Monthly P&I
- —
- Monthly cashflow
- —
- DSCR
- —
- Eligible?
- —
No personal income docs; deal must DSCR.
Hard money
10% down · 12.0% · 12mo
- Down + closing
- —
- Monthly P&I
- —
- Monthly cashflow
- —
- DSCR
- —
- Eligible?
- —
Short-term bridge; refi at stabilization.
Rent comps 5 comps
| Address | Beds | Baths | Sqft | Rent | $/sqft | DOM | Units | Dist |
|---|---|---|---|---|---|---|---|---|
| 209 W Miracle Strip Pkwy Unit A203 Mary Esther, FL | 2.0 | 1.0 | 900 | $1,350 | $1.50 | 21d | 1 | 0.01mi |
| 280 Anderson Dr Mary Esther, FL | 3.0 | 1.0 | 1066 | $1,695 | $1.59 | 43d | 1 | 0.29mi |
| 200 Page Bacon Rd Mary Esther, FL | 1.0–3.0 | 1.0–2.0 | 1030 | $2,208 | $2.14 | 13d | 18 | 0.81mi |
| 413 Sea Rover Ln NW Unit F Fort Walton Beach, FL | 2.0 | 1.5 | 1035 | $1,600 | $1.55 | 21d | 1 | 1.48mi |
| 413 Sea Rover Ln NW Unit F Fort Walton Beach, FL | 2.0 | 1.5 | 1035 | $1,600 | $1.55 | 13d | 1 | 1.48mi |
HOA detail condo
- Monthly dues
- $0 · $0/yr
- Assessments
- None detected in remarks — confirm with the listing agent.
Listing history 34 events
-
2026-06-18days on market $151,500 Active 101 DOM
-
2026-06-17days on market $151,500 Active 100 DOM
-
2026-06-16days on market $151,500 Active 99 DOM
-
2026-06-15days on market $151,500 Active 98 DOM
-
2026-06-14days on market $151,500 Active 96 DOM
-
2026-06-13days on market $151,500 Active 95 DOM
-
2026-06-10days on market $151,500 Active 93 DOM
-
2026-06-09days on market $151,500 Active 92 DOM
-
2026-06-08days on market $151,500 Active 91 DOM
-
2026-06-07days on market $151,500 Active 90 DOM
-
2026-06-05days on market $151,500 Active 87 DOM
-
2026-06-02days on market $151,500 Active 85 DOM
-
2026-06-01days on market $151,500 Active 84 DOM
-
2026-05-31days on market $151,500 Active 83 DOM
-
2026-05-30days on market $151,500 Active 82 DOM
-
2026-03-09$151,500 Active 786-char remark
Show marketing remark (786 chars)
Welcome to easy coastal living at The Cedars in Mary Esther! This beautifully maintained 2-bedroom, fully furnished condo offers a true turnkey opportunity ideal for a primary residence, second home, or investment property near Hurlburt Field, area beaches, shopping, and dining. Fully furnished and truly turnkey — move in, rent, or enjoy immediately from day one. Step inside to a bright and inviting layout featuring comfortable living spaces and thoughtfully furnished interiors designed for immediate move-in convenience... Property is currently operating as a short-term rental and is being sold fully furnished, offering a turnkey opportunity for buyers seeking personal use or investment potential. Buyers should verify rental guidelines and HOA requirements.
-
2025-09-30price $199,900
-
2025-07-14$214,900 Active
-
2023-09-20soldstatus $155,000 Sold
-
2023-07-19status Pending
-
2023-07-11$175,000 Active
-
2023-05-01status Pending
-
2023-04-29historical
-
2023-03-19price $172,000
-
2023-01-19status Active
-
2023-01-10historical
-
2022-12-13price $175,000
-
2022-12-03price $190,000
-
2022-11-15price $200,000
-
2022-10-27$230,000 Active
-
2015-09-18soldstatus $75,000
-
2001-08-06soldstatus $46,000
-
2001-02-15$48,500
-
2001-02-13$48,500
ⓘ Source: listings_history table (triggers on properties + properties_extension) + one-shot
backfill from property_details.listing_events for pre-trigger history.
Nearby sold comps map
Loading sold comps map…
Walkable amenities ~0.75 mi
Loading nearby amenities…
Taxation est. · year 1
- Rental income
- $20,358
- − Mortgage interest
- −$8,486
- − Property taxes
- −$2,272
- − Insurance
- −$758
- − Repairs & maintenance
- −$1,629
- − Management
- −$1,629
- − HOA
- −$10,320
- − Depreciation
- −$4,407
- Taxable loss
- −$9,143
- Est. tax savings @ 24.0%
- +$2,194
- After-tax cash flow
- $-4,607/yr
For passive investors: Depreciation is non-cash, so a rental often shows a tax loss while cash-flowing — sheltering income. Rental losses are passive: they offset passive income freely, and up to $25,000/yr can offset ordinary (W-2) income if you actively participate and your MAGI is under $100k (phasing out to $0 by $150k); unused losses carry forward. On sale, claimed depreciation is recaptured at up to 25%, and gains may owe capital-gains tax (a 1031 exchange can defer both). Figures are a year-1 estimate at your 24.0% rate — not tax advice; consult a CPA.
Condition & rehab AI · 13 photos
This well-maintained and fully furnished condo is in good condition with no major repairs needed. It offers a turnkey opportunity for a primary residence, second home, or investment property near Hurlburt Field, area beaches, shopping, and dining.
Value-add opportunities
- Both Paint the exterior siding — Painting the exterior siding will improve the curb appeal and increase the property's value.
- Both Clean the windows — Clean windows will make the property look more inviting and increase its value.
- Both Trim the bushes and trees — Trimming the bushes and trees will improve the landscaping and increase the property's value.
Renovation cost estimate screening
Value-add ROI direction
- Both Paint the exterior siding — Painting the exterior siding will improve the curb appeal and increase the property's value. ↑
- Both Clean the windows — Clean windows will make the property look more inviting and increase its value. ↑
- Both Trim the bushes and trees — Trimming the bushes and trees will improve the landscaping and increase the property's value. ↑
ⓘ Cost ranges are severity-bucket heuristics (US national rule-of-thumb). Get contractor quotes + a written scope before underwriting a rehab budget.
Schools (NCES district)
- District
- Okaloosa
- NCES district ID
- 1201380
- Math proficiency
- 60% ▼ -12.00%
- Reading proficiency
- 60% ▼ -4.00%
- Median HH income
- $55,601
- Composite
- 51.62/100
- National rank
- #1705
- State rank
- #12 of 73 in FL
Livability — Mary Esther
- Score
- 89/100
- State rank
- #2
- US rank
- #137
Category grades
Schools grade is shown separately in the Schools card above.
Census & demographics
- Census place
- Mary Esther, FL
- County
- Okaloosa County · 194,352 people
- City population
- 12,063
- Metro
- Crestview-Fort Walton Beach-Destin, FL
- Population (ZIP)
- 12,063
- Household income
- $77,718
- Rent vs Own
- Severe rent burden
- 416.0
Population outlook (Okaloosa County) Hauer SSP2
- Today (2025)
- 235,133 people
- By 2030
- 253,483 · +7.8%
- By 2040
- 289,537 · +23.1%
- By 2050
- 322,954 · +37.3%
- By 2075
- 399,624 · +70.0%
- By 2100
- 425,311 · +80.9%
Race, ethnicity, and origin ACS 2023
- Neighborhood character
- Diverse neighborhood (Simpson 0.58)
- Race & ethnicity
- White 63% Two or more races 12% Black 12% Hispanic / Latino 9% Asian 8%
- Hispanic origin (detail)
- Mexican 3% Puerto Rican 2%
- Common ancestry
- Slovak 5% Romanian 2% Lithuanian 2%
- Foreign-born
- 5% · Canada, South Korea, China
- Languages at home
- 89% English-only · Other Indo-European 4% Spanish 3% Tagalog/Filipino 1%
Political lean MEDSL · Okaloosa
- 2024 margin
- Solid R (+42.4) · D 28.2% · R 70.7% · Other 1.1%
- 2008→2024 swing
- +2.5pp toward D · 2008: -44.9pp · 2024: -42.4pp
- All cycles
- 2024: R+42.4 2020: R+39.1 2016: R+47.8 2012: R+49.4 2008: R+44.9
Not yet ingested
- Civics
- —
Market trends
- HPI YoY
- ▼ -97.13%
- Current HPI
- 269.266
- Rent YoY
- ▼ -0.45%
- Metro
- Crestview-Fort Walton Beach-Destin, FL
- State GDP YoY
- ▲ 3.28%
- F500 in state
- 36
Industry mix (Fortune 500 HQ in FL)
| Industry | F500 HQs | Revenue |
|---|---|---|
| Industrial Technology | 2 | $29B |
|
||
| Insurance | 2 | $17B |
|
||
| Retail | 1 | $60B |
|
||
| Technology Distribution | 1 | $58B |
|
||
| Homebuilding | 1 | $35B |
|
||
| Technology Manufacturing | 1 | $35B |
|
||
Price history
+212.4% since first listed19 events — show timeline
- 2026-03-09 Listed $151,500 NAMLS
- 2025-09-30 Price Changed $199,900 ECAR
- 2025-07-14 Listed $214,900 ECAR
- 2023-09-20 Sold (MLS) $155,000 NAMLS
- 2023-07-19 Pending — NAMLS
- 2023-07-11 Listed $175,000 NAMLS
- 2023-05-01 Pending — NAMLS
- 2023-04-29 Listing Removed — NAMLS
- 2023-03-19 Price Changed $172,000 NAMLS
- 2023-01-19 Relisted — NAMLS
- 2023-01-10 Listing Removed — NAMLS
- 2022-12-13 Price Changed $175,000 NAMLS
- 2022-12-03 Price Changed $190,000 NAMLS
- 2022-11-15 Price Changed $200,000 NAMLS
- 2022-10-27 Listed $230,000 NAMLS
- 2015-09-18 Sold (MLS) $75,000 ECAR
- 2001-08-06 Sold (MLS) $46,000 ECAR
- 2001-02-15 Listed $48,500 ECAR
- 2001-02-13 Listed $48,500 ECAR
Cash-flow waterfall
monthlySold comps — $/sqft
last 12 mo · ≤1 miLoading sold comps…