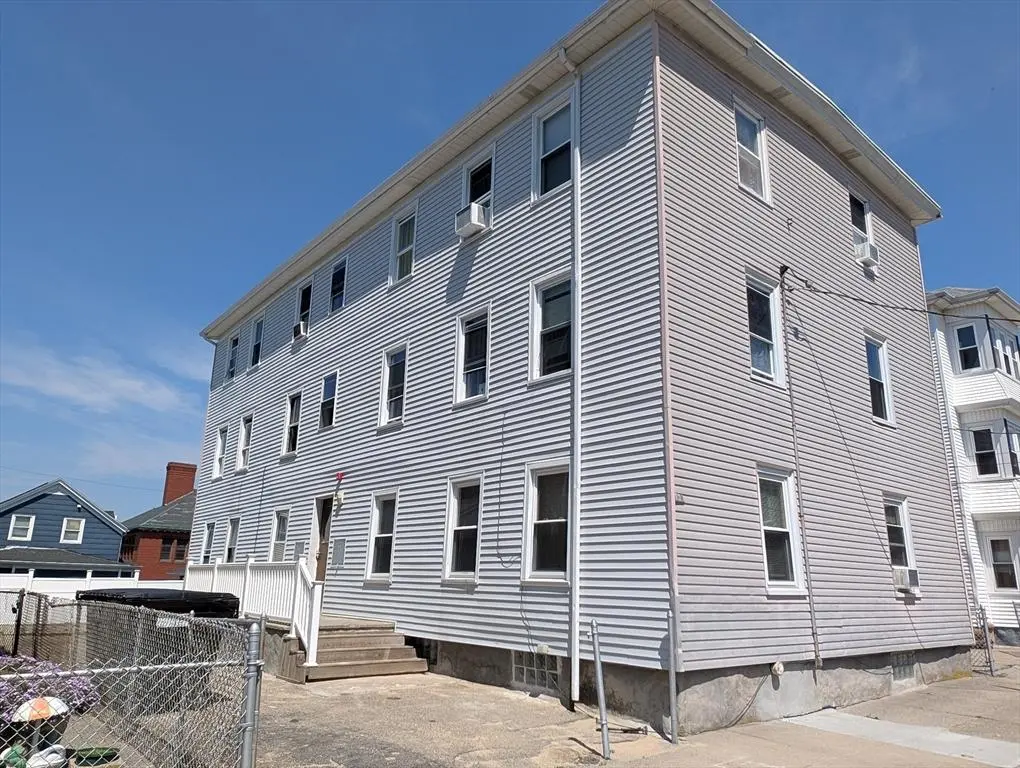
 6-Plex
131 Thomas St · Fall River, MA
Flood risk 1/10 · Minimal
- FEMA flood zone
- X (unshaded)
- Chance of flooding over 30 yrs
- 0.0%
- Est. flood insurance / yr
- $473 – $860
Fire risk 1/10 · Minimal
- Est. fire insurance / yr
- $915 – $1,699
Heat risk 6/10 · Moderate
- Hot days now (above 97°F)
- 7 days/yr
- Hot days in 30 yrs
- 15 days/yr
Wind risk 8/10 · Major
- Chance of severe wind over 30 yrs
- 80.0%
Air-quality risk 3/10 · Minor
- Unhealthy air days now
- 3 days/yr
- Unhealthy air days in 30 yrs
- 3 days/yr
Risk factors via First Street. Map © Google.
Why this score? — see what drove the C- grade
The composite is a weighted blend of 9 inputs, each scored 0–100. Each bar is that input's sub-score; the figure is the points it added to the 100-point composite (weight × sub-score).
- Cash flow +26.7/30.0
- DSCR +9.2/10.0
- 1% rule +6.2/10.0
- Livability +3.1/5.0
- Rent growth +2.5/5.0
- Condition / age +2.5/5.0
- Schools +1.9/10.0
- ARV discount +0.5/15.0
- Appreciation +0.0/10.0
$979,000
🖨 Deal sheet (PDF) 📄 Offer letter ✓ Due diligence
Multi-family units
County records classify this as Multi-Family (5+ Unit). Listing-text estimate: 6 units. confirmed
5+ unit building — per-unit beds/baths from public records are typically unavailable; the breakdown below (if shown) is an estimate from the listing text.
Listing remarks
Attention Investors! Turn key 6 unit currently fully occupied. All utilities are separated and paid for by the tenants. Two of the six units already have de-lead certificates. Many updates throughout the years including brand new fire panel and roof approximately 10 years ago. Driveway could easily be extended to offer even more off-street parking. Rents are currently below market. Do not miss out on this great investment in a community on the rise! Open House this Saturday, May 30th from 12:30 PM to 1:30 PM.
Key facts
- De-lead certificates
- Utilities separated
- Off-street parking
Tags
Property features AI
Finance
- HOA & community: Not a senior community
Exterior
- Parking: Open parking for 4 vehicles
- Utilities: Public water; Public sewer; Electric with circuit breakers; Gas available for range
- Home design: 5-9 family building; 5 total stories; Approximately built and renovated since (per public records)
- Construction: Frame construction; Granite foundation; Rubber roof; Certified treated for lead paint
- Exterior features: Public road frontage; Paved driveway and off-street open parking
Interior
- Flooring: Tile; Carpet; Varies
- Bathrooms: 6 full bathrooms
- Interior features: 29 total rooms; Full, unfinished basement with interior entry and concrete construction; Varied flooring including tile and carpet
Neighborhood map
What this means for you Summary
Snapshot
- This is a 6 × 3-bed/1.0-bath units multifamily listed at $979k.
Deal economics
- At list price, monthly cash flow is $3k ($32k/yr) — positive. Per door: $442/mo.
- The deal already cash-flows at list — no discount required.
- Meets the 1% rule at list price ($11k rent vs $979k).
- Recommended offer: $964k (1.5% below list) — sets the bar for market timing.
- Cap rate 9.5% vs local median 3.6% in Fall River — top-decile yield for the area; either an underpriced asset or a hidden risk that comps aren't pricing in. Stress-test before assuming the spread holds.
Location & tenants
- Location reads 61/100 on livability (#221 in MA) — a middle-class / working-renter tenant base. Strengths: health & safety A+; Watch: cost of living D+, schools D, crime F.
- Fall River (suburban): math 17% / reading 28% proficiency, ranked #288 of 302 in MA (top 95%) — low school quality limits family demand, transient renter base, plan for 1-2y turnover; 68% free/reduced lunch — lower-income household profile, screen leases tightly.
- Market conditions: 35 active listings in the ZIP; 760 units permitted in Bristol County in 2024 (142 in 5+ unit buildings).
- At $10,956/mo this rent would consume 276% of the median local household income ($48k/yr) (locally 1335% of renters already pay >50% of income on rent) — very limited rent-growth headroom before tenants either downsize or default.
Forward outlook
- Local home prices are declining (-3.0%/yr); year-one equity from $7k of loan paydown is wiped out by about $29k of value loss. Plan a longer hold.
- Bristol County population projected to shrink 3% by 2050 — rents likely to lag national; underwrite the cash flow, not the appreciation.
- At projected returns (-3.0% appreciation + 3.0% rent growth), your $274k cash investment doubles in ~10 years — after that, you're playing with house money.
Negotiation context
- It's been on market 28 days — a 2% lower offer ($964k) is reasonable based on typical stale-listing flexibility.
Risks & watch-outs
- Watch-outs: built in 1900 — expect roof / HVAC / electrical / plumbing capex.
- Climate carrying-cost: severe wind risk, 80% chance of damaging wind over 30y; extreme-heat days projected 7→15/yr by 2055 (HVAC capex compounding) — expect insurance premiums to compound above CPI over the hold.
Questions for the listing agent
- Can we see the unit-by-unit rent roll, current vacancy, and any below-market leases? What's the average tenancy length?
- What capital expenditures (roof, boiler, parking lot, exteriors) have been made in the last 5 years, and what's planned in the next 2?
- Built in 1900 — when were the roof, HVAC, electrical panel, plumbing, and water heater last replaced?
- Is there a deadline driving the sale (1031 exchange, divorce, estate, relocation)? That informs how much negotiation room exists.
- Schools are D-rated, which usually means shorter tenancies and higher turnover. Who's the typical renter profile here, and what's been the actual vacancy rate?
- Crime grade is F in this area — have there been break-ins, vandalism, or insurance claims at this property in the last 3 years? What carrier currently insures it and at what premium?
- What's the average days-on-market for RENTAL listings here right now (not sales)? A rising rental-DOM trend means longer vacancies and softer asking-rent achievability than the comps imply.
- What's the recent tenant-quality profile in this submarket — average credit score on applications, eviction rate, late-payment / NSF rate, and stable-employment percentage? A property-management company in the area should have these aggregated.
- How much new apartment / multifamily construction is in the pipeline within 1–3 miles? Heavy new supply (>2% of stock underway) typically softens rents 12–24 months out; light construction supports rent growth.
Investment metrics
- 1% rule
- 1.12% ✓
- Cap rate
- 9.54%
- Cash-on-cash
- 11.61%
- DSCR
- 1.52
- GRM
- 7.4
CMA / ARV
- ARV (on-the-fly)
- $846,720
- Comps found
- 3
Show comp detail 3 sales within ~0.75 mi
| Address | Dist | Beds/Ba | Sqft | Sold | Price | $/sf | Match |
|---|---|---|---|---|---|---|---|
| 31 Choate St | 0.29mi | 11/3.0 (-1) | 4,977 (+6%) | 3mo | $840,000 | $169 | 57 |
| 48 Thomas St | 0.08mi | 11/3.0 (-1) | 4,169 (-11%) | 13mo | $750,000 | $180 | 49 |
| 105 16th St | 0.59mi | 11/4.0 (-1) | 4,158 (-12%) | 3mo | $800,000 | $192 | 38 |
Match score weights: distance 35% · size 25% · config 20% · recency 20%. Top-matched comps best support the ARV.
Projected returns pro-forma
-3.0% appreciation · 3.0% rent growth · sell at horizon
- IRR
- 0.9%
- Equity multiple
- 1.04×
- Total profit
- $9,912
- Equity at exit
- $145,972
- IRR
- 10.6%
- Equity multiple
- 1.82×
- Total profit
- $224,829
- Equity at exit
- $84,646
Cash invested: $274,120 (down + closing). Projections, not guarantees.
Landlord ↔ Tenant lean methodology
- Overall (STATE)
- 20 Strongly Tenant-Friendly
- State Massachusetts
- 20 Strongly Tenant-Friendly · D+15
- County
- — inherits STATE
- City
- — inherits STATE
ZIP-level market 02723
- Home prices YoY
- -16.9%
- Active inventory
- 35
- Price-to-rent
- 44.7×
Monthly cashflow live
- Estimated rent
- $10,956 high interval (Pro) →
- Mortgage (P&I)
- −$5,134
- Tax from tax record
- −$462 /mo · $5,546/yr
- Insurance
- −$408
- HOA
- −$0
- Vacancy / Maint / Mgmt
- −$2,301
- Net cashflow
- $2,651
Break-even live
Sensitivity live
| Price | -10% $3,205 | -5% $2,928 | +0% $2,651 | +5% $2,374 | +10% $2,097 |
|---|---|---|---|---|---|
| Rent | -10% $1,786 | -5% $2,218 | +0% $2,651 | +5% $3,084 | +10% $3,517 |
| Rate | -1.0pp $3,144 | -0.5pp $2,900 | base $2,651 | +0.5pp $2,397 | +1.0pp $2,139 |
6-unit breakdown (identical units grouped — click to expand)
| Units | Beds | Baths | Est. rent |
|---|---|---|---|
| 6× units | 3 | 1 | $10,956 |
| #1 | 3 | 1 | $1,826 |
| #2 | 3 | 1 | $1,826 |
| #3 | 3 | 1 | $1,826 |
| #4 | 3 | 1 | $1,826 |
| #5 | 3 | 1 | $1,826 |
| #6 | 3 | 1 | $1,826 |
| Total (6 units) | $10,956 | ||
UW: 25.0% down · 7.5% · 30yr · 1.5% tax · 5.0% vac · 8.0% maint · 8.0% mgmt
Financing live
Cash to close
- Down payment
- $244,750
- Closing costs
- $29,370
- Reserves months
- —
- Total cash needed
- —
Loan-product check · same deal, 3 products live
Conventional
25% down · 7.5% · 30yr
- Down + closing
- —
- Monthly P&I
- —
- Monthly cashflow
- —
- DSCR
- —
- Eligible?
- —
Personal DTI + credit; lowest rate.
DSCR
20% down · 8.5% · 30yr
- Down + closing
- —
- Monthly P&I
- —
- Monthly cashflow
- —
- DSCR
- —
- Eligible?
- —
No personal income docs; deal must DSCR.
Hard money
10% down · 12.0% · 12mo
- Down + closing
- —
- Monthly P&I
- —
- Monthly cashflow
- —
- DSCR
- —
- Eligible?
- —
Short-term bridge; refi at stabilization.
Listing history 14 events
-
2026-06-18days on market $979,000 Active 28 DOM
-
2026-06-17days on market $979,000 Active 27 DOM
-
2026-06-16days on market $979,000 Active 26 DOM
-
2026-06-15days on market $979,000 Active 25 DOM
-
2026-06-13days on market $979,000 Active 23 DOM
-
2026-06-09days on market $979,000 Active 19 DOM
-
2026-06-08days on market $979,000 Active 18 DOM
-
2026-06-07days on market $979,000 Active 17 DOM
-
2026-06-05days on market $979,000 Active 14 DOM
-
2026-06-03days on market $979,000 Active 13 DOM
-
2026-06-02days on market $979,000 Active 12 DOM
-
2026-06-01days on market $979,000 Active 11 DOM
-
2026-05-31days on market $979,000 Active 10 DOM
-
2026-05-21$979,000 New
ⓘ Source: listings_history table (triggers on properties + properties_extension) + one-shot
backfill from property_details.listing_events for pre-trigger history.
Tax reassessment forecast MA · Partial reset (capped growth)
- Current annual tax
- $5,546 · $462/mo
- Projected year-2 tax
- $8,794 · $733/mo
- Expected delta
- +$3,248/yr (+$271/mo · 58.6%)
ⓘ Screening estimate from a state-policy table — verify with the county assessor before closing.
Climate risk First Street
- Flood 1/10 Low FEMA zone X (unshaded) · 0% chance over 30 yrs
- Wildfire 1/10 Low
- Heat 6/10 Major 7 d/yr ≥97°F today · 15 d/yr by 30 yrs out
- Wind 8/10 Severe 80% chance of damaging wind over 30 yrs
- Air quality 3/10 Moderate 3 unhealthy d/yr today · 3 by 30 yrs out
Nearby sold comps map
Loading sold comps map…
Walkable amenities ~0.75 mi
Loading nearby amenities…
Taxation est. · year 1
- Rental income
- $131,472
- − Mortgage interest
- −$54,839
- − Property taxes
- −$5,546
- − Insurance
- −$4,895
- − Repairs & maintenance
- −$10,518
- − Management
- −$10,518
- − Depreciation
- −$28,480
- Taxable income
- $16,676
- Est. tax owed @ 24.0%
- −$4,002
- After-tax cash flow
- $27,812/yr
For passive investors: Depreciation is non-cash, so a rental often shows a tax loss while cash-flowing — sheltering income. Rental losses are passive: they offset passive income freely, and up to $25,000/yr can offset ordinary (W-2) income if you actively participate and your MAGI is under $100k (phasing out to $0 by $150k); unused losses carry forward. On sale, claimed depreciation is recaptured at up to 25%, and gains may owe capital-gains tax (a 1031 exchange can defer both). Figures are a year-1 estimate at your 24.0% rate — not tax advice; consult a CPA.
Schools (NCES district)
- District
- Fall River
- NCES district ID
- 2504830
- Math proficiency
- 17% ▼ -15.00%
- Reading proficiency
- 28% ▼ -6.00%
- Median HH income
- $35,773
- Composite
- 18.59/100
- National rank
- #8905
- State rank
- #288 of 302 in MA
Livability — Fall River
- Score
- 61/100
- State rank
- #221
- US rank
- #18220
Category grades
Schools grade is shown separately in the Schools card above.
Census & demographics
- Census place
- Fall River, MA
- County
- Bristol County · 342,083 people
- City population
- 93,033
- Metro
- Providence-Warwick, RI-MA
- Population (ZIP)
- 17,067
- Household income
- $47,633
- Rent vs Own
- Severe rent burden
- 1335.0
Population outlook (Bristol County) Hauer SSP2
- Today (2025)
- 570,212 people
- By 2030
- 571,181 · +0.2%
- By 2040
- 565,389 · -0.8%
- By 2050
- 552,141 · -3.2%
- By 2075
- 520,923 · -8.6%
- By 2100
- 474,363 · -16.8%
Race, ethnicity, and origin ACS 2023
- Neighborhood character
- Predominantly White (65%)
- Race & ethnicity
- White 65% Hispanic / Latino 16% Two or more races 14% Black 4% Asian 2%
- Hispanic origin (detail)
- Puerto Rican 8%
- Common ancestry
- Russian 34% Lithuanian 6% Estonian 3%
- Foreign-born
- 24% · Canada, Vietnam, China
- Languages at home
- 58% English-only · Other Indo-European 26% Spanish 13% French/Haitian/Cajun 1%
Political lean MEDSL · Bristol
- 2024 margin
- Toss-up / Even · D 49.8% · R 48.5% · Other 1.8%
- 2008→2024 swing
- -21.9pp toward R · 2008: 23.2pp · 2024: 1.3pp
- All cycles
- 2024: D+1.3 2020: D+12.0 2016: D+9.3 2012: D+20.5 2008: D+23.2
Not yet ingested
- Civics
- —
Market trends
- HPI YoY
- ▼ -70.57%
- Current HPI
- 347.6737
- Rent YoY
- —
- Metro
- Providence-Warwick, RI-MA
- State GDP YoY
- ▲ 2.28%
- F500 in state
- 38
Industry mix (Fortune 500 HQ in MA)
| Industry | F500 HQs | Revenue |
|---|---|---|
| Technology | 3 | $17B |
|
||
| Insurance | 2 | $84B |
|
||
| Retail | 2 | $76B |
|
||
| Life Sciences | 1 | $43B |
|
||
| Energy Technology | 1 | $31B |
|
||
| Aerospace / Defense | 1 | $18B |
|
||
Price history
1 event — show timeline
- 2026-05-21 Listed $979,000 MLS PIN
Property tax history
+5.6%/yrLatest (2023): $5,546 · +13.3% YoY. Source: county tax records.
Cash-flow waterfall
monthlySold comps — $/sqft
last 12 mo · ≤1 miLoading sold comps…