 Multi-family
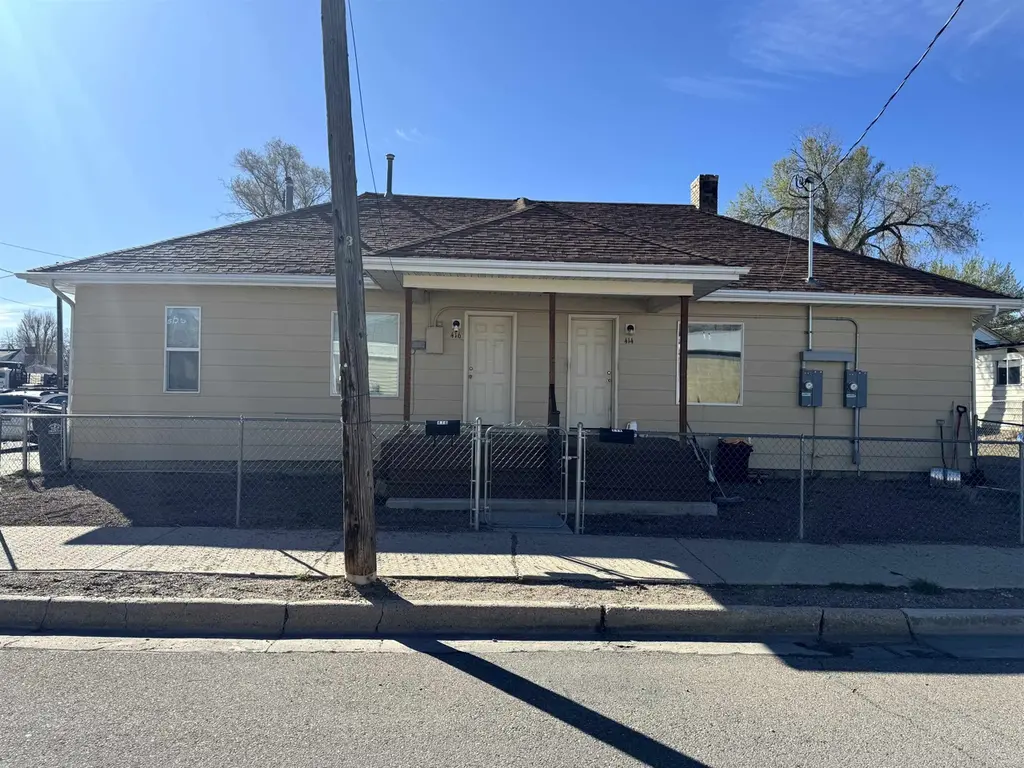
414 Cedar St · Rock Springs, WY
Flood risk 5/10 · Moderate
- FEMA flood zone
- X (shaded)
- Chance of flooding over 30 yrs
- 0.24%
- Est. flood insurance / yr
- $507 – $1,088
Fire risk 5/10 · Moderate
- Est. fire insurance / yr
- $564 – $1,046
Heat risk 2/10 · Minimal
- Hot days now (above 87°F)
- 7 days/yr
- Hot days in 30 yrs
- 17 days/yr
Wind risk 1/10 · Minimal
- Chance of severe wind over 30 yrs
- —
Air-quality risk 1/10 · Minimal
- Unhealthy air days now
- 0 days/yr
- Unhealthy air days in 30 yrs
- 0 days/yr
Risk factors via First Street. Map © Google.
Why this score? — see what drove the B- grade
The composite is a weighted blend of 9 inputs, each scored 0–100. Each bar is that input's sub-score; the figure is the points it added to the 100-point composite (weight × sub-score).
- Cash flow +25.9/30.0
- ARV discount +15.0/15.0
- DSCR +8.7/10.0
- 1% rule +5.7/10.0
- Schools +4.2/10.0
- Livability +3.5/5.0
- Condition / age +2.5/5.0
- Rent growth +2.0/5.0
- Appreciation +0.0/10.0
$200,000
🖨 Deal sheet 📄 Offer letter ✓ Due diligence
Multi-family units
County records classify this as Multi-Family (2-4 Unit). Listing-text estimate: 1 unit. estimate disagrees with records
Key facts
- 3,920 sq ft lot
- Built 1909
- Listed 72 days
Tags
Property features AI
Exterior
- Parking: Off-street parking
- Utilities: Public water; Public sewer
- Home design: Duplex (residential income)
- Construction: Asphalt roof
- Exterior features: Chain link fencing
Interior
- Kitchen: Dishwasher; Refrigerator; Range; Oven
- Heating & cooling: Electric heating
- Interior features: Dishwasher; Refrigerator; Range; Oven
Neighborhood map
What this means for you Summary
Snapshot
- This is a 4-bed/2.0-bath multifamily listed at $200k.
Deal economics
- At list price, monthly cash flow is $491 ($6k/yr) — positive.
- The deal already cash-flows at list — no discount required.
- Meets the 1% rule at list price ($2k rent vs $200k).
- Recommended offer: $188k (6.0% below list) — sets the bar for market timing.
- Cap rate 9.2% vs local median 2.9% in Rock Springs — top-decile yield for the area; either an underpriced asset or a hidden risk that comps aren't pricing in. Stress-test before assuming the spread holds.
Location & tenants
- Location reads 70/100 on livability (#35 in WY) — a middle-class / working-renter tenant base. Strengths: cost of living A+, housing A+, crime A; Watch: schools C-, amenities F, commute F.
- Sweetwater County School District #1 (town): math 44% / reading 49% proficiency, ranked #31 of 41 in WY (top 76%) — families likely to look elsewhere, expect single-tenant / working-renter base with shorter leases.
- Market conditions: Rents soft (-2.1%/yr); 177 active listings in the ZIP; 47 units permitted in Sweetwater County in 2024 (0 in 5+ unit buildings).
- This rent runs 37% of the median local income ($70k/yr) — at the standard rent-burdened threshold; future hikes will face affordability resistance.
Forward outlook
- Local home prices are declining (-3.0%/yr); year-one equity from $1k of loan paydown is wiped out by about $6k of value loss. Plan a longer hold.
- Sweetwater County population projected at +12% by 2050 — modest demand growth; plan on rents tracking national, not racing it.
Negotiation context
- It's been on market 73 days — a 6% lower offer ($188k) is reasonable based on typical stale-listing flexibility.
Risks & watch-outs
- Watch-outs: built in 1909 — expect roof / HVAC / electrical / plumbing capex.
- Climate carrying-cost: moderate flood risk; moderate wildfire risk — expect insurance premiums to compound above CPI over the hold.
Questions for the listing agent
- It's been on market 73 days. Have you received any prior offers? Is the seller open to a 6% concession, seller financing, or rate buy-down credit?
- Built in 1909 — when were the roof, HVAC, electrical panel, plumbing, and water heater last replaced?
- Why hasn't it sold? Are there any deal-killer items the seller is aware of (foundation, flood, title, zoning, code violations)?
- Is there a deadline driving the sale (1031 exchange, divorce, estate, relocation)? That informs how much negotiation room exists.
- What's the average days-on-market for RENTAL listings here right now (not sales)? A rising rental-DOM trend means longer vacancies and softer asking-rent achievability than the comps imply.
- What's the recent tenant-quality profile in this submarket — average credit score on applications, eviction rate, late-payment / NSF rate, and stable-employment percentage? A property-management company in the area should have these aggregated.
- How much new apartment / multifamily construction is in the pipeline within 1–3 miles? Heavy new supply (>2% of stock underway) typically softens rents 12–24 months out; light construction supports rent growth.
Investment metrics
- 1% rule
- 1.07% ✓
- Cap rate
- 9.24%
- Cash-on-cash
- 10.52%
- DSCR
- 1.47
- GRM
- 7.8
CMA / ARV
- ARV (on-the-fly)
- $249,473
- Comps found
- 2
Show comp detail 2 sales within ~0.75 mi
| Address | Dist | Beds/Ba | Sqft | Sold | Price | $/sf | Match |
|---|---|---|---|---|---|---|---|
| 706 Gobel Street St | 0.22mi | 3/2.0 (-1) | 1,562 (-2%) | 2mo | $245,000 | $157 | 80 |
| 1019 6th St | 0.59mi | 4/3.0 | 1,724 (+8%) | 13mo | $130,000 | $75 | 44 |
Match score weights: distance 35% · size 25% · config 20% · recency 20%. Top-matched comps best support the ARV.
Projected returns pro-forma
-3.0% appreciation · 0.0% rent growth · sell at horizon
- IRR
- -3.7%
- Equity multiple
- 0.87×
- Total profit
- $-7,497
- Equity at exit
- $29,821
- IRR
- 2.6%
- Equity multiple
- 1.16×
- Total profit
- $9,117
- Equity at exit
- $17,292
Cash invested: $56,000 (down + closing). Projections, not guarantees.
Landlord ↔ Tenant lean methodology
- Overall (STATE)
- 90 Strongly Landlord-Friendly
- State Wyoming
- 90 Strongly Landlord-Friendly · R+25
- County
- — inherits STATE
- City
- — inherits STATE
ZIP-level market 82901
- Rents YoY
- -2.1%
- Active inventory
- 177
- Price-to-rent
- 15.5×
Monthly cashflow live
- Estimated rent
- $2,148 medium interval (Pro) →
- Mortgage (P&I)
- −$1,049
- Tax from tax record
- −$74 /mo · $883/yr
- Insurance
- −$83
- HOA
- −$0
- Vacancy / Maint / Mgmt
- −$451
- Net cashflow
- $491
Break-even live
2-unit breakdown (identical units grouped — click to expand)
| Units | Beds | Baths | Est. rent |
|---|---|---|---|
| 2× units | 2 | 1 | $2,148 |
| #1 | 2 | 1 | $1,074 |
| #2 | 2 | 1 | $1,074 |
| Total (2 units) | $2,148 | ||
UW: 25.0% down · 7.5% · 30yr · 1.5% tax · 5.0% vac · 8.0% maint · 8.0% mgmt
Financing live
Cash to close
- Down payment
- $50,000
- Closing costs
- $6,000
- Reserves months
- —
- Total cash needed
- —
Loan-product check · same deal, 3 products live
Conventional
25% down · 7.5% · 30yr
- Down + closing
- —
- Monthly P&I
- —
- Monthly cashflow
- —
- DSCR
- —
- Eligible?
- —
Personal DTI + credit; lowest rate.
DSCR
20% down · 8.5% · 30yr
- Down + closing
- —
- Monthly P&I
- —
- Monthly cashflow
- —
- DSCR
- —
- Eligible?
- —
No personal income docs; deal must DSCR.
Hard money
10% down · 12.0% · 12mo
- Down + closing
- —
- Monthly P&I
- —
- Monthly cashflow
- —
- DSCR
- —
- Eligible?
- —
Short-term bridge; refi at stabilization.
Listing history 17 events
-
2026-06-19days on market $200,000 Active 73 DOM
-
2026-06-18days on market $200,000 Active 72 DOM
-
2026-06-17days on market $200,000 Active 71 DOM
-
2026-06-16days on market $200,000 Active 70 DOM
-
2026-06-15days on market $200,000 Active 69 DOM
-
2026-06-14days on market $200,000 Active 67 DOM
-
2026-06-12days on market $200,000 Active 66 DOM
-
2026-06-09days on market $200,000 Active 63 DOM
-
2026-06-08days on market $200,000 Active 62 DOM
-
2026-06-07days on market $200,000 Active 61 DOM
-
2026-06-05days on market $200,000 Active 58 DOM
-
2026-06-02days on market $200,000 Active 56 DOM
-
2026-06-01days on market $200,000 Active 55 DOM
-
2026-05-31days on market $200,000 Active 54 DOM
-
2026-05-30days on market $200,000 Active 53 DOM
-
2026-04-07$200,000 Active
-
2013-06-28soldstatus
ⓘ Source: listings_history table (triggers on properties + properties_extension) + one-shot
backfill from property_details.listing_events for pre-trigger history.
Tax reassessment forecast WY · Resets to sale price
- Current annual tax
- $883 · $74/mo
- Projected year-2 tax
- $1,220 · $102/mo
- Expected delta
- +$337/yr (+$28/mo · 38.1%)
ⓘ Screening estimate from a state-policy table — verify with the county assessor before closing.
Climate risk First Street
- Flood 5/10 Major FEMA zone X (shaded) · 24% chance over 30 yrs
- Wildfire 5/10 Major
- Heat 2/10 Low 7 d/yr ≥87°F today · 17 d/yr by 30 yrs out
- Wind 1/10 Low
- Air quality 1/10 Low 0 unhealthy d/yr today · 0 by 30 yrs out
Nearby sold comps map
Loading sold comps map…
Walkable amenities ~0.75 mi
Loading nearby amenities…
Taxation est. · year 1
- Rental income
- $25,776
- − Mortgage interest
- −$11,203
- − Property taxes
- −$883
- − Insurance
- −$1,000
- − Repairs & maintenance
- −$2,062
- − Management
- −$2,062
- − Depreciation
- −$5,818
- Taxable income
- $2,747
- Est. tax owed @ 24.0%
- −$659
- After-tax cash flow
- $5,235/yr
For passive investors: Depreciation is non-cash, so a rental often shows a tax loss while cash-flowing — sheltering income. Rental losses are passive: they offset passive income freely, and up to $25,000/yr can offset ordinary (W-2) income if you actively participate and your MAGI is under $100k (phasing out to $0 by $150k); unused losses carry forward. On sale, claimed depreciation is recaptured at up to 25%, and gains may owe capital-gains tax (a 1031 exchange can defer both). Figures are a year-1 estimate at your 24.0% rate — not tax advice; consult a CPA.
Schools (NCES district)
- District
- Sweetwater County School District #1
- NCES district ID
- 5605302
- Math proficiency
- 44% ▼ -4.00%
- Reading proficiency
- 49% ▼ -3.00%
- Median HH income
- $68,679
- Composite
- 41.66/100
- National rank
- #3422
- State rank
- #31 of 41 in WY
Livability — Rock Springs
- Score
- 70/100
- State rank
- #35
- US rank
- #8016
Category grades
Schools grade is shown separately in the Schools card above.
Census & demographics
- Census place
- Rock Springs, WY
- County
- Sweetwater County · 27,198 people
- City population
- 27,198
- Metro
- Rock Springs, WY
- Population (ZIP)
- 27,198
- Household income
- $69,954
- Rent vs Own
- Severe rent burden
- 609.0
Population outlook (Sweetwater County) Hauer SSP2
- Today (2025)
- 48,212 people
- By 2030
- 49,664 · +3.0%
- By 2040
- 51,984 · +7.8%
- By 2050
- 54,005 · +12.0%
- By 2075
- 57,684 · +19.6%
- By 2100
- 57,857 · +20.0%
Race, ethnicity, and origin ACS 2023
- Neighborhood character
- Predominantly White (74%)
- Race & ethnicity
- White 74% Hispanic / Latino 19% Two or more races 9% Black 2% Native American 1%
- Hispanic origin (detail)
- Mexican 15%
- Common ancestry
- Italian 5% Lithuanian 2% Portuguese 2%
- Foreign-born
- 7% · Canada, Vietnam, Jamaica
- Languages at home
- 90% English-only · Spanish 9% Vietnamese 1%
Political lean MEDSL · Sweetwater
- 2024 margin
- Solid R (+53.2) · D 22.5% · R 75.7% · Other 1.8%
- 2008→2024 swing
- -25.7pp toward R · 2008: -27.5pp · 2024: -53.2pp
- All cycles
- 2024: R+53.2 2020: R+50.6 2016: R+53.5 2012: R+39.7 2008: R+27.5
Not yet ingested
- Civics
- —
Market trends
- HPI YoY
- ▼ -270.69%
- Current HPI
- 146.2451
- Rent YoY
- ▼ -2.15%
- Metro
- Rock Springs, WY
- State GDP YoY
- —
- F500 in state
- 0
Price history
2 events — show timeline
- 2026-04-07 Listed $200,000 WMLS
- 2013-06-28 Sold (Public Records) — Public Records
Property tax history
+7.4%/yrLatest (2025): $883 · -0.6% YoY. Source: county tax records.
Cash-flow waterfall
monthlySold comps — $/sqft
last 12 mo · ≤1 miLoading sold comps…