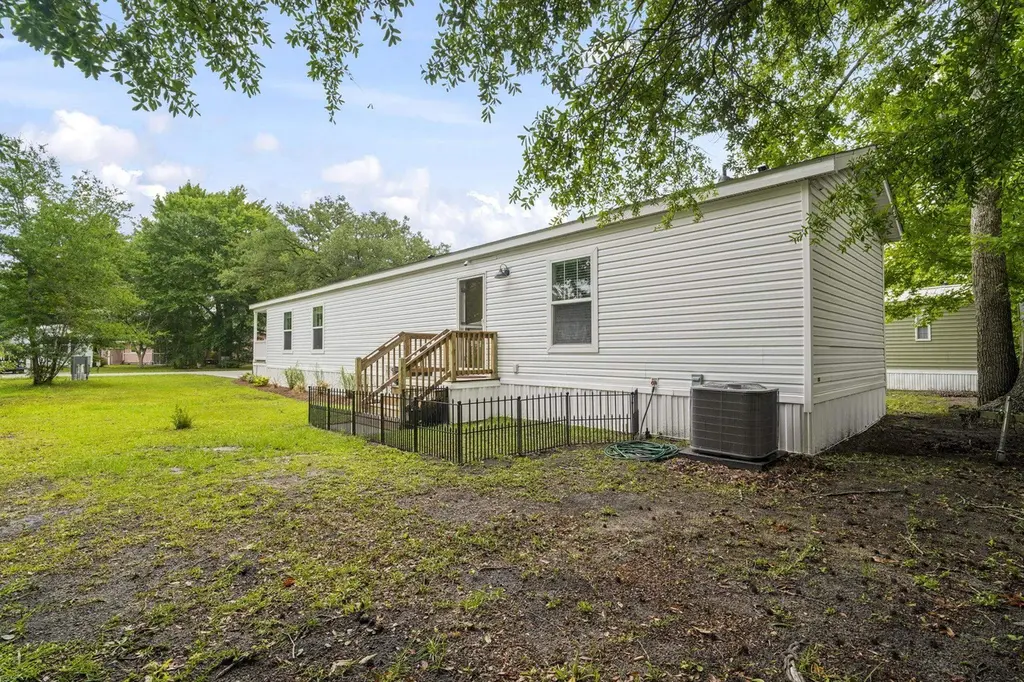
23 Crooked Island Cir · Murrells Inlet, SC
Flood risk 1/10 · Minimal
- FEMA flood zone
- X (unshaded)
- Chance of flooding over 30 yrs
- 0.0%
- Est. flood insurance / yr
- $507 – $1,088
Fire risk 4/10 · Minor
- Est. fire insurance / yr
- $783 – $1,453
Heat risk 9/10 · Severe
- Hot days now (above 106°F)
- 7 days/yr
- Hot days in 30 yrs
- 18 days/yr
Wind risk 9/10 · Severe
- Chance of severe wind over 30 yrs
- 99.0%
Air-quality risk 2/10 · Minimal
- Unhealthy air days now
- 0 days/yr
- Unhealthy air days in 30 yrs
- 1 days/yr
Risk factors via First Street. Map © Google.
Why this score? — see what drove the B- grade
The composite is a weighted blend of 9 inputs, each scored 0–100. Each bar is that input's sub-score; the figure is the points it added to the 100-point composite (weight × sub-score).
- Cash flow +30.0/30.0
- DSCR +10.0/10.0
- 1% rule +8.8/10.0
- ARV discount +7.5/15.0
- Livability +3.8/5.0
- Rent growth +3.7/5.0
- Schools +2.7/10.0
- Condition / age +2.5/5.0
- Appreciation +0.0/10.0
$129,900
🖨 Deal sheet (PDF) 📄 Offer letter ✓ Due diligence
Listing remarks MLS
Welcome to your beautiful new home in the 55+ community of Oceanside Landing. This spacious 2 bedroom, 2 bath home is awaiting nothing but you. You'll find beautiful flooring throughout the home and stainless steel appliances with a large work island in the kitchen. The community has plenty of amenities including an outdoor pool, tennis court and an amenity center for your leisure. Don't forget you are just minutes from the Murrells Inlet Marshwalk with lots of restaurants and fun things to do.
Key facts
- Clubhouse
- Brand new shed
- Brand new driveway
Tags
Property features AI
Finance
- Financial info: Property is offered for sale; Owner allows pets
- HOA & community: Monthly association fees; Community clubhouse; Community recreation area; Tennis courts; Community pool; Pet restrictions
Exterior
- Parking: Driveway parking for 2 vehicles
- Security: Smoke detector(s)
- Utilities: Public water; Sewer available; Electricity available; Cable available; Underground utilities
- Home design: Single wide mobile home; Resale property
- Construction: Vinyl siding
- Exterior features: Front porch; Storage; Community outdoor pool
Interior
- Kitchen: Dishwasher; Range; Microwave; Refrigerator; Freezer; Kitchen island; Stainless steel appliances; Solid surface counters
- Bedrooms: Primary bedroom on the main level; Split bedroom layout
- Flooring: Laminate; Vinyl
- Bathrooms: 2 full bathrooms; Dual sinks; Separate shower; Vanity
- Heating & cooling: Central heating (electric); Central air conditioning
- Interior features: Dual sinks; Separate shower; Vanity; Walk-in closet(s); Kitchen island; Solid surface counters; Stainless steel appliances; Main level primary; Split bedrooms; Bedroom on main level; Unfurnished
- Laundry & utility: Washer hookup; Washer; Dryer; Utility room
Neighborhood map
What this means for you Summary
Snapshot
- This is a 2-bed/2.0-bath manufactured listed at $130k.
Deal economics
- At list price, monthly cash flow is $522 ($6k/yr) — positive.
- The deal already cash-flows at list — no discount required.
- Meets the 1% rule at list price ($2k rent vs $130k).
- Cap rate 11.1% vs local median 2.2% in Murrells Inlet — top-decile yield for the area; either an underpriced asset or a hidden risk that comps aren't pricing in. Stress-test before assuming the spread holds.
Location & tenants
- Location reads 76/100 on livability (#25 in SC, #3,720 nationally) — a middle-class / working-renter tenant base. Strengths: crime A+, housing A+, health & safety A+; Watch: amenities F, commute F.
- Georgetown 01 (town): math 26% / reading 38% proficiency, ranked #51 of 80 in SC (top 64%) — families likely to look elsewhere, expect single-tenant / working-renter base with shorter leases.
- Market conditions: Rents rising fast (+4.7%/yr); 287 active listings in the ZIP; 2 comparable units currently listed for rent nearby; 323 units permitted in Georgetown County in 2024 (0 in 5+ unit buildings).
- This rent runs 31% of the median local income ($71k/yr) — at the standard rent-burdened threshold; future hikes will face affordability resistance.
Forward outlook
- Local home prices are declining (-3.0%/yr); year-one equity from $898 of loan paydown is wiped out by about $4k of value loss. Plan a longer hold.
- At projected returns (-3.0% appreciation + 4.7% rent growth), your $36k cash investment doubles in ~7 years — after that, you're playing with house money.
Negotiation context
- Only 7 days on market — expect competitive offers; lowballing is unlikely to land.
- 6 sale attempts since 9y ago with the ask held roughly flat each time — persistent listings suggest the price (not the market) is what's stuck; bring a comps-based counter.
Risks & watch-outs
- Climate carrying-cost: severe wind risk, 99% chance of damaging wind over 30y; extreme-heat days projected 7→18/yr by 2055 (HVAC capex compounding) — expect insurance premiums to compound above CPI over the hold.
Questions for the listing agent
- Is there a deadline driving the sale (1031 exchange, divorce, estate, relocation)? That informs how much negotiation room exists.
- Schools are A-rated — typically a magnet for longer-tenancy family renters. What's the average tenant stay here, and is there a school-zone premium baked into asking?
- What's the average days-on-market for RENTAL listings here right now (not sales)? A rising rental-DOM trend means longer vacancies and softer asking-rent achievability than the comps imply.
- What's the recent tenant-quality profile in this submarket — average credit score on applications, eviction rate, late-payment / NSF rate, and stable-employment percentage? A property-management company in the area should have these aggregated.
- How much new for-sale + rental construction is in the pipeline within 1–3 miles? Heavy new supply typically softens prices + rents 12–24 months out; constrained supply supports both.
Investment metrics
- 1% rule
- 1.38% ✓
- Cap rate
- 11.11%
- Cash-on-cash
- 17.22%
- DSCR
- 1.77
- GRM
- 6.0
CMA / ARV
- ARV (on-the-fly)
- $66,330
- Comps found
- 12
Show comp detail 12 sales within ~0.75 mi
| Address | Dist | Beds/Ba | Sqft | Sold | Price | $/sf | Match |
|---|---|---|---|---|---|---|---|
| 53 Crooked Island Cir | 0.11mi | 3/2.0 (+1) | 1,000 (+1%) | 1mo | $67,000 | $67 | 88 |
| 11 Dover St | 0.10mi | 3/1.0 (+1) | 980 (-1%) | 2mo | $28,000 | $29 | 83 |
| 54 Crooked Island Cir | 0.11mi | 3/2.0 (+1) | 920 (-7%) | 1mo | $65,000 | $71 | 77 |
| 29 Oceanside Landing Crooked Island Cir | 0.07mi | 3/2.0 (+1) | 1,064 (+8%) | 4mo | $58,500 | $55 | 76 |
| 67 Crooked Island Cir | 0.17mi | 2/2.0 | 1,100 (+11%) | 0mo | $45,000 | $41 | 73 |
| 1021 S Marlin St | 0.40mi | 2/2.0 | 920 (-7%) | 4mo | $218,000 | $237 | 66 |
| 91 Crooked Island Cir | 0.17mi | 2/2.0 | 1,120 (+13%) | 4mo | $11,500 | $10 | 66 |
| 176 Burr Cir | 0.49mi | 2/2.0 | 980 (-1%) | 14mo | $72,000 | $73 | 64 |
| 173 Braddock Ct | 0.53mi | 2/2.0 | 955 (-4%) | 19mo | $55,000 | $58 | 53 |
| 10 Acorn Ct | 0.37mi | 2/2.0 | 1,130 (+14%) | 8mo | $75,000 | $66 | 53 |
| 147 Ridgeway Loop | 0.45mi | 2/2.0 | 872 (-12%) | 11mo | $72,000 | $83 | 50 |
| 15 Burr Cir | 0.47mi | 2/2.0 | 924 (-7%) | 21mo | $67,000 | $73 | 50 |
Match score weights: distance 35% · size 25% · config 20% · recency 20%. Top-matched comps best support the ARV.
Projected returns pro-forma
-3.0% appreciation · 4.66% rent growth · sell at horizon
- IRR
- 10.4%
- Equity multiple
- 1.42×
- Total profit
- $15,270
- Equity at exit
- $19,369
- IRR
- 20.8%
- Equity multiple
- 2.90×
- Total profit
- $69,162
- Equity at exit
- $11,231
Cash invested: $36,372 (down + closing). Projections, not guarantees.
Landlord ↔ Tenant lean methodology
- Overall (STATE)
- 90 Strongly Landlord-Friendly
- State South Carolina
- 90 Strongly Landlord-Friendly · R+6
- County
- — inherits STATE
- City
- — inherits STATE
ZIP-level market 29576
- Home prices YoY
- -18.8%
- Rents YoY
- 4.7%
- Active inventory
- 287
- Price-to-rent
- 6.0×
Monthly cashflow live
- Estimated rent
- $1,797 medium interval (Pro) →
- Mortgage (P&I)
- −$681
- Tax est. 1.5%
- −$162 /mo · $1,948/yr
- Insurance
- −$54
- HOA
- −$0
- Vacancy / Maint / Mgmt
- −$377
- Net cashflow
- $522
Break-even live
Sensitivity live
| Price | -10% $612 | -5% $567 | +0% $522 | +5% $477 | +10% $432 |
|---|---|---|---|---|---|
| Rent | -10% $380 | -5% $451 | +0% $522 | +5% $593 | +10% $664 |
| Rate | -1.0pp $587 | -0.5pp $555 | base $522 | +0.5pp $488 | +1.0pp $454 |
UW: 25.0% down · 7.5% · 30yr · 1.5% tax · 5.0% vac · 8.0% maint · 8.0% mgmt
Financing live
Cash to close
- Down payment
- $32,475
- Closing costs
- $3,897
- Reserves months
- —
- Total cash needed
- —
Loan-product check · same deal, 3 products live
Conventional
25% down · 7.5% · 30yr
- Down + closing
- —
- Monthly P&I
- —
- Monthly cashflow
- —
- DSCR
- —
- Eligible?
- —
Personal DTI + credit; lowest rate.
DSCR
20% down · 8.5% · 30yr
- Down + closing
- —
- Monthly P&I
- —
- Monthly cashflow
- —
- DSCR
- —
- Eligible?
- —
No personal income docs; deal must DSCR.
Hard money
10% down · 12.0% · 12mo
- Down + closing
- —
- Monthly P&I
- —
- Monthly cashflow
- —
- DSCR
- —
- Eligible?
- —
Short-term bridge; refi at stabilization.
Rent comps 2 comps
| Address | Beds | Baths | Sqft | Rent | $/sqft | DOM | Units | Dist |
|---|---|---|---|---|---|---|---|---|
| 4996 Highway 17 Business Murrells Inlet, SC | 2.0 | 2.0 | 925 | $1,500 | $1.62 | 15d | 1 | 0.48mi |
| 13 Muddy Bay Dr Murrells Inlet, SC | 2.0–3.0 | 2.0 | 1095 | $1,801 | $1.64 | 15d | 13 | 0.84mi |
Listing history 7 events
-
2026-06-07statusdays on market $129,900 Pending 7 DOM
-
2026-06-03days on market $129,900 Active 5 DOM
-
2026-06-02days on market $129,900 Active 4 DOM
-
2026-06-01days on market $129,900 Active 3 DOM
-
2026-05-31days on market $129,900 Active 2 DOM
-
2026-05-30remarks 699-char remark
-
2026-05-30$129,900 Active 1 DOM
ⓘ Source: listings_history table (triggers on properties + properties_extension) + one-shot
backfill from property_details.listing_events for pre-trigger history.
Climate risk First Street
- Flood 1/10 Low FEMA zone X (unshaded) · 0% chance over 30 yrs
- Wildfire 4/10 Moderate
- Heat 9/10 Extreme 7 d/yr ≥106°F today · 18 d/yr by 30 yrs out
- Wind 9/10 Extreme 99% chance of damaging wind over 30 yrs
- Air quality 2/10 Low 0 unhealthy d/yr today · 1 by 30 yrs out
Nearby sold comps map
Loading sold comps map…
Walkable amenities ~0.75 mi
Loading nearby amenities…
Taxation est. · year 1
- Rental income
- $21,564
- − Mortgage interest
- −$7,276
- − Property taxes
- −$1,948
- − Insurance
- −$650
- − Repairs & maintenance
- −$1,725
- − Management
- −$1,725
- − Depreciation
- −$3,779
- Taxable income
- $4,460
- Est. tax owed @ 24.0%
- −$1,071
- After-tax cash flow
- $5,193/yr
For passive investors: Depreciation is non-cash, so a rental often shows a tax loss while cash-flowing — sheltering income. Rental losses are passive: they offset passive income freely, and up to $25,000/yr can offset ordinary (W-2) income if you actively participate and your MAGI is under $100k (phasing out to $0 by $150k); unused losses carry forward. On sale, claimed depreciation is recaptured at up to 25%, and gains may owe capital-gains tax (a 1031 exchange can defer both). Figures are a year-1 estimate at your 24.0% rate — not tax advice; consult a CPA.
Schools (NCES district)
- District
- Georgetown 01
- NCES district ID
- 4502280
- Math proficiency
- 26% ▼ -11.00%
- Reading proficiency
- 38% ▼ -5.00%
- Median HH income
- $43,045
- Composite
- 27.15/100
- National rank
- #7030
- State rank
- #51 of 80 in SC
Livability — Murrells Inlet
- Score
- 76/100
- State rank
- #25
- US rank
- #3720
Category grades
Schools grade is shown separately in the Schools card above.
Census & demographics
- Census place
- Murrells Inlet, SC
- County
- Horry County · 356,152 people
- City population
- 34,695
- Metro
- Myrtle Beach-Conway-North Myrtle Beach, SC-NC
- Population (ZIP)
- 34,695
- Household income
- $70,691
- Rent vs Own
- Severe rent burden
- 309.0
Population outlook (Georgetown County) Hauer SSP2
- Today (2025)
- 63,275 people
- By 2030
- 63,630 · +0.6%
- By 2040
- 63,130 · -0.2%
- By 2050
- 61,904 · -2.2%
- By 2075
- 59,305 · -6.3%
- By 2100
- 53,852 · -14.9%
Race, ethnicity, and origin ACS 2023
- Neighborhood character
- Predominantly White (89%)
- Race & ethnicity
- White 89% Hispanic / Latino 4% Black 3% Two or more races 3% Asian 2%
- Common ancestry
- Romanian 4% Slovak 3% Serbian 2%
- Foreign-born
- 5% · Canada, China, Vietnam
- Languages at home
- 96% English-only · Spanish 2% Chinese 1%
Political lean MEDSL · Georgetown
- 2024 margin
- R (+19.5) · D 39.6% · R 59.1% · Other 1.2%
- 2008→2024 swing
- -14.2pp toward R · 2008: -5.2pp · 2024: -19.5pp
- All cycles
- 2024: R+19.5 2020: R+12.7 2016: R+13.0 2012: R+7.6 2008: R+5.2
Not yet ingested
- Civics
- —
Market trends
- HPI YoY
- ▼ -57.53%
- Current HPI
- 248.5102
- Rent YoY
- ▲ 4.66%
- Metro
- Myrtle Beach-Conway-North Myrtle Beach, SC-NC
- State GDP YoY
- ▲ 4.51%
- F500 in state
- 2
Industry mix (Fortune 500 HQ in SC)
| Industry | F500 HQs | Revenue |
|---|---|---|
| Packaging | 1 | $7B |
|
||
Price history
+233.9% since first listed17 events — show timeline
- 2026-05-29 Listed $129,900 CCAR
- 2025-07-17 Sold (MLS) $113,000 CCAR
- 2025-06-28 Contingent — CCAR
- 2025-06-16 Price Changed $114,500 CCAR
- 2025-06-16 Relisted — CCAR
- 2025-05-31 Contingent — CCAR
- 2025-05-02 Relisted — CCAR
- 2025-04-25 Contingent — CCAR
- 2025-04-16 Price Changed $119,500 CCAR
- 2025-03-04 Price Changed $119,900 CCAR
- 2025-02-12 Listed $120,000 CCAR
- 2024-04-06 Listing Removed — CCAR
- 2024-01-31 Price Changed $79,000 CCAR
- 2023-12-28 Price Changed $85,000 CCAR
- 2023-12-08 Listed $89,999 CCAR
- 2017-08-29 Listing Removed — CCAR
- 2017-05-31 Listed $38,900 CCAR
Cash-flow waterfall
monthlySold comps — $/sqft
last 12 mo · ≤1 miLoading sold comps…