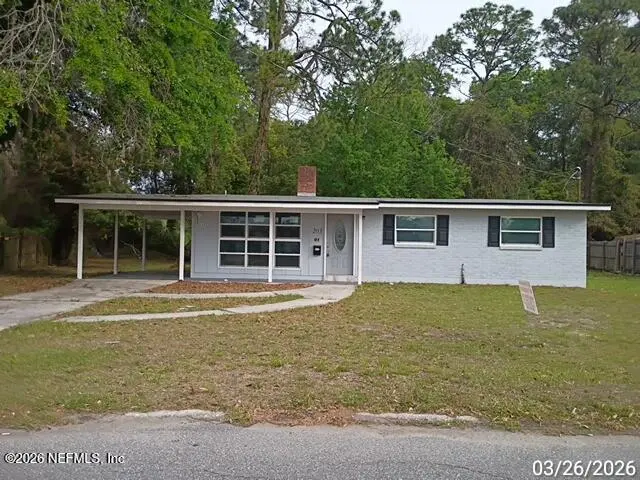
203 Renne Dr N · Jacksonville, FL
Flood risk 1/10 · Minimal
- FEMA flood zone
- X (unshaded)
- Chance of flooding over 30 yrs
- 0.0%
- Est. flood insurance / yr
- $507 – $1,088
Fire risk 6/10 · Moderate
- Est. fire insurance / yr
- $947 – $1,759
Heat risk 9/10 · Severe
- Hot days now (above 106°F)
- 7 days/yr
- Hot days in 30 yrs
- 20 days/yr
Wind risk 9/10 · Severe
- Chance of severe wind over 30 yrs
- 99.0%
Air-quality risk 4/10 · Minor
- Unhealthy air days now
- 6 days/yr
- Unhealthy air days in 30 yrs
- 6 days/yr
Risk factors via First Street. Map © Google.
Why this score? — see what drove the C+ grade
The composite is a weighted blend of 9 inputs, each scored 0–100. Each bar is that input's sub-score; the figure is the points it added to the 100-point composite (weight × sub-score).
- Cash flow +20.3/30.0
- ARV discount +15.0/15.0
- DSCR +6.5/10.0
- 1% rule +6.3/10.0
- Livability +4.2/5.0
- Schools +3.9/10.0
- Condition / age +2.5/5.0
- Rent growth +2.4/5.0
- Appreciation +0.0/10.0
$165,000
🖨 Deal sheet (PDF) 📄 Offer letter ✓ Due diligence
Listing remarks MLS
LOOKING FOR A HOME IN A WELL-ESTABLISHED NEIGHBORHOOD, HERE IT IS. THIS HOME WAS COMPLETELY RENOVATED IN 2022, SO YOU WILL HAVE NO ISSUES WITH HOMEOWNERS INSURANCE. COME AND CHECK IT OUT.
Key facts
- 0.3 acre lot
- Parking
- Built 1962
Property features AI
Finance
- HOA & community: Not a senior community
Exterior
- Parking: Assigned parking; 1-car carport
- Utilities: Electricity available; Sewer available; Water available
- Home design: Single-family residence; One story
- Exterior features: No private pool; 0.3-acre lot
Interior
- Kitchen: Electric oven; Refrigerator
- Bedrooms: 3 bedrooms
- Flooring: Vinyl
- Bathrooms: 1 full bathroom; 1 half bathroom
- Heating & cooling: Electric heating; Central air conditioning
- Interior features: Vinyl flooring
Neighborhood map
What this means for you Summary
Snapshot
- This is a 3-bed/2.0-bath single-family listed at $165k.
Deal economics
- At list price, monthly cash flow is $212 ($3k/yr) — positive.
- The deal already cash-flows at list — no discount required.
- Meets the 1% rule at list price ($2k rent vs $165k).
- Recommended offer: $160k (3.0% below list) — sets the bar for market timing.
- Cap rate 7.8% vs local median 3.9% in Jacksonville — top-decile yield for the area; either an underpriced asset or a hidden risk that comps aren't pricing in. Stress-test before assuming the spread holds.
Location & tenants
- Location reads 83/100 on livability (#50 in FL, #911 nationally) — a professional / high-income tenant draw. Strengths: amenities A+, commute A+, housing A+.
- Duval (urban): math 46% / reading 45% proficiency, ranked #48 of 73 in FL (top 66%) — families likely to look elsewhere, expect single-tenant / working-renter base with shorter leases.
- Zoned schools: San Mateo Elementary School (math 67% / reading 63%, grade B+, #514 of 2,144 statewide, top 24%, 534 students, 48% FRL); Oceanway School (math 34% / reading 33%, grade F, #428 of 571 statewide, top 76%, 927 students, 51% FRL); First Coast High School (math 18% / reading 33%, grade F, #499 of 667 statewide, top 75%, 2,117 students, 49% FRL) — zoned schools at 49% FRL track the district average.
- Market conditions: Rents soft (-0.4%/yr); 735 active listings in the ZIP; 7 comparable units currently listed for rent nearby; rentals at typical pace (median 16d on market — plan ~3-4 weeks tenant-placement turnaround); 6,503 units permitted in Duval County in 2024 (1,131 in 5+ unit buildings).
- This rent runs 32% of the median local income ($70k/yr) — at the standard rent-burdened threshold; future hikes will face affordability resistance.
Forward outlook
- Local home prices are declining (-3.0%/yr); year-one equity from $1k of loan paydown is wiped out by about $5k of value loss. Plan a longer hold.
- Duval County population projected at +19% by 2050 — long-run rental-demand tailwind backs the buy-and-hold thesis.
Negotiation context
- It's been on market 49 days — a 3% lower offer ($160k) is reasonable based on typical stale-listing flexibility.
- 5 sale attempts since 5y ago; this cycle's ask has dropped $20k (11%) from the opening price — seller is motivated, your offer sets the floor, not the list.
Risks & watch-outs
- Climate carrying-cost: severe wind risk, 99% chance of damaging wind over 30y; major wildfire risk; extreme-heat days projected 7→20/yr by 2055 (HVAC capex compounding) — expect insurance premiums to compound above CPI over the hold.
Questions for the listing agent
- It's been on market 49 days. Have you received any prior offers? Is the seller open to a 3% concession, seller financing, or rate buy-down credit?
- Built in 1962 — when were the roof, HVAC, electrical panel, plumbing, and water heater last replaced?
- Is there a deadline driving the sale (1031 exchange, divorce, estate, relocation)? That informs how much negotiation room exists.
- Schools are B-rated — typically a magnet for longer-tenancy family renters. What's the average tenant stay here, and is there a school-zone premium baked into asking?
- What's the average days-on-market for RENTAL listings here right now (not sales)? A rising rental-DOM trend means longer vacancies and softer asking-rent achievability than the comps imply.
- What's the recent tenant-quality profile in this submarket — average credit score on applications, eviction rate, late-payment / NSF rate, and stable-employment percentage? A property-management company in the area should have these aggregated.
- How much new for-sale + rental construction is in the pipeline within 1–3 miles? Heavy new supply typically softens prices + rents 12–24 months out; constrained supply supports both.
Investment metrics
- 1% rule
- 1.13% ✓
- Cap rate
- 7.84%
- Cash-on-cash
- 5.51%
- DSCR
- 1.25
- GRM
- 7.4
CMA / ARV
- ARV (on-the-fly)
- $226,044
- Comps found
- 12
Show comp detail 12 sales within ~0.75 mi
| Address | Dist | Beds/Ba | Sqft | Sold | Price | $/sf | Match |
|---|---|---|---|---|---|---|---|
| 11515 Soforenko Dr | 0.33mi | 3/2.0 | 1,100 (+1%) | 1mo | $234,900 | $214 | 83 |
| 273 Claudia Dr | 0.33mi | 3/2.0 | 1,092 (0%) | 10mo | $216,000 | $198 | 76 |
| 231 Renne Dr N | 0.06mi | 3/1.5 | 1,168 (+7%) | 20mo | $205,000 | $176 | 67 |
| 11220 Soforenko Dr | 0.50mi | 3/1.5 | 1,040 (-5%) | 1mo | $217,000 | $209 | 66 |
| 11441 Elane Dr | 0.30mi | 3/2.0 | 1,202 (+10%) | 12mo | $210,000 | $175 | 59 |
| 11427 Harlan Dr | 0.46mi | 3/2.0 | 1,040 (-5%) | 14mo | $225,000 | $216 | 59 |
| 11515 Vera Dr | 0.38mi | 3/1.5 | 1,134 (+4%) | 20mo | $235,000 | $207 | 57 |
| 11253 Samuel Dr | 0.42mi | 3/1.5 | 1,183 (+8%) | 10mo | $220,000 | $186 | 56 |
| 11258 Soforenko Dr | 0.44mi | 3/1.5 | 1,172 (+7%) | 16mo | $224,900 | $192 | 52 |
| 11278 Princessa Ln | 0.64mi | 3/1.5 | 1,160 (+6%) | 12mo | $245,000 | $211 | 48 |
| 313 Suzanne Dr | 0.50mi | 3/2.0 | 1,222 (+12%) | 13mo | $155,000 | $127 | 46 |
| 11337 Renne Dr E | 0.73mi | 3/2.0 | 1,010 (-8%) | 20mo | $235,000 | $233 | 37 |
Match score weights: distance 35% · size 25% · config 20% · recency 20%. Top-matched comps best support the ARV.
Projected returns pro-forma
-3.0% appreciation · 0.0% rent growth · sell at horizon
- IRR
- -11.5%
- Equity multiple
- 0.60×
- Total profit
- $-18,598
- Equity at exit
- $24,602
- IRR
- -7.9%
- Equity multiple
- 0.58×
- Total profit
- $-19,544
- Equity at exit
- $14,266
Cash invested: $46,200 (down + closing). Projections, not guarantees.
Landlord ↔ Tenant lean methodology
- Overall (STATE)
- 87 Strongly Landlord-Friendly
- State Florida
- 87 Strongly Landlord-Friendly · R+3
- County
- — inherits STATE
- City
- — inherits STATE
ZIP-level market 32218
- Home prices YoY
- -25.7%
- Rents YoY
- -0.4%
- Active inventory
- 735
- Price-to-rent
- 7.4×
Monthly cashflow live
- Estimated rent
- $1,870 high interval (Pro) →
- Mortgage (P&I)
- −$865
- Tax from tax record
- −$331 /mo · $3,970/yr
- Insurance
- −$69
- HOA
- −$0
- Vacancy / Maint / Mgmt
- −$393
- Net cashflow
- $212
Break-even live
Sensitivity live
| Price | -10% $306 | -5% $259 | +0% $212 | +5% $165 | +10% $119 |
|---|---|---|---|---|---|
| Rent | -10% $64 | -5% $138 | +0% $212 | +5% $286 | +10% $360 |
| Rate | -1.0pp $295 | -0.5pp $254 | base $212 | +0.5pp $169 | +1.0pp $126 |
UW: 25.0% down · 7.5% · 30yr · 1.5% tax · 5.0% vac · 8.0% maint · 8.0% mgmt
Financing live
Cash to close
- Down payment
- $41,250
- Closing costs
- $4,950
- Reserves months
- —
- Total cash needed
- —
Loan-product check · same deal, 3 products live
Conventional
25% down · 7.5% · 30yr
- Down + closing
- —
- Monthly P&I
- —
- Monthly cashflow
- —
- DSCR
- —
- Eligible?
- —
Personal DTI + credit; lowest rate.
DSCR
20% down · 8.5% · 30yr
- Down + closing
- —
- Monthly P&I
- —
- Monthly cashflow
- —
- DSCR
- —
- Eligible?
- —
No personal income docs; deal must DSCR.
Hard money
10% down · 12.0% · 12mo
- Down + closing
- —
- Monthly P&I
- —
- Monthly cashflow
- —
- DSCR
- —
- Eligible?
- —
Short-term bridge; refi at stabilization.
Rent comps 7 comps
| Address | Beds | Baths | Sqft | Rent | $/sqft | DOM | Units | Dist |
|---|---|---|---|---|---|---|---|---|
| 11833 N Main St Jacksonville, FL | 2.0 | 2.0 | 1170 | $1,495 | $1.28 | 4d | 4 | 0.37mi |
| 11701 Palm Lake Dr Jacksonville, FL | 1.0–3.0 | 1.0–2.0 | 999 | $1,957 | $1.96 | 3d | 80 | 0.42mi |
| 11267 Bruce Dr Jacksonville, FL | 3.0 | 1.5 | 1120 | $1,725 | $1.54 | 16d | 1 | 0.46mi |
| 745 Northpoint Cir N Jacksonville, FL | 2.0 | 2.0 | 897 | $1,600 | $1.78 | 25d | 1 | 1.22mi |
| 556 Worcester Ct Jacksonville, FL | 3.0 | 2.0 | 1500 | $2,000 | $1.33 | 25d | 1 | 1.38mi |
| 11011 Harts Rd Jacksonville, FL | 1.0–3.0 | 1.0–2.0 | 1052 | $1,742 | $1.66 | 3d | 23 | 1.41mi |
| 950 Turtle Creek Dr S Jacksonville, FL | 3.0 | 2.0 | 1460 | $1,824 | $1.25 | 25d | 1 | 1.50mi |
Listing history 14 events
-
2026-05-19status Pending
-
2026-05-12price $165,000
-
2026-03-31$185,000 Active
-
2025-12-03$5,000 Active
-
2025-03-04historical 187-char remark
Show marketing remark (187 chars)
LOOKING FOR A HOME IN A WELL-ESTABLISHED NEIGHBORHOOD, HERE IT IS. THIS HOME WAS COMPLETELY RENOVATED IN 2022, SO YOU WILL HAVE NO ISSUES WITH HOMEOWNERS INSURANCE. COME AND CHECK IT OUT.
-
2024-09-23$249,000 Active 187-char remark
Show marketing remark (187 chars)
LOOKING FOR A HOME IN A WELL-ESTABLISHED NEIGHBORHOOD, HERE IT IS. THIS HOME WAS COMPLETELY RENOVATED IN 2022, SO YOU WILL HAVE NO ISSUES WITH HOMEOWNERS INSURANCE. COME AND CHECK IT OUT.
-
2022-03-17soldstatus $230,000
-
2022-02-09soldstatus $230,000 Sold
-
2022-01-07status Pending
-
2022-01-01status Active
-
2021-12-30status Pending
-
2021-12-28$230,000 Active
-
2021-07-13soldstatus $58,000
-
1975-06-13soldstatus $26,500
ⓘ Source: listings_history table (triggers on properties + properties_extension) + one-shot
backfill from property_details.listing_events for pre-trigger history.
Tax reassessment forecast FL · Resets to sale price
- Current annual tax
- $3,970 · $331/mo
- Projected year-2 tax
- $3,970 · $331/mo
- Expected delta
- $0/yr ($0/mo · 0.0%)
ⓘ Screening estimate from a state-policy table — verify with the county assessor before closing.
Climate risk First Street
- Flood 1/10 Low FEMA zone X (unshaded) · 0% chance over 30 yrs
- Wildfire 6/10 Major
- Heat 9/10 Extreme 7 d/yr ≥106°F today · 20 d/yr by 30 yrs out
- Wind 9/10 Extreme 99% chance of damaging wind over 30 yrs
- Air quality 4/10 Moderate 6 unhealthy d/yr today · 6 by 30 yrs out
Nearby sold comps map
Loading sold comps map…
Walkable amenities ~0.75 mi
Loading nearby amenities…
Taxation est. · year 1
- Rental income
- $22,436
- − Mortgage interest
- −$9,243
- − Property taxes
- −$3,970
- − Insurance
- −$825
- − Repairs & maintenance
- −$1,795
- − Management
- −$1,795
- − Depreciation
- −$4,800
- Taxable income
- $9
- Est. tax owed @ 24.0%
- −$2
- After-tax cash flow
- $2,544/yr
For passive investors: Depreciation is non-cash, so a rental often shows a tax loss while cash-flowing — sheltering income. Rental losses are passive: they offset passive income freely, and up to $25,000/yr can offset ordinary (W-2) income if you actively participate and your MAGI is under $100k (phasing out to $0 by $150k); unused losses carry forward. On sale, claimed depreciation is recaptured at up to 25%, and gains may owe capital-gains tax (a 1031 exchange can defer both). Figures are a year-1 estimate at your 24.0% rate — not tax advice; consult a CPA.
Schools (NCES district)
- District
- Duval
- NCES district ID
- 1200480
- Math proficiency
- 46% ▼ -11.00%
- Reading proficiency
- 45% ▼ -4.00%
- Median HH income
- $48,987
- Composite
- 38.97/100
- National rank
- #4076
- State rank
- #48 of 73 in FL
Livability — Jacksonville
- Score
- 83/100
- State rank
- #50
- US rank
- #911
Category grades
Schools grade is shown separately in the Schools card above.
Census & demographics
- Census place
- Jacksonville, FL
- County
- Duval County · 1,015,274 people
- City population
- 979,034
- Metro
- Jacksonville, FL
- Population (ZIP)
- 72,905
- Household income
- $69,638
- Rent vs Own
- Severe rent burden
- 2289.0
Population outlook (Duval County) Hauer SSP2
- Today (2025)
- 1,013,010 people
- By 2030
- 1,059,228 · +4.6%
- By 2040
- 1,141,439 · +12.7%
- By 2050
- 1,205,258 · +19.0%
- By 2075
- 1,324,282 · +30.7%
- By 2100
- 1,319,620 · +30.3%
Race, ethnicity, and origin ACS 2023
- Neighborhood character
- Diverse neighborhood (Simpson 0.64)
- Race & ethnicity
- Black 48% White 35% Hispanic / Latino 9% Two or more races 8% Asian 2%
- Hispanic origin (detail)
- Mexican 2% Puerto Rican 4%
- Common ancestry
- Slovak 1% Lithuanian 1% Italian 1%
- Foreign-born
- 6% · Canada, Jamaica, Vietnam
- Languages at home
- 89% English-only · Spanish 6% French/Haitian/Cajun 1% Tagalog/Filipino 1%
Political lean MEDSL · Duval
- 2024 margin
- Toss-up / Even · D 48.7% · R 50.1% · Other 1.2%
- 2008→2024 swing
- +0.4pp no change · 2008: -1.9pp · 2024: -1.5pp
- All cycles
- 2024: R+1.5 2020: D+3.8 2016: R+1.5 2012: R+3.6 2008: R+1.9
Not yet ingested
- Civics
- —
Market trends
- HPI YoY
- ▼ -90.73%
- Current HPI
- 262.2329
- Rent YoY
- ▼ -0.40%
- Metro
- Jacksonville, FL
- State GDP YoY
- ▲ 3.28%
- F500 in state
- 36
Industry mix (Fortune 500 HQ in FL)
| Industry | F500 HQs | Revenue |
|---|---|---|
| Industrial Technology | 2 | $29B |
|
||
| Insurance | 2 | $17B |
|
||
| Retail | 1 | $60B |
|
||
| Technology Distribution | 1 | $58B |
|
||
| Homebuilding | 1 | $35B |
|
||
| Technology Manufacturing | 1 | $35B |
|
||
Price history
+522.6% since first listed14 events — show timeline
- 2026-05-19 Pending — realMLS
- 2026-05-12 Price Changed $165,000 realMLS
- 2026-03-31 Listed $185,000 realMLS
- 2025-12-03 Listed $5,000 NFMLS
- 2025-03-04 Listing Removed — realMLS
- 2024-09-23 Listed $249,000 realMLS
- 2022-03-17 Sold (Public Records) $230,000 Public Records
- 2022-02-09 Sold (MLS) $230,000 realMLS
- 2022-01-07 Pending — realMLS
- 2022-01-01 Relisted — realMLS
- 2021-12-30 Pending — realMLS
- 2021-12-28 Listed $230,000 realMLS
- 2021-07-13 Sold (Public Records) $58,000 Public Records
- 1975-06-13 Sold (Public Records) $26,500 Public Records
Property tax history
+16.0%/yrLatest (2025): $3,970 · +8.5% YoY. Source: county tax records.
Cash-flow waterfall
monthlySold comps — $/sqft
last 12 mo · ≤1 miLoading sold comps…