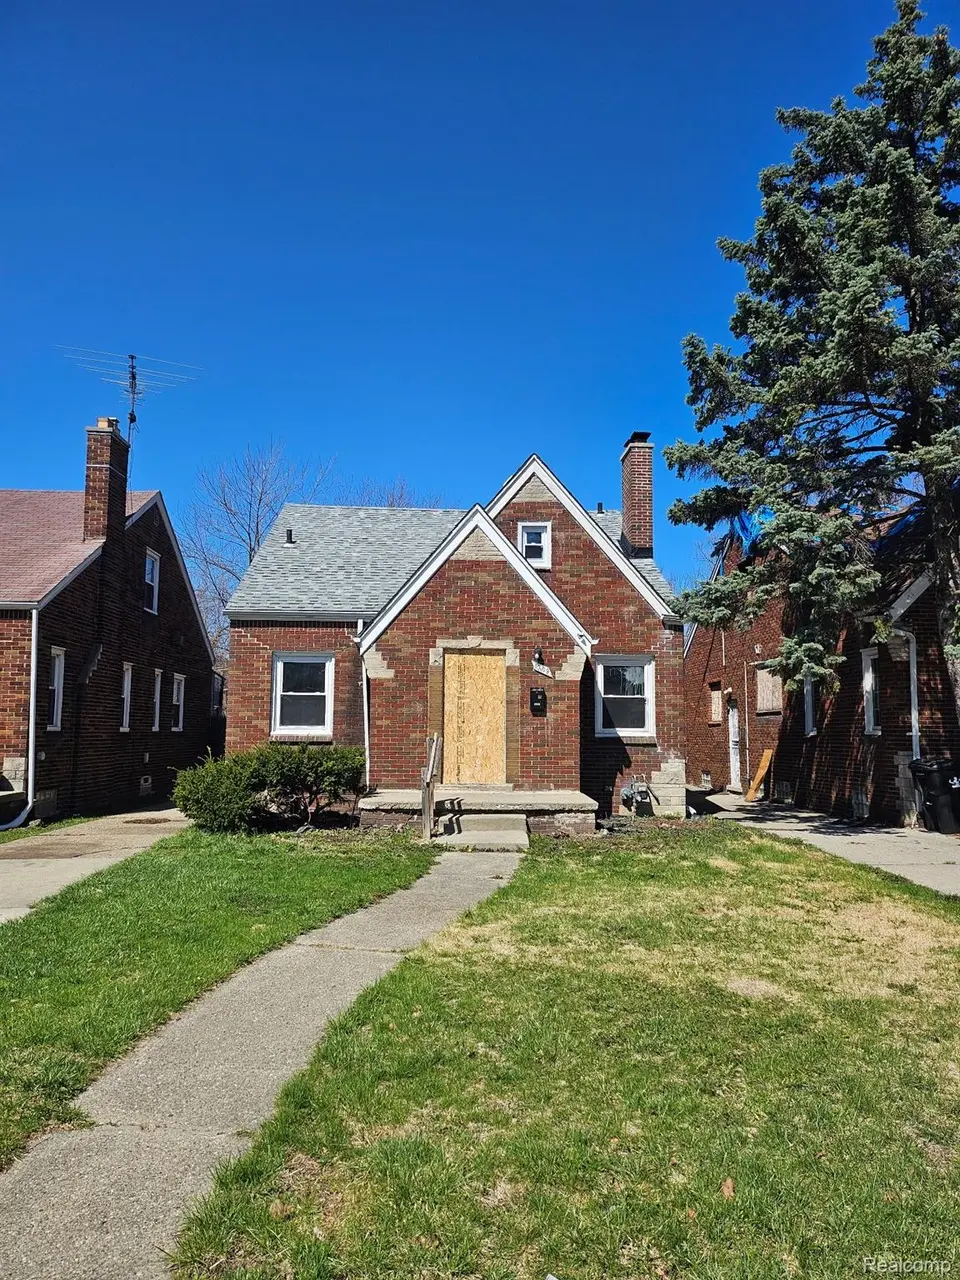
10109 Mckinney St · Detroit, MI
Flood risk 1/10 · Minimal
- FEMA flood zone
- X (unshaded)
- Chance of flooding over 30 yrs
- 0.0%
- Est. flood insurance / yr
- $473 – $860
Fire risk 1/10 · Minimal
- Est. fire insurance / yr
- $784 – $1,456
Heat risk 3/10 · Minor
- Hot days now (above 95°F)
- 7 days/yr
- Hot days in 30 yrs
- 15 days/yr
Wind risk 2/10 · Minimal
- Chance of severe wind over 30 yrs
- —
Air-quality risk 3/10 · Minor
- Unhealthy air days now
- 3 days/yr
- Unhealthy air days in 30 yrs
- 4 days/yr
Risk factors via First Street. Map © Google.
Why this score? — see what drove the B- grade
The composite is a weighted blend of 9 inputs, each scored 0–100. Each bar is that input's sub-score; the figure is the points it added to the 100-point composite (weight × sub-score).
- Cash flow +30.0/30.0
- 1% rule +10.0/10.0
- DSCR +10.0/10.0
- ARV discount +7.4/15.0
- Livability +3.7/5.0
- Rent growth +2.7/5.0
- Condition / age +2.5/5.0
- Schools +1.3/10.0
- Appreciation +0.0/10.0
$84,900
🖨 Deal sheet (PDF) 📄 Offer letter ✓ Due diligence
Listing remarks MLS
A charming single family residence awaits its discerning owner at 10109 McKinney ST, Detroit, MI, USA, presenting itself as an inviting home, ready for immediate enjoyment. The heart of this dwelling, the living room, offers a comforting ambiance, centered around a welcoming fireplace that promises cozy evenings. Overhead, elegant crown molding adds a refined touch, enhancing the room's character and creating a sophisticated atmosphere for relaxation. Culinary inspirations come to life within the kitchen, thoughtfully designed with stylish shaker cabinets that provide ample storage. A tasteful backsplash complements the design, creating a polished and functional space for preparing meals. Further enhancing the appeal of this 1939 single family residence are three comfortable bedrooms and a well-appointed bathroom, providing practical living arrangements. A bright sunroom extends the interior living space, inviting natural light and offering a peaceful sanctuary. Outside, the property boasts a private, fenced backyard, perfect for outdoor enjoyment, and a convenient shed for additional utility, all nestled within a desirable residential area. This inviting home offers a harmonious blend of classic appeal and contemporary comfort, poised to provide a delightful living experience.
Key facts
- Welcoming fireplace
- Tasteful backsplash
- Bright sunroom
Tags
Neighborhood map
What this means for you Summary
Snapshot
- This is a 3-bed/1.0-bath single-family listed at $85k.
Deal economics
- At list price, monthly cash flow is $390 ($5k/yr) — positive.
- The deal already cash-flows at list — no discount required.
- Meets the 1% rule at list price ($1k rent vs $85k).
- Recommended offer: $75k (12.0% below list) — sets the bar for market timing.
Location & tenants
- Location reads 73/100 on livability (#218 in MI) — a middle-class / working-renter tenant base. Strengths: amenities A+, commute A+, cost of living A+; Watch: schools F, crime F, employment F.
- Detroit Public Schools Community District (urban): math 10% / reading 24% proficiency, ranked #499 of 540 in MI (top 92%) — low school quality limits family demand, transient renter base, plan for 1-2y turnover; 90% free/reduced lunch — lower-income household profile, screen leases tightly.
- Market conditions: Rents flat; 492 active listings in the ZIP; 40 comparable units currently listed for rent nearby; rentals at typical pace (median 19d on market — plan ~3-4 weeks tenant-placement turnaround); 45% of comp listings sitting > 30 days — soft ceiling on asking rent; lower-income renter base — watch delinquency; 2,639 units permitted in Wayne County in 2024 (1,216 in 5+ unit buildings).
- This rent runs 36% of the median local income ($45k/yr) — at the standard rent-burdened threshold; future hikes will face affordability resistance.
Forward outlook
- Local home prices are declining (-3.0%/yr); year-one equity from $587 of loan paydown is wiped out by about $3k of value loss. Plan a longer hold.
- Wayne County population projected at -17% by 2050 — secular population decline; favor cash flow + early exit over multi-decade hold.
- At projected returns (-3.0% appreciation + 0.7% rent growth), your $24k cash investment doubles in ~8 years — after that, you're playing with house money.
Negotiation context
- It's been on market 130 days — a 12% lower offer ($75k) is reasonable based on typical stale-listing flexibility.
- 7 sale attempts since 28y ago with the ask held roughly flat each time — persistent listings suggest the price (not the market) is what's stuck; bring a comps-based counter.
- Current owner paid $50k; list at $85k implies a 70% gain — meaningful room to come down on a strong offer.
Risks & watch-outs
- Watch-outs: property tax is 2.7% of price; built in 1939 — expect roof / HVAC / electrical / plumbing capex.
Questions for the listing agent
- It's been on market 130 days. Have you received any prior offers? Is the seller open to a 12% concession, seller financing, or rate buy-down credit?
- Built in 1939 — when were the roof, HVAC, electrical panel, plumbing, and water heater last replaced?
- Property tax is high relative to price — has the assessment been appealed recently, and will the sale trigger a re-assessment?
- Why hasn't it sold? Are there any deal-killer items the seller is aware of (foundation, flood, title, zoning, code violations)?
- Is there a deadline driving the sale (1031 exchange, divorce, estate, relocation)? That informs how much negotiation room exists.
- Schools are F-rated, which usually means shorter tenancies and higher turnover. Who's the typical renter profile here, and what's been the actual vacancy rate?
- Crime grade is F in this area — have there been break-ins, vandalism, or insurance claims at this property in the last 3 years? What carrier currently insures it and at what premium?
- What's the average days-on-market for RENTAL listings here right now (not sales)? A rising rental-DOM trend means longer vacancies and softer asking-rent achievability than the comps imply.
- What's the recent tenant-quality profile in this submarket — average credit score on applications, eviction rate, late-payment / NSF rate, and stable-employment percentage? A property-management company in the area should have these aggregated.
- How much new for-sale + rental construction is in the pipeline within 1–3 miles? Heavy new supply typically softens prices + rents 12–24 months out; constrained supply supports both.
Investment metrics
- 1% rule
- 1.59% ✓
- Cap rate
- 11.81%
- Cash-on-cash
- 19.70%
- DSCR
- 1.88
- GRM
- 5.3
CMA / ARV
- ARV (median comp)
- $84,802
- List price
- $84,900
- Delta
- 0.12%
- Verdict
- FAIR
- Comps
- 20 within 1.0 mi
Show comp detail 12 sales within ~0.75 mi
| Address | Dist | Beds/Ba | Sqft | Sold | Price | $/sf | Match |
|---|---|---|---|---|---|---|---|
| 10319 Mckinney St | 0.13mi | 4/1.0 (+1) | 990 (+5%) | 1mo | $25,000 | $25 | 80 |
| 10058 Greensboro St | 0.54mi | 3/1.0 | 928 (-2%) | 3mo | $40,000 | $43 | 70 |
| 10326 Beaconsfield St | 0.29mi | 3/1.0 | 1,042 (+10%) | 3mo | $66,000 | $63 | 67 |
| 11475 Lakepointe St | 0.55mi | 2/1.0 (-1) | 953 (+1%) | 3mo | $95,000 | $100 | 65 |
| 6106 Oldtown St | 0.65mi | 3/1.5 | 961 (+2%) | 1mo | $132,000 | $137 | 64 |
| 10670 Nottingham Rd | 0.20mi | 2/1.0 (-1) | 827 (-12%) | 5mo | $35,000 | $42 | 61 |
| 11545 Roxbury St | 0.64mi | 3/1.0 | 1,003 (+6%) | 1mo | $65,000 | $65 | 59 |
| 10696 Stratman St | 0.59mi | 3/1.5 | 1,000 (+6%) | 3mo | $53,000 | $53 | 58 |
| 10830 Mckinney St | 0.43mi | 3/1.0 | 1,066 (+13%) | 1mo | $40,199 | $38 | 57 |
| 11490 Somerset Ave | 0.75mi | 3/1.0 | 915 (-3%) | 4mo | $70,000 | $77 | 56 |
| 5921 Audubon Rd | 0.48mi | 3/1.0 | 1,039 (+10%) | 6mo | $190,000 | $183 | 56 |
| 11203 Stockwell St | 0.70mi | 3/1.0 | 1,012 (+7%) | 5mo | $107,500 | $106 | 51 |
Match score weights: distance 35% · size 25% · config 20% · recency 20%. Top-matched comps best support the ARV.
Projected returns pro-forma
-3.0% appreciation · 0.73% rent growth · sell at horizon
- IRR
- 9.0%
- Equity multiple
- 1.34×
- Total profit
- $8,160
- Equity at exit
- $12,659
- IRR
- 16.0%
- Equity multiple
- 2.16×
- Total profit
- $27,618
- Equity at exit
- $7,341
Cash invested: $23,772 (down + closing). Projections, not guarantees.
Landlord ↔ Tenant lean methodology
- Overall (STATE)
- 62 Landlord-Friendly
- State Michigan
- 62 Landlord-Friendly · EVEN
- County
- — inherits STATE
- City
- — inherits STATE
ZIP-level market 48224
- Rents YoY
- 0.7%
- Active inventory
- 492
- Price-to-rent
- 5.3×
Monthly cashflow live
- Estimated rent
- $1,346 high interval (Pro) →
- Mortgage (P&I)
- −$445
- Tax from tax record
- −$192 /mo · $2,308/yr
- Insurance
- −$35
- HOA
- −$0
- Vacancy / Maint / Mgmt
- −$283
- Net cashflow
- $390
Break-even live
Sensitivity live
| Price | -10% $438 | -5% $414 | +0% $390 | +5% $366 | +10% $342 |
|---|---|---|---|---|---|
| Rent | -10% $284 | -5% $337 | +0% $390 | +5% $443 | +10% $496 |
| Rate | -1.0pp $433 | -0.5pp $412 | base $390 | +0.5pp $368 | +1.0pp $346 |
UW: 25.0% down · 7.5% · 30yr · 1.5% tax · 5.0% vac · 8.0% maint · 8.0% mgmt
Financing live
Cash to close
- Down payment
- $21,225
- Closing costs
- $2,547
- Reserves months
- —
- Total cash needed
- —
Loan-product check · same deal, 3 products live
Conventional
25% down · 7.5% · 30yr
- Down + closing
- —
- Monthly P&I
- —
- Monthly cashflow
- —
- DSCR
- —
- Eligible?
- —
Personal DTI + credit; lowest rate.
DSCR
20% down · 8.5% · 30yr
- Down + closing
- —
- Monthly P&I
- —
- Monthly cashflow
- —
- DSCR
- —
- Eligible?
- —
No personal income docs; deal must DSCR.
Hard money
10% down · 12.0% · 12mo
- Down + closing
- —
- Monthly P&I
- —
- Monthly cashflow
- —
- DSCR
- —
- Eligible?
- —
Short-term bridge; refi at stabilization.
Rent comps 40 comps
| Address | Beds | Baths | Sqft | Rent | $/sqft | DOM | Units | Dist |
|---|---|---|---|---|---|---|---|---|
| 10404 Somerset Ave Detroit, MI | 3.0 | 1.0 | 1108 | $1,475 | $1.33 | 4d | 1 | 0.10mi |
| 10037 Grayton St Detroit, MI | 3.0 | 1.0 | 1000 | $1,400 | $1.40 | 4d | 1 | 0.22mi |
| 10177 Boleyn St Detroit, MI | 3.0 | 1.0 | 767 | $1,250 | $1.63 | 44d | 1 | 0.25mi |
| 10400 Britain St Detroit, MI | 3.0 | 1.0 | 890 | $1,100 | $1.24 | 44d | 1 | 0.39mi |
| 10370 Britain St Detroit, MI | 3.0 | 1.0 | 1100 | $1,100 | $1.00 | 44d | 1 | 0.39mi |
| 11235 Roxbury St Detroit, MI | 3.0 | 1.0 | 1062 | $1,325 | $1.25 | 18d | 1 | 0.44mi |
| 9747 Somerset Ave Detroit, MI | 2.0 | 1.0 | 797 | $1,100 | $1.38 | 44d | 1 | 0.48mi |
| 10692 Meuse St Detroit, MI | 3.0 | 1.0 | 955 | $1,250 | $1.31 | 13d | 1 | 0.50mi |
| 9927 Beaconsfield St Detroit, MI | 3.0 | 1.0 | 942 | $1,375 | $1.46 | 15d | 1 | 0.53mi |
| 10141 Roxbury St Detroit, MI | 3.0 | 1.0 | 1115 | $1,000 | $0.90 | 44d | 1 | 0.57mi |
| 5783 Yorkshire Rd Detroit, MI | 2.0 | 1.0 | 1040 | $1,200 | $1.15 | 44d | 1 | 0.58mi |
| 10644 Stratman St Detroit, MI | 2.0 | 1.0 | 1000 | $1,200 | $1.20 | 18d | 1 | 0.60mi |
| 11611 Morang Ave Detroit, MI | 1.0–2.0 | 1.0 | 709 | $1,040 | $1.47 | 44d | 1 | 0.64mi |
| 11529 Roxbury St Detroit, MI | 2.0 | 1.0 | 720 | $1,200 | $1.67 | 13d | 1 | 0.65mi |
| 6304 Bluehill St Detroit, MI | 3.0 | 1.0 | 1088 | $1,500 | $1.38 | 44d | 1 | 0.65mi |
| 11776 Rossiter St Detroit, MI | 3.0 | 1.0 | 964 | $1,150 | $1.19 | 12d | 1 | 0.74mi |
| 9516 Wayburn St Detroit, MI | 2.0 | 1.0 | 800 | $950 | $1.19 | 18d | 1 | 0.74mi |
| 5955 Guilford St Detroit, MI | 3.0 | 1.0 | 802 | $1,400 | $1.75 | 18d | 1 | 0.77mi |
| 6325 Neff Ave Detroit, MI | 3.0 | 1.0 | 1000 | $1,500 | $1.50 | 3d | 1 | 0.78mi |
| 6181 Neff Ave Detroit, MI | 3.0 | 1.0 | 1102 | $1,299 | $1.18 | 18d | 1 | 0.80mi |
| 10542 Lanark St Detroit, MI | 3.0 | 1.0 | 1023 | $1,250 | $1.22 | 44d | 1 | 0.80mi |
| 5284 Devonshire Rd Detroit, MI | 2.0 | 1.0 | 650 | $1,050 | $1.62 | 25d | 1 | 0.81mi |
| 5751 Nottingham Rd Unit 5/21/26 Detroit, MI | 3.0 | 1.0 | 1100 | $1,250 | $1.14 | 15d | 1 | 0.84mi |
| 12201 Morang Ave Unit 8 Detroit, MI | 2.0 | 1.0 | 610 | $875 | $1.43 | 44d | 1 | 0.85mi |
| 10985 Peerless St Detroit, MI | 3.0 | 1.0 | 1000 | $1,364 | $1.36 | 5d | 1 | 0.86mi |
| 5112 Haverhill St Unit 1 Detroit, MI | 2.0 | 1.0 | 1000 | $1,100 | $1.10 | 44d | 1 | 0.92mi |
| 5235 Chatsworth St Detroit, MI | 2.0 | 1.0 | 900 | $1,050 | $1.17 | 44d | 1 | 0.94mi |
| 17710 Chester St Detroit, MI | 2.0 | 1.0 | 984 | $1,250 | $1.27 | 44d | 1 | 0.94mi |
| 5786 Neff Ave Detroit, MI | 3.0 | 1.5 | 1100 | $1,225 | $1.11 | 17d | 1 | 0.94mi |
| 12075 Rossiter St Detroit, MI | 3.0 | 1.0 | 1100 | $1,245 | $1.13 | 44d | 1 | 0.95mi |
| 17720 Chester St Detroit, MI | 2.0 | 1.0 | 986 | $1,250 | $1.27 | 44d | 1 | 0.95mi |
| 12075 Rossiter St Detroit, MI | 3.0 | 1.0 | 1100 | $1,245 | $1.13 | 15d | 1 | 0.95mi |
| 5031 Bedford St Detroit, MI | 2.0 | 1.0 | 876 | $1,870 | $2.13 | 0d | 1 | 0.97mi |
| 5028 Bedford St Detroit, MI | 3.0 | 1.0 | 1000 | $1,400 | $1.40 | 5d | 1 | 0.98mi |
| 6175 Marseilles St Detroit, MI | 3.0 | 1.0 | 1100 | $1,100 | $1.00 | 44d | 1 | 1.00mi |
| 19639 Moross Rd Unit 1 Detroit, MI | 2.0 | 1.0 | 900 | $1,100 | $1.22 | 44d | 1 | 1.01mi |
| 19982 McCormick St Detroit, MI | 3.0 | 1.0 | 866 | $1,200 | $1.39 | 4d | 1 | 1.02mi |
| 6301 Lodewyck St Detroit, MI | 3.0 | 1.0 | 1084 | $1,300 | $1.20 | 13d | 1 | 1.04mi |
| 19144 Moross Rd Detroit, MI | 2.0 | 1.0 | 900 | $1,050 | $1.17 | 44d | 1 | 1.06mi |
| 9190 Hayes St Unit 1 Detroit, MI | 2.0 | 1.0 | 750 | $850 | $1.13 | 15d | 1 | 1.07mi |
Listing history 39 events
-
2026-06-21days on market $84,900 Active 130 DOM
-
2026-06-18days on market $84,900 Active 127 DOM
-
2026-06-17days on market $84,900 Active 126 DOM
-
2026-06-15days on market $84,900 Active 124 DOM
-
2026-06-13days on market $84,900 Active 122 DOM
-
2026-06-13days on market $84,900 Active 121 DOM
-
2026-06-09days on market $84,900 Active 118 DOM
-
2026-06-08days on market $84,900 Active 117 DOM
-
2026-06-07days on market $84,900 Active 116 DOM
-
2026-06-04days on market $84,900 Active 113 DOM
-
2026-06-03days on market $84,900 Active 112 DOM
-
2026-06-01days on market $84,900 Active 110 DOM
-
2026-05-31days on market $84,900 Active 109 DOM
-
2026-02-10$84,900 Active 1298-char remark
Show marketing remark (1298 chars)
A charming single family residence awaits its discerning owner at 10109 McKinney ST, Detroit, MI, USA, presenting itself as an inviting home, ready for immediate enjoyment. The heart of this dwelling, the living room, offers a comforting ambiance, centered around a welcoming fireplace that promises cozy evenings. Overhead, elegant crown molding adds a refined touch, enhancing the room's character and creating a sophisticated atmosphere for relaxation. Culinary inspirations come to life within the kitchen, thoughtfully designed with stylish shaker cabinets that provide ample storage. A tasteful backsplash complements the design, creating a polished and functional space for preparing meals. Further enhancing the appeal of this 1939 single family residence are three comfortable bedrooms and a well-appointed bathroom, providing practical living arrangements. A bright sunroom extends the interior living space, inviting natural light and offering a peaceful sanctuary. Outside, the property boasts a private, fenced backyard, perfect for outdoor enjoyment, and a convenient shed for additional utility, all nestled within a desirable residential area. This inviting home offers a harmonious blend of classic appeal and contemporary comfort, poised to provide a delightful living experience.
-
2024-06-06soldstatus $50,000
-
2024-06-06soldstatus $78,900
-
2018-05-29soldstatus $42,500 Sold
-
2018-05-29soldstatus $42,500 Closed
-
2018-05-14status Pending
-
2018-05-14status Pending
-
2018-05-09soldstatus $31,500
-
2018-05-07price $44,000
-
2018-05-07price $44,000
-
2018-04-20$48,000 Active
-
2018-04-20$48,000 Active
-
2013-07-12soldstatus $12,500
-
2013-07-12soldstatus $12,500
-
2013-07-08historical
-
2013-07-08historical
-
2013-06-13$12,500
-
2013-06-13$12,500
-
2004-07-20soldstatus $83,000
-
1999-04-15soldstatus $76,000
-
1999-03-31soldstatus $76,000
-
1999-03-11historical
-
1998-12-10$78,000
-
1998-02-19soldstatus $34,000
-
1992-07-16soldstatus $33,500
ⓘ Source: listings_history table (triggers on properties + properties_extension) + one-shot
backfill from property_details.listing_events for pre-trigger history.
Tax reassessment forecast MI · Partial reset (capped growth)
- Current annual tax
- $2,308 · $192/mo
- Projected year-2 tax
- $2,308 · $192/mo
- Expected delta
- $0/yr ($0/mo · 0.0%)
ⓘ Screening estimate from a state-policy table — verify with the county assessor before closing.
Climate risk First Street
- Flood 1/10 Low FEMA zone X (unshaded) · 0% chance over 30 yrs
- Wildfire 1/10 Low
- Heat 3/10 Moderate 7 d/yr ≥95°F today · 15 d/yr by 30 yrs out
- Wind 2/10 Low
- Air quality 3/10 Moderate 3 unhealthy d/yr today · 4 by 30 yrs out
Nearby sold comps map
Loading sold comps map…
Walkable amenities ~0.75 mi
Loading nearby amenities…
Taxation est. · year 1
- Rental income
- $16,149
- − Mortgage interest
- −$4,756
- − Property taxes
- −$2,308
- − Insurance
- −$424
- − Repairs & maintenance
- −$1,292
- − Management
- −$1,292
- − Depreciation
- −$2,470
- Taxable income
- $3,607
- Est. tax owed @ 24.0%
- −$866
- After-tax cash flow
- $3,816/yr
For passive investors: Depreciation is non-cash, so a rental often shows a tax loss while cash-flowing — sheltering income. Rental losses are passive: they offset passive income freely, and up to $25,000/yr can offset ordinary (W-2) income if you actively participate and your MAGI is under $100k (phasing out to $0 by $150k); unused losses carry forward. On sale, claimed depreciation is recaptured at up to 25%, and gains may owe capital-gains tax (a 1031 exchange can defer both). Figures are a year-1 estimate at your 24.0% rate — not tax advice; consult a CPA.
Schools (NCES district)
- District
- Detroit Public Schools Community District
- NCES district ID
- 2601103
- Math proficiency
- 10% ▼ -2.00%
- Reading proficiency
- 24% ▲ 6.00%
- Median HH income
- $25,815
- Composite
- 13.06/100
- National rank
- #9564
- State rank
- #499 of 540 in MI
Livability — Detroit
- Score
- 73/100
- State rank
- #218
- US rank
- #5427
Category grades
Schools grade is shown separately in the Schools card above.
Census & demographics
- Census place
- Detroit, MI
- County
- Wayne County · 1,562,939 people
- City population
- 572,865
- Metro
- Detroit-Warren-Dearborn, MI
- Population (ZIP)
- 39,668
- Household income
- $44,856
- Rent vs Own
- Severe rent burden
- 2515.0
Population outlook (Wayne County) Hauer SSP2
- Today (2025)
- 1,675,273 people
- By 2030
- 1,620,300 · -3.3%
- By 2040
- 1,502,341 · -10.3%
- By 2050
- 1,384,039 · -17.4%
- By 2075
- 1,124,592 · -32.9%
- By 2100
- 881,193 · -47.4%
Race, ethnicity, and origin ACS 2023
- Neighborhood character
- Predominantly Black (88%)
- Race & ethnicity
- Black 88% White 8% Two or more races 3% Hispanic / Latino 1%
- Common ancestry
- Iranian 1% Romanian 1% Lithuanian 1%
- Foreign-born
- 1%
- Languages at home
- 97% English-only · Spanish 2%
Political lean MEDSL · Wayne
- 2024 margin
- Strong D (+29.0) · D 62.7% · R 33.7% · Other 3.6%
- 2008→2024 swing
- -20.5pp toward R · 2008: 49.5pp · 2024: 29.0pp
- All cycles
- 2024: D+29.0 2020: D+38.1 2016: D+37.3 2012: D+46.9 2008: D+49.5
Not yet ingested
- Civics
- —
Market trends
- HPI YoY
- ▼ -226.38%
- Current HPI
- 161.886
- Rent YoY
- ▲ 0.73%
- Metro
- Detroit-Warren-Dearborn, MI
- State GDP YoY
- ▲ 1.37%
- F500 in state
- 28
Industry mix (Fortune 500 HQ in MI)
| Industry | F500 HQs | Revenue |
|---|---|---|
| Automotive Parts | 3 | $48B |
|
||
| Automotive | 2 | $372B |
|
||
| Chemicals | 1 | $45B |
|
||
| Automotive Retail | 1 | $29B |
|
||
| Healthcare / Medical Devices | 1 | $23B |
|
||
| Automotive Technology | 1 | $20B |
|
||
Price history
+153.4% since first listed26 events — show timeline
- 2026-02-10 Listed $84,900 REALCOMP
- 2026-02-10 Listed $84,900 MiRealSource-MiMLS
- 2024-06-06 Sold (Public Records) $78,900 Public Records
- 2024-06-06 Sold (Public Records) $50,000 Public Records
- 2018-05-29 Sold (MLS) $42,500 MiRealSource-MiMLS
- 2018-05-29 Sold (MLS) $42,500 REALCOMP
- 2018-05-14 Pending — MiRealSource-MiMLS
- 2018-05-14 Pending — REALCOMP
- 2018-05-09 Sold (Public Records) $31,500 Public Records
- 2018-05-07 Price Changed $44,000 MiRealSource-MiMLS
- 2018-05-07 Price Changed $44,000 REALCOMP
- 2018-04-20 Listed $48,000 MiRealSource-MiMLS
- 2018-04-20 Listed $48,000 REALCOMP
- 2013-07-12 Sold (MLS) $12,500 MiRealSource-MiMLS
- 2013-07-12 Sold (MLS) $12,500 REALCOMP
- 2013-07-08 Listing Removed — MiRealSource-MiMLS
- 2013-07-08 Listing Removed — REALCOMP
- 2013-06-13 Listed $12,500 MiRealSource-MiMLS
- 2013-06-13 Listed $12,500 REALCOMP
- 2004-07-20 Sold (Public Records) $83,000 Public Records
- 1999-04-15 Sold (Public Records) $76,000 Public Records
- 1999-03-31 Sold (MLS) $76,000 MiRealSource-MiMLS
- 1999-03-11 Listing Removed — MiRealSource-MiMLS
- 1998-12-10 Listed $78,000 MiRealSource-MiMLS
- 1998-02-19 Sold (Public Records) $34,000 Public Records
- 1992-07-16 Sold (Public Records) $33,500 Public Records
Property tax history
+3.1%/yrLatest (2025): $2,308 · -18.1% YoY. Source: county tax records.
Cash-flow waterfall
monthlySold comps — $/sqft
last 12 mo · ≤1 miLoading sold comps…