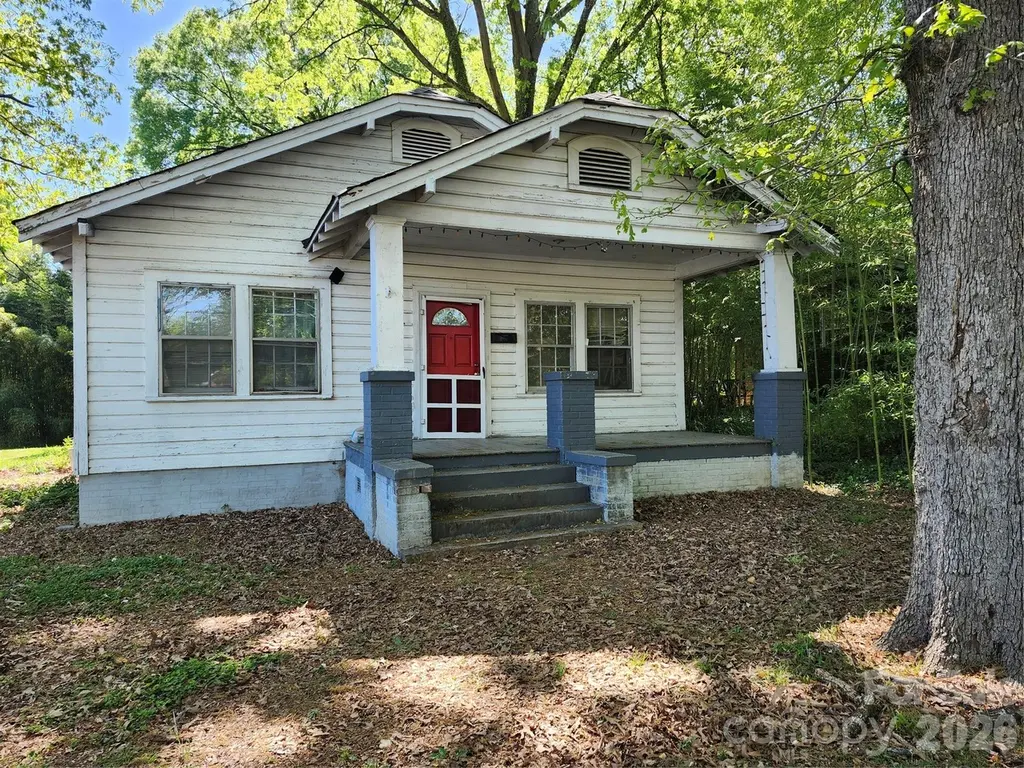
209 W 1st St · Lowell, NC
Flood risk 1/10 · Minimal
- FEMA flood zone
- X (unshaded)
- Chance of flooding over 30 yrs
- 0.0%
- Est. flood insurance / yr
- $507 – $1,088
Fire risk 1/10 · Minimal
- Est. fire insurance / yr
- $906 – $1,684
Heat risk 6/10 · Moderate
- Hot days now (above 104°F)
- 7 days/yr
- Hot days in 30 yrs
- 17 days/yr
Wind risk 5/10 · Moderate
- Chance of severe wind over 30 yrs
- 25.0%
Air-quality risk 3/10 · Minor
- Unhealthy air days now
- 3 days/yr
- Unhealthy air days in 30 yrs
- 5 days/yr
Risk factors via First Street. Map © Google.
Why this score? — see what drove the B grade
The composite is a weighted blend of 9 inputs, each scored 0–100. Each bar is that input's sub-score; the figure is the points it added to the 100-point composite (weight × sub-score).
- Cash flow +30.0/30.0
- DSCR +10.0/10.0
- 1% rule +9.7/10.0
- ARV discount +7.5/15.0
- Appreciation +5.2/10.0
- Schools +3.6/10.0
- Livability +3.3/5.0
- Rent growth +2.5/5.0
- Condition / age +2.5/5.0
$110,000
🖨 Deal sheet 📄 Offer letter ✓ Due diligence
Listing remarks
Two bedroom bungalow. To be sold in "AS IS CONDITION''.
Key facts
- 0.27 acre lot
- Built 1930
Property features AI
Finance
- HOA & community: No HOA
Exterior
- Parking: No garage; No designated parking features listed
- Utilities: City water; Public sewer
- Home design: Manufactured single-family residence; One story
- Construction: Wood construction; Crawl space foundation
- Exterior features: Lot of approximately 0.27 acres; Paved road access; Publicly maintained road
Interior
- Kitchen: No appliances listed for the kitchen
- Bedrooms: Two bedrooms on the main level
- Bathrooms: One full bathroom (main level)
- Heating & cooling: No heating system listed; No cooling system listed
- Interior features: One main-level living area (1 total room); No built-in appliances listed
- Laundry & utility: No laundry features listed
Neighborhood map
What this means for you Summary
Snapshot
- This is a 2-bed/1.0-bath single-family listed at $110k.
Deal economics
- At list price, monthly cash flow is $539 ($6k/yr) — positive.
- The deal already cash-flows at list — no discount required.
- Meets the 1% rule at list price ($2k rent vs $110k).
Location & tenants
- Location reads 66/100 on livability (#291 in NC) — a middle-class / working-renter tenant base. Strengths: cost of living A+, crime A-, housing A-; Watch: employment D, schools F, amenities F.
- Gaston County Schools (suburban): math 44% / reading 42% proficiency, ranked #93 of 178 in NC (top 52%) — families likely to look elsewhere, expect single-tenant / working-renter base with shorter leases.
- Market conditions: 21 active listings in the ZIP; 8 comparable units currently listed for rent nearby; rentals at typical pace (median 16d on market — plan ~3-4 weeks tenant-placement turnaround); 2,069 units permitted in Gaston County in 2024 (142 in 5+ unit buildings).
Forward outlook
- In year one you build about $1k of equity ($761 loan paydown + $540 appreciation (0.5% local appreciation)).
- Gaston County population projected at +12% by 2050 — modest demand growth; plan on rents tracking national, not racing it.
- At projected returns (0.5% appreciation + 3.0% rent growth), your $31k cash investment doubles in ~4 years — after that, you're playing with house money.
Negotiation context
- Only 1 days on market — expect competitive offers; lowballing is unlikely to land.
- Current owner paid $7k; list at $110k implies a 1567% gain — meaningful room to come down on a strong offer.
Risks & watch-outs
- Watch-outs: built in 1930 — expect roof / HVAC / electrical / plumbing capex.
- Climate carrying-cost: moderate wind risk, 25% chance of damaging wind over 30y; extreme-heat days projected 7→17/yr by 2055 (HVAC capex compounding) — expect insurance premiums to compound above CPI over the hold.
Questions for the listing agent
- Built in 1930 — when were the roof, HVAC, electrical panel, plumbing, and water heater last replaced?
- Is there a deadline driving the sale (1031 exchange, divorce, estate, relocation)? That informs how much negotiation room exists.
- Schools are F-rated, which usually means shorter tenancies and higher turnover. Who's the typical renter profile here, and what's been the actual vacancy rate?
- What's the average days-on-market for RENTAL listings here right now (not sales)? A rising rental-DOM trend means longer vacancies and softer asking-rent achievability than the comps imply.
- What's the recent tenant-quality profile in this submarket — average credit score on applications, eviction rate, late-payment / NSF rate, and stable-employment percentage? A property-management company in the area should have these aggregated.
- How much new for-sale + rental construction is in the pipeline within 1–3 miles? Heavy new supply typically softens prices + rents 12–24 months out; constrained supply supports both.
Investment metrics
- 1% rule
- 1.47% ✓
- Cap rate
- 12.17%
- Cash-on-cash
- 20.99%
- DSCR
- 1.93
- GRM
- 5.7
CMA / ARV
- ARV (on-the-fly)
- $257,488
- Comps found
- 12
Show comp detail 12 sales within ~0.75 mi
| Address | Dist | Beds/Ba | Sqft | Sold | Price | $/sf | Match |
|---|---|---|---|---|---|---|---|
| 209 W 1st St | 0.00mi | 2/1.0 | 1,096 (+3%) | 0mo | $105,000 | $96 | 95 |
| 514 Hand Cir | 0.29mi | 3/1.0 (+1) | 1,123 (+6%) | 6mo | $230,000 | $205 | 68 |
| 508 Hand Cir | 0.25mi | 3/1.0 (+1) | 976 (-8%) | 6mo | $250,000 | $256 | 64 |
| 913 Stowe Dr | 0.71mi | 2/1.0 | 1,032 (-3%) | 6mo | $255,000 | $247 | 56 |
| 508 Mill St | 0.37mi | 3/2.0 (+1) | 1,186 (+12%) | 3mo | $289,000 | $244 | 52 |
| 510 Mill St | 0.38mi | 3/2.0 (+1) | 1,186 (+12%) | 3mo | $286,000 | $241 | 52 |
| 211 Seigle St Unit 37-38 | 0.39mi | 3/2.0 (+1) | 1,198 (+13%) | 2mo | $290,000 | $242 | 50 |
| 403 Groves St | 0.33mi | 3/2.0 (+1) | 1,190 (+12%) | 9mo | $270,000 | $227 | 48 |
| 720 Martha Ave | 0.55mi | 3/2.0 (+1) | 1,191 (+12%) | 4mo | $290,000 | $243 | 42 |
| 503 Caroline Ave | 0.70mi | 3/2.0 (+1) | 1,186 (+12%) | 2mo | $280,000 | $236 | 37 |
| 120 S Elm St | 0.59mi | 3/2.0 (+1) | 1,200 (+13%) | 7mo | $289,900 | $242 | 36 |
| 706 Stowe Dr | 0.66mi | 2/1.5 | 1,214 (+14%) | 9mo | $260,000 | $214 | 36 |
Match score weights: distance 35% · size 25% · config 20% · recency 20%. Top-matched comps best support the ARV.
Projected returns pro-forma
0.49% appreciation · 3.0% rent growth · sell at horizon
- IRR
- 22.0%
- Equity multiple
- 2.09×
- Total profit
- $33,665
- Equity at exit
- $34,666
- IRR
- 25.5%
- Equity multiple
- 3.95×
- Total profit
- $90,934
- Equity at exit
- $43,913
Cash invested: $30,800 (down + closing). Projections, not guarantees.
Landlord ↔ Tenant lean methodology
- Overall (STATE)
- 85 Strongly Landlord-Friendly
- State North Carolina
- 85 Strongly Landlord-Friendly · R+3
- County
- — inherits STATE
- City
- — inherits STATE
ZIP-level market 28098
- Home prices YoY
- 0.2%
- Active inventory
- 21
- Price-to-rent
- 5.7×
Monthly cashflow live
- Estimated rent
- $1,622 high interval (Pro) →
- Mortgage (P&I)
- −$577
- Tax from tax record
- −$120 /mo · $1,439/yr
- Insurance
- −$46
- HOA
- −$0
- Vacancy / Maint / Mgmt
- −$341
- Net cashflow
- $539
Break-even live
UW: 25.0% down · 7.5% · 30yr · 1.5% tax · 5.0% vac · 8.0% maint · 8.0% mgmt
Financing live
Cash to close
- Down payment
- $27,500
- Closing costs
- $3,300
- Reserves months
- —
- Total cash needed
- —
Loan-product check · same deal, 3 products live
Conventional
25% down · 7.5% · 30yr
- Down + closing
- —
- Monthly P&I
- —
- Monthly cashflow
- —
- DSCR
- —
- Eligible?
- —
Personal DTI + credit; lowest rate.
DSCR
20% down · 8.5% · 30yr
- Down + closing
- —
- Monthly P&I
- —
- Monthly cashflow
- —
- DSCR
- —
- Eligible?
- —
No personal income docs; deal must DSCR.
Hard money
10% down · 12.0% · 12mo
- Down + closing
- —
- Monthly P&I
- —
- Monthly cashflow
- —
- DSCR
- —
- Eligible?
- —
Short-term bridge; refi at stabilization.
Rent comps 8 comps
| Address | Beds | Baths | Sqft | Rent | $/sqft | DOM | Units | Dist |
|---|---|---|---|---|---|---|---|---|
| 4132 Gardner Ridge Dr Gastonia, NC | 1.0 | 1.0 | 750 | $1,100 | $1.47 | 17d | 6 | 1.00mi |
| 2132 Boulder Ct Gastonia, NC | 3.0 | 2.5 | 1441 | $1,850 | $1.28 | 2d | 1 | 1.02mi |
| 1351 Darlington Dr Lowell, NC | 2.0 | 2.0 | 1236 | $1,695 | $1.37 | 14d | 1 | 1.13mi |
| 740 Log Cabin Dr Gastonia, NC | 3.0 | 1.5 | 1100 | $1,750 | $1.59 | 16d | 1 | 1.21mi |
| 740 Log Cabin Dr Gastonia, NC | 3.0 | 1.5 | 1100 | $1,750 | $1.59 | 23d | 1 | 1.21mi |
| 1654 Lowell Bethesda Rd Gastonia, NC | 2.0 | 2.0 | 1000 | $1,495 | $1.50 | 23d | 1 | 1.40mi |
| 1654 Lowell Bethesda Rd Gastonia, NC | 2.0 | 2.0 | 1000 | $1,495 | $1.50 | 3d | 1 | 1.40mi |
| 2901 Fraley Church Rd Gastonia, NC | 3.0 | 2.0 | 1120 | $1,800 | $1.61 | 2d | 1 | 1.49mi |
Listing history 3 events
-
2026-05-18status Pending
-
2026-05-14$110,000 Active
-
1966-04-01soldstatus $6,600
ⓘ Source: listings_history table (triggers on properties + properties_extension) + one-shot
backfill from property_details.listing_events for pre-trigger history.
Tax reassessment forecast NC · Resets to sale price
- Current annual tax
- $1,439 · $120/mo
- Projected year-2 tax
- $1,439 · $120/mo
- Expected delta
- $0/yr ($0/mo · 0.0%)
ⓘ Screening estimate from a state-policy table — verify with the county assessor before closing.
Climate risk First Street
- Flood 1/10 Low FEMA zone X (unshaded) · 0% chance over 30 yrs
- Wildfire 1/10 Low
- Heat 6/10 Major 7 d/yr ≥104°F today · 17 d/yr by 30 yrs out
- Wind 5/10 Major 25% chance of damaging wind over 30 yrs
- Air quality 3/10 Moderate 3 unhealthy d/yr today · 5 by 30 yrs out
Nearby sold comps map
Loading sold comps map…
Walkable amenities ~0.75 mi
Loading nearby amenities…
Taxation est. · year 1
- Rental income
- $19,462
- − Mortgage interest
- −$6,162
- − Property taxes
- −$1,439
- − Insurance
- −$550
- − Repairs & maintenance
- −$1,557
- − Management
- −$1,557
- − Depreciation
- −$3,200
- Taxable income
- $4,997
- Est. tax owed @ 24.0%
- −$1,199
- After-tax cash flow
- $5,264/yr
For passive investors: Depreciation is non-cash, so a rental often shows a tax loss while cash-flowing — sheltering income. Rental losses are passive: they offset passive income freely, and up to $25,000/yr can offset ordinary (W-2) income if you actively participate and your MAGI is under $100k (phasing out to $0 by $150k); unused losses carry forward. On sale, claimed depreciation is recaptured at up to 25%, and gains may owe capital-gains tax (a 1031 exchange can defer both). Figures are a year-1 estimate at your 24.0% rate — not tax advice; consult a CPA.
Schools (NCES district)
- District
- Gaston County Schools
- NCES district ID
- 3701620
- Math proficiency
- 44% ▲ 4.00%
- Reading proficiency
- 42% ▲ 1.00%
- Median HH income
- $43,644
- Composite
- 36.39/100
- National rank
- #4680
- State rank
- #93 of 178 in NC
Livability — Lowell
- Score
- 66/100
- State rank
- #291
- US rank
- #12313
Category grades
Schools grade is shown separately in the Schools card above.
Census & demographics
- Census place
- Lowell, NC
- City population
- 3,746
- Population (ZIP)
- 3,746
Population outlook (Gaston County) Hauer SSP2
- Today (2025)
- 230,027 people
- By 2030
- 237,300 · +3.2%
- By 2040
- 249,659 · +8.5%
- By 2050
- 257,806 · +12.1%
- By 2075
- 272,163 · +18.3%
- By 2100
- 268,652 · +16.8%
Race, ethnicity, and origin ACS 2023
- Neighborhood character
- Predominantly White (67%)
- Race & ethnicity
- White 67% Hispanic / Latino 16% Black 12% Two or more races 8% Asian 2%
- Hispanic origin (detail)
- Mexican 10% Dominican 2%
- Common ancestry
- Serbian 3% Iranian 1% Portuguese 1%
- Foreign-born
- 10% · Canada, China
- Languages at home
- 83% English-only · Spanish 12% Arabic 2% Other Indo-European 1%
Political lean MEDSL · Gaston
- 2024 margin
- Strong R (+25.0) · D 37.0% · R 62.1%
- 2008→2024 swing
- 0.0pp no change · 2008: -25.0pp · 2024: -25.0pp
- All cycles
- 2024: R+25.0 2020: R+27.8 2016: R+32.1 2012: R+25.6 2008: R+25.0
Not yet ingested
- Civics
- —
Market trends
- HPI YoY
- ▲ 0.49%
- Current HPI
- 258.788
- Rent YoY
- —
- Metro
- —
- State GDP YoY
- ▲ 3.28%
- F500 in state
- 26
Industry mix (Fortune 500 HQ in NC)
| Industry | F500 HQs | Revenue |
|---|---|---|
| Financial Services | 2 | $213B |
|
||
| Retail | 2 | $95B |
|
||
| Industrial Conglomerate | 1 | $38B |
|
||
| Metals / Steel | 1 | $35B |
|
||
| Utilities | 1 | $30B |
|
||
| Industrial Machinery | 1 | $19B |
|
||
Price history
+1566.7% since first listed3 events — show timeline
- 2026-05-18 Pending — CANOPYMLS as Distributed by MLS Grid
- 2026-05-14 Listed $110,000 CANOPYMLS as Distributed by MLS Grid
- 1966-04-01 Sold (Public Records) $6,600 Public Records
Property tax history
+3.8%/yrLatest (2025): $1,439 · +0.0% YoY. Source: county tax records.
Cash-flow waterfall
monthlySold comps — $/sqft
last 12 mo · ≤1 miLoading sold comps…