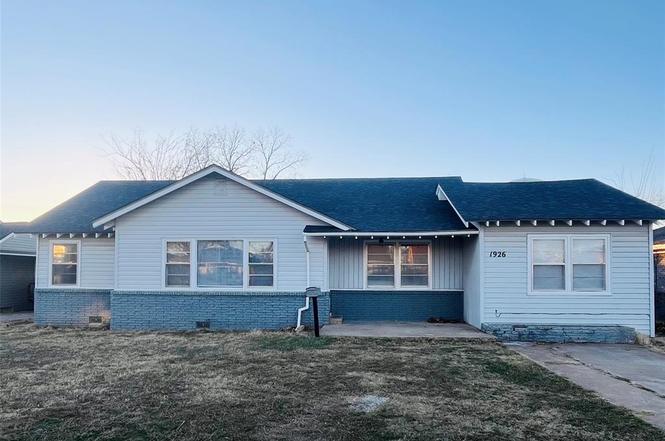
1926 N Market Ave · Shawnee, OK
Flood risk 1/10 · Minimal
- FEMA flood zone
- X (unshaded)
- Chance of flooding over 30 yrs
- 0.0%
- Est. flood insurance / yr
- $507 – $1,088
Fire risk 7/10 · Major
- Est. fire insurance / yr
- $2,463 – $4,575
Heat risk 5/10 · Moderate
- Hot days now (above 109°F)
- 7 days/yr
- Hot days in 30 yrs
- 18 days/yr
Wind risk 3/10 · Minor
- Chance of severe wind over 30 yrs
- 5.0%
Air-quality risk 2/10 · Minimal
- Unhealthy air days now
- 1 days/yr
- Unhealthy air days in 30 yrs
- 1 days/yr
Risk factors via First Street. Map © Google.
Why this score? — see what drove the B- grade
The composite is a weighted blend of 9 inputs, each scored 0–100. Each bar is that input's sub-score; the figure is the points it added to the 100-point composite (weight × sub-score).
- Cash flow +25.8/30.0
- ARV discount +15.0/15.0
- DSCR +8.6/10.0
- 1% rule +6.0/10.0
- Livability +3.2/5.0
- Rent growth +3.1/5.0
- Condition / age +2.5/5.0
- Schools +1.1/10.0
- Appreciation +0.0/10.0
$122,000
🖨 Deal sheet (PDF) 📄 Offer letter ✓ Due diligence
Listing remarks
Spacious 4-bedroom, 1.5-bath home located in the heart of Shawnee. Conveniently situated near the Oklahoma Baptist University campus and just minutes from shopping and dining. This property would make an excellent starter home or a strong investment opportunity. Features include a new roof installed in 2023, fresh paint throughout, and a generously sized living area perfect for gathering and entertaining.
Key facts
- Fresh paint
- New roof
- 9,801 sq ft lot
Tags
Property features AI
Finance
- Other: Homestead exemption indicated
- Financial info: Not assumable
- HOA & community: No mandatory association dues
Exterior
- Home design: Single family residence; Split-level property; Existing structure
- Construction: Vinyl siding; Composition roof (replaced/updated in 2023); Combination foundation
- Exterior features: Covered porch; Interior lot
Interior
- Bedrooms: 4 bedrooms (split-level layout)
- Bathrooms: 1 full bathroom; 1 half bathroom
- Heating & cooling: Electric heating
- Interior features: Single living area; No fireplace
Neighborhood map
What this means for you Summary
Snapshot
- This is a 3-bed/2.0-bath single-family listed at $122k.
Deal economics
- At list price, monthly cash flow is $296 ($4k/yr) — positive.
- The deal already cash-flows at list — no discount required.
- Meets the 1% rule at list price ($1k rent vs $122k).
- Recommended offer: $111k (9.0% below list) — sets the bar for market timing.
- Cap rate 9.2% vs local median 3.9% in Shawnee — top-decile yield for the area; either an underpriced asset or a hidden risk that comps aren't pricing in. Stress-test before assuming the spread holds.
Location & tenants
- Location reads 63/100 on livability (#217 in OK) — a middle-class / working-renter tenant base. Strengths: cost of living A+, housing A+; Watch: crime F, amenities F, commute F.
- Shawnee (town): math 11% / reading 17% proficiency, ranked #238 of 270 in OK (top 88%) — low school quality limits family demand, transient renter base, plan for 1-2y turnover; 70% free/reduced lunch — lower-income household profile, screen leases tightly.
- Zoned schools: Will Rogers Es (math 12% / reading 13%, grade F, #648 of 845 statewide, top 77%, 400 students, 0% FRL); Shawnee Ms (math 6% / reading 14%, grade F, #277 of 345 statewide, top 83%, 711 students, 0% FRL); Shawnee Hs (math 16% / reading 35%, grade F, #142 of 447 statewide, top 32%, 987 students, 0% FRL) — zoned schools average 0% FRL vs 70% district-wide (70 pts lower); this property's tenant base skews higher-income than the district average.
- Market conditions: Rents rising (+2.5%/yr); 393 active listings in the ZIP; 183 units permitted in Pottawatomie County in 2024 (16 in 5+ unit buildings).
Forward outlook
- Local home prices are declining (-3.0%/yr); year-one equity from $843 of loan paydown is wiped out by about $4k of value loss. Plan a longer hold.
- Pottawatomie County population projected at +12% by 2050 — modest demand growth; plan on rents tracking national, not racing it.
Negotiation context
- It's been on market 92 days — a 9% lower offer ($111k) is reasonable based on typical stale-listing flexibility.
Risks & watch-outs
- Climate carrying-cost: major wildfire risk; extreme-heat days projected 7→18/yr by 2055 (HVAC capex compounding) — expect insurance premiums to compound above CPI over the hold.
Questions for the listing agent
- It's been on market 92 days. Have you received any prior offers? Is the seller open to a 9% concession, seller financing, or rate buy-down credit?
- Built in 1960 — when were the roof, HVAC, electrical panel, plumbing, and water heater last replaced?
- Why hasn't it sold? Are there any deal-killer items the seller is aware of (foundation, flood, title, zoning, code violations)?
- Is there a deadline driving the sale (1031 exchange, divorce, estate, relocation)? That informs how much negotiation room exists.
- Schools are F-rated, which usually means shorter tenancies and higher turnover. Who's the typical renter profile here, and what's been the actual vacancy rate?
- Crime grade is F in this area — have there been break-ins, vandalism, or insurance claims at this property in the last 3 years? What carrier currently insures it and at what premium?
- What's the average days-on-market for RENTAL listings here right now (not sales)? A rising rental-DOM trend means longer vacancies and softer asking-rent achievability than the comps imply.
- What's the recent tenant-quality profile in this submarket — average credit score on applications, eviction rate, late-payment / NSF rate, and stable-employment percentage? A property-management company in the area should have these aggregated.
- How much new for-sale + rental construction is in the pipeline within 1–3 miles? Heavy new supply typically softens prices + rents 12–24 months out; constrained supply supports both.
Investment metrics
- 1% rule
- 1.10% ✓
- Cap rate
- 9.21%
- Cash-on-cash
- 10.41%
- DSCR
- 1.46
- GRM
- 7.6
CMA / ARV
- ARV (on-the-fly)
- $199,983
- Comps found
- 12
Show comp detail 12 sales within ~0.75 mi
| Address | Dist | Beds/Ba | Sqft | Sold | Price | $/sf | Match |
|---|---|---|---|---|---|---|---|
| 1909 N Louisa Ave | 0.11mi | 3/2.0 | 1,832 (-2%) | 8mo | $195,000 | $106 | 84 |
| 1908 N Bdwy Ave | 0.14mi | 3/2.0 | 1,770 (-5%) | 2mo | $190,000 | $107 | 83 |
| 202 W Franklin St | 0.20mi | 3/2.0 | 1,721 (-8%) | 6mo | $159,999 | $93 | 72 |
| 1309 N Broadway Ave | 0.59mi | 3/2.0 | 1,887 (+1%) | 2mo | $239,900 | $127 | 69 |
| 1834 N Market Ave | 0.10mi | 4/1.5 (+1) | 1,693 (-9%) | 5mo | $62,500 | $37 | 68 |
| 1811 N Union Ave | 0.36mi | 3/2.0 | 1,961 (+5%) | 10mo | $210,000 | $107 | 67 |
| 1712 N Pennsylvania Ave | 0.62mi | 3/2.0 | 1,923 (+3%) | 2mo | $206,000 | $107 | 65 |
| 401 E Franklin St | 0.47mi | 3/2.0 | 2,047 (+10%) | 0mo | $215,500 | $105 | 62 |
| 1730 N Park Ave | 0.22mi | 4/2.5 (+1) | 2,051 (+10%) | 9mo | $128,600 | $63 | 59 |
| 2304 N Tucker Ave | 0.66mi | 4/2.0 (+1) | 1,924 (+3%) | 1mo | $218,000 | $113 | 59 |
| 2008 N Ione Ave | 0.50mi | 3/2.0 | 1,652 (-12%) | 1mo | $195,000 | $118 | 56 |
| 1921 N Minnesota Ave | 0.51mi | 3/2.5 | 2,087 (+12%) | 9mo | $200,000 | $96 | 47 |
Match score weights: distance 35% · size 25% · config 20% · recency 20%. Top-matched comps best support the ARV.
Projected returns pro-forma
-3.0% appreciation · 2.49% rent growth · sell at horizon
- IRR
- -1.3%
- Equity multiple
- 0.95×
- Total profit
- $-1,618
- Equity at exit
- $18,191
- IRR
- 7.9%
- Equity multiple
- 1.59×
- Total profit
- $19,985
- Equity at exit
- $10,548
Cash invested: $34,160 (down + closing). Projections, not guarantees.
Landlord ↔ Tenant lean methodology
- Overall (STATE)
- 83 Strongly Landlord-Friendly
- State Oklahoma
- 83 Strongly Landlord-Friendly · R+20
- County
- — inherits STATE
- City
- — inherits STATE
ZIP-level market 74804
- Home prices YoY
- -25.1%
- Rents YoY
- 2.5%
- Active inventory
- 393
- Price-to-rent
- 7.6×
Monthly cashflow live
- Estimated rent
- $1,341 medium interval (Pro) →
- Mortgage (P&I)
- −$640
- Tax from tax record
- −$72 /mo · $867/yr
- Insurance
- −$51
- HOA
- −$0
- Vacancy / Maint / Mgmt
- −$282
- Net cashflow
- $296
Break-even live
Sensitivity live
| Price | -10% $365 | -5% $331 | +0% $296 | +5% $262 | +10% $227 |
|---|---|---|---|---|---|
| Rent | -10% $190 | -5% $243 | +0% $296 | +5% $349 | +10% $402 |
| Rate | -1.0pp $358 | -0.5pp $327 | base $296 | +0.5pp $265 | +1.0pp $232 |
UW: 25.0% down · 7.5% · 30yr · 1.5% tax · 5.0% vac · 8.0% maint · 8.0% mgmt
Financing live
Cash to close
- Down payment
- $30,500
- Closing costs
- $3,660
- Reserves months
- —
- Total cash needed
- —
Loan-product check · same deal, 3 products live
Conventional
25% down · 7.5% · 30yr
- Down + closing
- —
- Monthly P&I
- —
- Monthly cashflow
- —
- DSCR
- —
- Eligible?
- —
Personal DTI + credit; lowest rate.
DSCR
20% down · 8.5% · 30yr
- Down + closing
- —
- Monthly P&I
- —
- Monthly cashflow
- —
- DSCR
- —
- Eligible?
- —
No personal income docs; deal must DSCR.
Hard money
10% down · 12.0% · 12mo
- Down + closing
- —
- Monthly P&I
- —
- Monthly cashflow
- —
- DSCR
- —
- Eligible?
- —
Short-term bridge; refi at stabilization.
Listing history 17 events
-
2026-06-21days on market $122,000 Active 92 DOM
-
2026-06-19days on market $122,000 Active 90 DOM
-
2026-06-18days on market $122,000 Active 89 DOM
-
2026-06-17days on market $122,000 Active 88 DOM
-
2026-06-16days on market $122,000 Active 87 DOM
-
2026-06-15days on market $122,000 Active 86 DOM
-
2026-06-14days on market $122,000 Active 84 DOM
-
2026-06-12days on market $122,000 Active 83 DOM
-
2026-06-09days on market $122,000 Active 80 DOM
-
2026-06-08days on market $122,000 Active 79 DOM
-
2026-06-07days on market $122,000 Active 78 DOM
-
2026-06-05days on market $122,000 Active 75 DOM
-
2026-06-02days on market $122,000 Active 73 DOM
-
2026-06-01pricestatus $122,000 Active 72 DOM
-
2026-05-01status Pending
-
2026-04-24price $139,000
-
2026-02-17$142,000 Active
ⓘ Source: listings_history table (triggers on properties + properties_extension) + one-shot
backfill from property_details.listing_events for pre-trigger history.
Tax reassessment forecast OK · Resets to sale price
- Current annual tax
- $867 · $72/mo
- Projected year-2 tax
- $1,098 · $92/mo
- Expected delta
- +$231/yr (+$19/mo · 26.6%)
ⓘ Screening estimate from a state-policy table — verify with the county assessor before closing.
Climate risk First Street
- Flood 1/10 Low FEMA zone X (unshaded) · 0% chance over 30 yrs
- Wildfire 7/10 Severe
- Heat 5/10 Major 7 d/yr ≥109°F today · 18 d/yr by 30 yrs out
- Wind 3/10 Moderate 5% chance of damaging wind over 30 yrs
- Air quality 2/10 Low 1 unhealthy d/yr today · 1 by 30 yrs out
Nearby sold comps map
Loading sold comps map…
Walkable amenities ~0.75 mi
Loading nearby amenities…
Taxation est. · year 1
- Rental income
- $16,087
- − Mortgage interest
- −$6,834
- − Property taxes
- −$867
- − Insurance
- −$610
- − Repairs & maintenance
- −$1,287
- − Management
- −$1,287
- − Depreciation
- −$3,549
- Taxable income
- $1,653
- Est. tax owed @ 24.0%
- −$397
- After-tax cash flow
- $3,158/yr
For passive investors: Depreciation is non-cash, so a rental often shows a tax loss while cash-flowing — sheltering income. Rental losses are passive: they offset passive income freely, and up to $25,000/yr can offset ordinary (W-2) income if you actively participate and your MAGI is under $100k (phasing out to $0 by $150k); unused losses carry forward. On sale, claimed depreciation is recaptured at up to 25%, and gains may owe capital-gains tax (a 1031 exchange can defer both). Figures are a year-1 estimate at your 24.0% rate — not tax advice; consult a CPA.
Schools (NCES district)
- District
- Shawnee
- NCES district ID
- 4027570
- Math proficiency
- 11% ▼ -10.00%
- Reading proficiency
- 17% ▼ -10.00%
- Median HH income
- $32,128
- Composite
- 11.21/100
- National rank
- #9724
- State rank
- #238 of 270 in OK
Livability — Shawnee
- Score
- 63/100
- State rank
- #217
- US rank
- #15593
Category grades
Schools grade is shown separately in the Schools card above.
Census & demographics
- Census place
- Shawnee, OK
- County
- Pottawatomie County · 45,194 people
- City population
- 45,194
- Metro
- Shawnee, OK
- Population (ZIP)
- 23,227
- Household income
- $67,631
- Rent vs Own
- Severe rent burden
- 442.0
Population outlook (Pottawatomie County) Hauer SSP2
- Today (2025)
- 76,622 people
- By 2030
- 78,816 · +2.9%
- By 2040
- 82,766 · +8.0%
- By 2050
- 86,031 · +12.3%
- By 2075
- 93,316 · +21.8%
- By 2100
- 95,820 · +25.1%
Race, ethnicity, and origin ACS 2023
- Neighborhood character
- Predominantly White (70%)
- Race & ethnicity
- White 70% Two or more races 11% Native American 11% Hispanic / Latino 6% Black 4%
- Hispanic origin (detail)
- Mexican 4%
- Common ancestry
- Slovak 2% Lithuanian 2% Italian 1%
- Foreign-born
- 3% · Canada
- Languages at home
- 96% English-only · Spanish 3%
Political lean MEDSL · Pottawatomie
- 2024 margin
- Solid R (+47.4) · D 25.2% · R 72.7% · Other 2.1%
- 2008→2024 swing
- -9.1pp toward R · 2008: -38.4pp · 2024: -47.4pp
- All cycles
- 2024: R+47.4 2020: R+46.0 2016: R+46.5 2012: R+38.7 2008: R+38.4
Not yet ingested
- Civics
- —
Market trends
- HPI YoY
- ▼ -83.01%
- Current HPI
- 247.115
- Rent YoY
- ▲ 2.49%
- Metro
- Shawnee, OK
- State GDP YoY
- ▲ 1.55%
- F500 in state
- 6
Industry mix (Fortune 500 HQ in OK)
| Industry | F500 HQs | Revenue |
|---|---|---|
| Energy | 3 | $48B |
|
||
Price history
-2.1% since first listed3 events — show timeline
- 2026-05-01 Pending — MLSOK
- 2026-04-24 Price Changed $139,000 MLSOK
- 2026-02-17 Listed $142,000 MLSOK
Property tax history
+4.7%/yrLatest (2025): $867 · +4.2% YoY. Source: county tax records.
Cash-flow waterfall
monthlySold comps — $/sqft
last 12 mo · ≤1 miLoading sold comps…