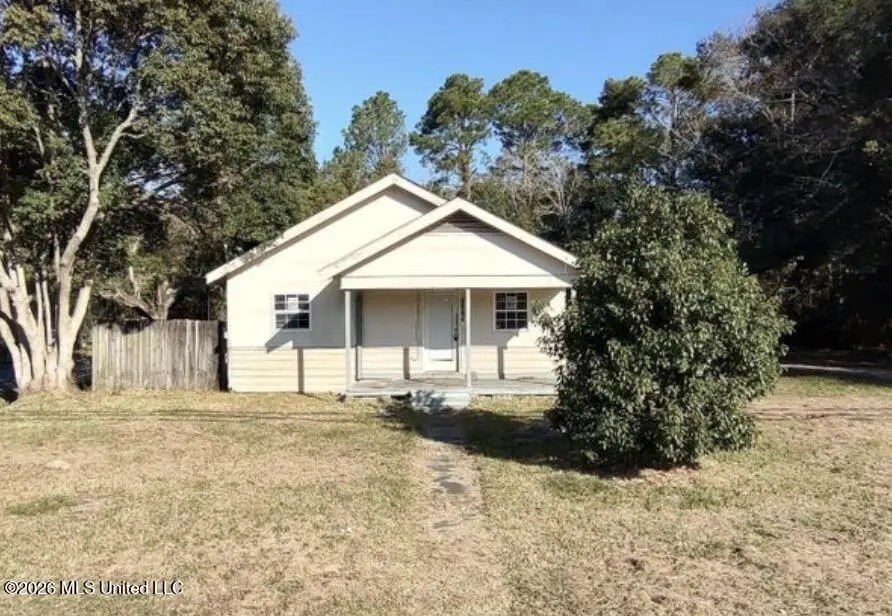
7325 Grierson St · Moss Point, MS
Flood risk 8/10 · Major
- FEMA flood zone
- AE
- Chance of flooding over 30 yrs
- 0.97%
- Est. flood insurance / yr
- $1,737 – $8,500
Fire risk 8/10 · Major
- Est. fire insurance / yr
- $1,241 – $2,305
Heat risk 10/10 · Severe
- Hot days now (above 107°F)
- 7 days/yr
- Hot days in 30 yrs
- 22 days/yr
Wind risk 9/10 · Severe
- Chance of severe wind over 30 yrs
- 99.0%
Air-quality risk 3/10 · Minor
- Unhealthy air days now
- 2 days/yr
- Unhealthy air days in 30 yrs
- 3 days/yr
Risk factors via First Street. Map © Google.
Why this score? — see what drove the A- grade
The composite is a weighted blend of 9 inputs, each scored 0–100. Each bar is that input's sub-score; the figure is the points it added to the 100-point composite (weight × sub-score).
- Cash flow +30.0/30.0
- ARV discount +15.0/15.0
- 1% rule +10.0/10.0
- DSCR +10.0/10.0
- Appreciation +7.3/10.0
- Livability +3.4/5.0
- Rent growth +2.5/5.0
- Condition / age +2.5/5.0
- Schools +1.6/10.0
$50,000
🖨 Deal sheet 📄 Offer letter ✓ Due diligence
Listing remarks
Investor special in Moss Point! This 3-bedroom, 1-bath home is full of potential and ready for your vision. Great opportunity for a fixer-upper, rental property or investment project. SOLD AS-IS.
Key facts
- 0.36 acre lot
- Built 1940
- Listed 24 days
Property features AI
Exterior
- Parking: Driveway
- Utilities: Sewer: Unknown; Water: See remarks
- Home design: Single family residence (House); One level
- Construction: Siding construction; Built in public records year
- Exterior features: Shingle roof
Interior
- Bathrooms: 1 bathroom
- Heating & cooling: Has heating (type: Other); Has cooling (type: Other)
- Interior features: Fixer condition
Neighborhood map
What this means for you Summary
Snapshot
- This is a 3-bed/1.0-bath single-family listed at $50k.
Deal economics
- At list price, monthly cash flow is $377 ($5k/yr) — positive.
- The deal already cash-flows at list — no discount required.
- Meets the 1% rule at list price ($1k rent vs $50k).
- Recommended offer: $49k (1.5% below list) — sets the bar for market timing.
- Cap rate 25.6% vs local median 6.8% in Moss Point — top-decile yield for the area; either an underpriced asset or a hidden risk that comps aren't pricing in. Stress-test before assuming the spread holds.
Location & tenants
- Location reads 67/100 on livability (#77 in MS) — a middle-class / working-renter tenant base. Strengths: cost of living A+, housing A+, crime A-; Watch: health & safety D+, schools D, amenities F.
- Moss Point Separate School District (suburban): math 17% / reading 22% proficiency, ranked #94 of 130 in MS (top 72%) — low school quality limits family demand, transient renter base, plan for 1-2y turnover; 83% free/reduced lunch — lower-income household profile, screen leases tightly.
- Market conditions: 86 active listings in the ZIP; 3 comparable units currently listed for rent nearby; rentals at typical pace (median 21d on market — plan ~3-4 weeks tenant-placement turnaround); 516 units permitted in Jackson County in 2024 (6 in 5+ unit buildings).
Forward outlook
- In year one you build about $3k of equity ($346 loan paydown + $2k appreciation (4.6% local appreciation)).
- At projected returns (4.6% appreciation + 3.0% rent growth), your $14k cash investment doubles in ~2 years — after that, you're playing with house money.
Negotiation context
- It's been on market 24 days — a 2% lower offer ($49k) is reasonable based on typical stale-listing flexibility.
- 3 sale attempts since 2y ago with the ask held roughly flat each time — persistent listings suggest the price (not the market) is what's stuck; bring a comps-based counter.
Risks & watch-outs
- Watch-outs: flood insurance adds $427/mo; built in 1940 — expect roof / HVAC / electrical / plumbing capex.
- Climate carrying-cost: in FEMA flood zone AE (mandatory federal flood insurance); severe wind risk, 99% chance of damaging wind over 30y; severe wildfire risk; extreme-heat days projected 7→22/yr by 2055 (HVAC capex compounding) — expect insurance premiums to compound above CPI over the hold.
Questions for the listing agent
- Built in 1940 — when were the roof, HVAC, electrical panel, plumbing, and water heater last replaced?
- What's the actual annual flood-insurance premium (NFIP or private), and is the property in a SFHA with mandatory coverage?
- Is there a deadline driving the sale (1031 exchange, divorce, estate, relocation)? That informs how much negotiation room exists.
- Schools are D-rated, which usually means shorter tenancies and higher turnover. Who's the typical renter profile here, and what's been the actual vacancy rate?
- What's the average days-on-market for RENTAL listings here right now (not sales)? A rising rental-DOM trend means longer vacancies and softer asking-rent achievability than the comps imply.
- What's the recent tenant-quality profile in this submarket — average credit score on applications, eviction rate, late-payment / NSF rate, and stable-employment percentage? A property-management company in the area should have these aggregated.
- How much new for-sale + rental construction is in the pipeline within 1–3 miles? Heavy new supply typically softens prices + rents 12–24 months out; constrained supply supports both.
Investment metrics
- 1% rule
- 2.95% ✓
- Cap rate
- 25.58%
- Cash-on-cash
- 68.88%
- DSCR
- 4.06
- GRM
- 2.8
CMA / ARV
- ARV (on-the-fly)
- $90,240
- Comps found
- 5
Show comp detail 5 sales within ~0.75 mi
| Address | Dist | Beds/Ba | Sqft | Sold | Price | $/sf | Match |
|---|---|---|---|---|---|---|---|
| 7112 Grierson St | 0.21mi | 2/1.0 (-1) | 1,169 (+4%) | 1mo | $45,000 | $38 | 79 |
| 4918 Martin St | 0.13mi | 3/1.0 | 1,118 (-1%) | 18mo | $100,000 | $89 | 77 |
| 5113 Valley St | 0.15mi | 3/2.0 | 1,046 (-7%) | 4mo | $59,900 | $57 | 73 |
| 7701 Harold Ave | 0.34mi | 3/1.5 | 1,188 (+5%) | 9mo | $144,500 | $122 | 66 |
| 4527 N Kreole Ave | 0.63mi | 3/1.0 | 1,120 (-1%) | 7mo | $89,900 | $80 | 64 |
Match score weights: distance 35% · size 25% · config 20% · recency 20%. Top-matched comps best support the ARV.
Projected returns pro-forma
4.6% appreciation · 3.0% rent growth · sell at horizon
- IRR
- 40.9%
- Equity multiple
- 3.48×
- Total profit
- $34,704
- Equity at exit
- $27,134
- IRR
- 39.5%
- Equity multiple
- 7.09×
- Total profit
- $85,276
- Equity at exit
- $45,865
Cash invested: $14,000 (down + closing). Projections, not guarantees.
Landlord ↔ Tenant lean methodology
- Overall (STATE)
- 90 Strongly Landlord-Friendly
- State Mississippi
- 90 Strongly Landlord-Friendly · R+11
- County
- — inherits STATE
- City
- — inherits STATE
ZIP-level market 39563
- Home prices YoY
- 3.0%
- Active inventory
- 86
- Price-to-rent
- 2.8×
Monthly cashflow live
- Estimated rent
- $1,473 medium interval (Pro) →
- Mortgage (P&I)
- −$262
- Tax from tax record
- −$77 /mo · $923/yr
- Insurance
- −$21
- Flood insurance flood zone
- −$427 /mo · $5,118/yr
- HOA
- −$0
- Vacancy / Maint / Mgmt
- −$309
- Net cashflow
- $377
Break-even live
UW: 25.0% down · 7.5% · 30yr · 1.5% tax · 5.0% vac · 8.0% maint · 8.0% mgmt
Financing live
Cash to close
- Down payment
- $12,500
- Closing costs
- $1,500
- Reserves months
- —
- Total cash needed
- —
Loan-product check · same deal, 3 products live
Conventional
25% down · 7.5% · 30yr
- Down + closing
- —
- Monthly P&I
- —
- Monthly cashflow
- —
- DSCR
- —
- Eligible?
- —
Personal DTI + credit; lowest rate.
DSCR
20% down · 8.5% · 30yr
- Down + closing
- —
- Monthly P&I
- —
- Monthly cashflow
- —
- DSCR
- —
- Eligible?
- —
No personal income docs; deal must DSCR.
Hard money
10% down · 12.0% · 12mo
- Down + closing
- —
- Monthly P&I
- —
- Monthly cashflow
- —
- DSCR
- —
- Eligible?
- —
Short-term bridge; refi at stabilization.
Rent comps 3 comps
| Address | Beds | Baths | Sqft | Rent | $/sqft | DOM | Units | Dist |
|---|---|---|---|---|---|---|---|---|
| 5019 East St Moss Point, MS | 4.0 | 2.0 | 1316 | $1,550 | $1.18 | 13d | 1 | 0.13mi |
| 4406 Richard St Moss Point, MS | 3.0 | 2.0 | 1120 | $1,300 | $1.16 | 21d | 1 | 0.96mi |
| 6331 Martin Luther King Blvd Moss Point, MS | 3.0 | 2.0 | 1327 | $995 | $0.75 | 21d | 1 | 1.25mi |
Listing history 24 events
-
2026-06-18days on market $50,000 Active 24 DOM
-
2026-06-17days on market $50,000 Active 23 DOM
-
2026-06-16days on market $50,000 Active 22 DOM
-
2026-06-15days on market $50,000 Active 21 DOM
-
2026-06-14days on market $50,000 Active 19 DOM
-
2026-06-13days on market $50,000 Active 18 DOM
-
2026-06-10days on market $50,000 Active 16 DOM
-
2026-06-09days on market $50,000 Active 15 DOM
-
2026-06-08days on market $50,000 Active 14 DOM
-
2026-06-07days on market $50,000 Active 13 DOM
-
2026-06-02days on market $50,000 Active 8 DOM
-
2026-06-01days on market $50,000 Active 7 DOM
-
2026-05-31days on market $50,000 Active 6 DOM
-
2026-05-30days on market $50,000 Active 5 DOM
-
2026-05-25$50,000 Active
-
2026-04-15historical
-
2026-04-13price $55,000
-
2026-03-08$65,000 Active
-
2025-12-31historical
-
2025-11-21price $65,000
-
2025-04-24price $75,000
-
2024-12-31$85,000 Active
-
2024-10-21soldstatus
-
2013-03-27soldstatus
ⓘ Source: listings_history table (triggers on properties + properties_extension) + one-shot
backfill from property_details.listing_events for pre-trigger history.
Tax reassessment forecast MS · Resets to sale price
- Current annual tax
- $923 · $77/mo
- Projected year-2 tax
- $923 · $77/mo
- Expected delta
- $0/yr ($0/mo · 0.0%)
ⓘ Screening estimate from a state-policy table — verify with the county assessor before closing.
Climate risk First Street
- Flood 8/10 Severe FEMA zone AE · 97% chance over 30 yrs
- Wildfire 8/10 Severe
- Heat 10/10 Extreme 7 d/yr ≥107°F today · 22 d/yr by 30 yrs out
- Wind 9/10 Extreme 99% chance of damaging wind over 30 yrs
- Air quality 3/10 Moderate 2 unhealthy d/yr today · 3 by 30 yrs out
Nearby sold comps map
Loading sold comps map…
Walkable amenities ~0.75 mi
Loading nearby amenities…
Taxation est. · year 1
- Rental income
- $17,674
- − Mortgage interest
- −$2,801
- − Property taxes
- −$923
- − Insurance
- −$5,368
- − Repairs & maintenance
- −$1,414
- − Management
- −$1,414
- − Depreciation
- −$1,455
- Taxable income
- $4,300
- Est. tax owed @ 24.0%
- −$1,032
- After-tax cash flow
- $3,493/yr
For passive investors: Depreciation is non-cash, so a rental often shows a tax loss while cash-flowing — sheltering income. Rental losses are passive: they offset passive income freely, and up to $25,000/yr can offset ordinary (W-2) income if you actively participate and your MAGI is under $100k (phasing out to $0 by $150k); unused losses carry forward. On sale, claimed depreciation is recaptured at up to 25%, and gains may owe capital-gains tax (a 1031 exchange can defer both). Figures are a year-1 estimate at your 24.0% rate — not tax advice; consult a CPA.
Schools (NCES district)
- District
- Moss Point Separate School District
- NCES district ID
- 2803000
- Math proficiency
- 17% ▼ -3.00%
- Reading proficiency
- 22% ▬ 0.00%
- Median HH income
- $38,041
- Composite
- 16.34/100
- National rank
- #9205
- State rank
- #94 of 130 in MS
Livability — Moss Point
- Score
- 67/100
- State rank
- #77
- US rank
- #10398
Category grades
Schools grade is shown separately in the Schools card above.
Census & demographics
- Census place
- Moss Point, MS
- City population
- 12,023
- Population (ZIP)
- 12,023
Population outlook (Jackson County) Hauer SSP2
- Today (2025)
- 146,926 people
- By 2030
- 148,442 · +1.0%
- By 2040
- 149,631 · +1.8%
- By 2050
- 148,723 · +1.2%
- By 2075
- 147,845 · +0.6%
- By 2100
- 144,510 · -1.6%
Race, ethnicity, and origin ACS 2023
- Neighborhood character
- Predominantly Black (74%)
- Race & ethnicity
- Black 74% White 18% Hispanic / Latino 4% Two or more races 2%
- Common ancestry
- Lithuanian 0%
- Foreign-born
- 1% · Canada
- Languages at home
- 97% English-only · Spanish 3%
Political lean MEDSL · Jackson
- 2024 margin
- Solid R (+39.9) · D 29.5% · R 69.4% · Other 1.1%
- 2008→2024 swing
- -6.4pp toward R · 2008: -33.5pp · 2024: -39.9pp
- All cycles
- 2024: R+39.9 2020: R+34.6 2016: R+39.9 2012: R+36.1 2008: R+33.5
Not yet ingested
- Civics
- —
Market trends
- HPI YoY
- ▲ 4.60%
- Current HPI
- 155.3138
- Rent YoY
- —
- Metro
- —
- State GDP YoY
- —
- F500 in state
- 0
Price history
-41.2% since first listed10 events — show timeline
- 2026-05-25 Listed $50,000 MLSU
- 2026-04-15 Listing Removed — MLSU
- 2026-04-13 Price Changed $55,000 MLSU
- 2026-03-08 Listed $65,000 MLSU
- 2025-12-31 Listing Removed — MLSU
- 2025-11-21 Price Changed $65,000 MLSU
- 2025-04-24 Price Changed $75,000 MLSU
- 2024-12-31 Listed $85,000 MLSU
- 2024-10-21 Sold (Public Records) — Public Records
- 2013-03-27 Sold (Public Records) — Public Records
Property tax history
+13.0%/yrLatest (2025): $923 · +8.3% YoY. Source: county tax records.
Cash-flow waterfall
monthlySold comps — $/sqft
last 12 mo · ≤1 miLoading sold comps…