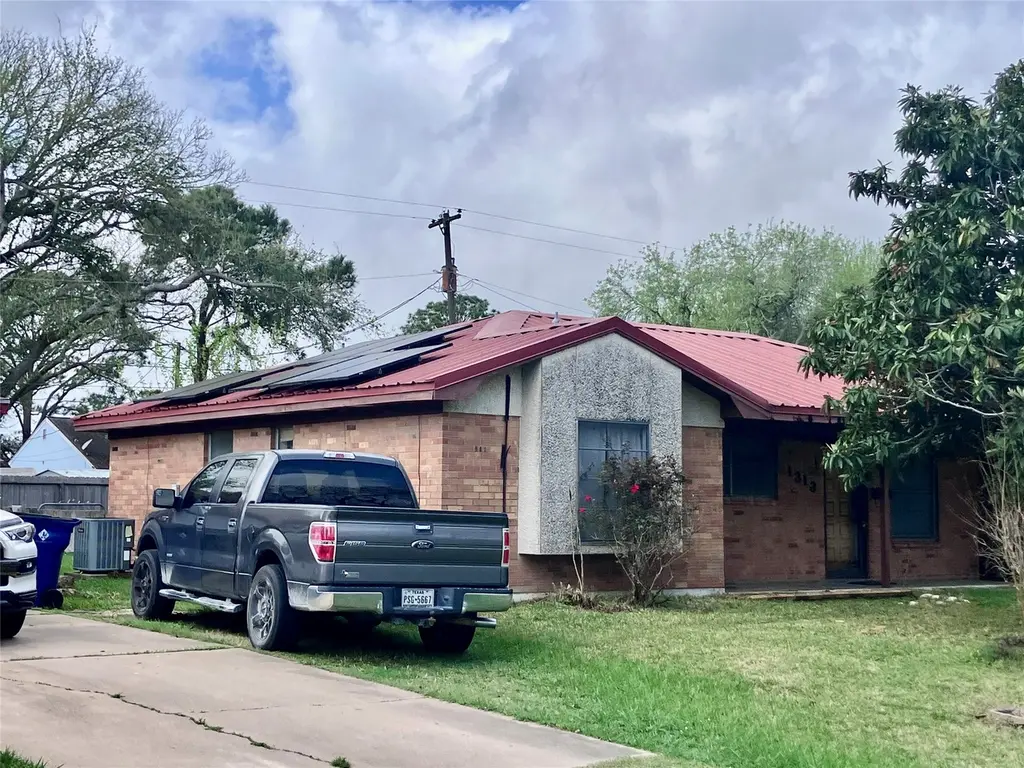
1313 N Noble Rd · Texas City, TX
Flood risk 6/10 · Moderate
- FEMA flood zone
- X (unshaded)
- Chance of flooding over 30 yrs
- 0.69%
- Est. flood insurance / yr
- $507 – $1,088
Fire risk 2/10 · Minimal
- Est. fire insurance / yr
- $1,222 – $2,270
Heat risk 10/10 · Severe
- Hot days now (above 110°F)
- 7 days/yr
- Hot days in 30 yrs
- 27 days/yr
Wind risk 10/10 · Severe
- Chance of severe wind over 30 yrs
- 99.0%
Air-quality risk 3/10 · Minor
- Unhealthy air days now
- 2 days/yr
- Unhealthy air days in 30 yrs
- 2 days/yr
Risk factors via First Street. Map © Google.
Why this score? — see what drove the D+ grade
The composite is a weighted blend of 9 inputs, each scored 0–100. Each bar is that input's sub-score; the figure is the points it added to the 100-point composite (weight × sub-score).
- Cash flow +12.9/30.0
- ARV discount +12.2/15.0
- 1% rule +4.6/10.0
- DSCR +3.8/10.0
- Rent growth +3.7/5.0
- Livability +3.1/5.0
- Condition / age +2.5/5.0
- Schools +2.4/10.0
- Appreciation +0.0/10.0
$149,900
🖨 Deal sheet (PDF) 📄 Offer letter ✓ Due diligence
Listing remarks MLS
Charming single-family home with 3 bedrooms and 1 bathroom. New roof in Nov. 2009, re-piped in Nov. 2013, and A/C replaced with 14 seer in May 2013. Some new flooring in living room, kitchen, and dining area. Separate storage building and a nice patio in the back. 1-car garage with carport in front. Lots of potential to make it your own. Built in 1970, this property sits on a 6010 square foot lot. Contact me for more information on this lovely home at 1313 Noble.
Key facts
- New flooring
- Re-piped
- Patio
Tags
Neighborhood map
What this means for you Summary
Snapshot
- This is a 3-bed/1.5-bath single-family listed at $150k.
Deal economics
- At list price, monthly cash flow is $-12 ($-142/yr) — negative.
- To cash-flow at today's rent, offer at most $148k (1.4% below list).
- To meet the 1% rule (rent ≥ 1% of price), the offer needs to be $144k (4.2% below list).
- Recommended offer: $136k (9.0% below list) — sets the bar for market timing.
- Cap rate 6.2% vs local median 4.3% in Texas City — top-decile yield for the area; either an underpriced asset or a hidden risk that comps aren't pricing in. Stress-test before assuming the spread holds.
Location & tenants
- Location reads 62/100 on livability (#907 in TX) — a middle-class / working-renter tenant base. Strengths: cost of living A+, housing A+; Watch: crime D+, schools F, amenities F.
- Texas City ISD (suburban): math 28% / reading 29% proficiency, ranked #655 of 826 in TX (top 79%) — low school quality limits family demand, transient renter base, plan for 1-2y turnover; 66% free/reduced lunch — lower-income household profile, screen leases tightly.
- Market conditions: Rents rising fast (+4.7%/yr); 240 active listings in the ZIP; 5 comparable units currently listed for rent nearby; rentals lingering (median 46d on market — plan ~5-8 weeks vacancy on turnover, expect pricing pressure); 60% of comp listings sitting > 30 days — soft ceiling on asking rent; 3,258 units permitted in Galveston County in 2024 (0 in 5+ unit buildings).
Forward outlook
- Local home prices are declining (-3.0%/yr); year-one equity from $1k of loan paydown is wiped out by about $4k of value loss. Plan a longer hold.
- Galveston County population projected at +43% by 2050 — long-run rental-demand tailwind backs the buy-and-hold thesis.
Negotiation context
- It's been on market 107 days — a 9% lower offer ($136k) is reasonable based on typical stale-listing flexibility.
- 2 sale attempts since 8y ago; this cycle's ask has dropped $38k (20%) from the opening price — seller is motivated, your offer sets the floor, not the list.
Risks & watch-outs
- Climate carrying-cost: major flood risk; severe wind risk, 99% chance of damaging wind over 30y; extreme-heat days projected 7→27/yr by 2055 (HVAC capex compounding) — expect insurance premiums to compound above CPI over the hold.
Questions for the listing agent
- What do current leases actually rent for vs. the listed asking? Can we see a recent rent roll and the last 12 months of T-12 income?
- It's been on market 107 days. Have you received any prior offers? Is the seller open to a 9% concession, seller financing, or rate buy-down credit?
- Built in 1970 — when were the roof, HVAC, electrical panel, plumbing, and water heater last replaced?
- Why hasn't it sold? Are there any deal-killer items the seller is aware of (foundation, flood, title, zoning, code violations)?
- Is there a deadline driving the sale (1031 exchange, divorce, estate, relocation)? That informs how much negotiation room exists.
- Schools are F-rated, which usually means shorter tenancies and higher turnover. Who's the typical renter profile here, and what's been the actual vacancy rate?
- Crime grade is D in this area — have there been break-ins, vandalism, or insurance claims at this property in the last 3 years? What carrier currently insures it and at what premium?
- The area grade is low — what's the realistic commute time and amenity access for the typical tenant pool here? Any planned neighborhood developments (good or bad) we should know about?
- What's the average days-on-market for RENTAL listings here right now (not sales)? A rising rental-DOM trend means longer vacancies and softer asking-rent achievability than the comps imply.
- What's the recent tenant-quality profile in this submarket — average credit score on applications, eviction rate, late-payment / NSF rate, and stable-employment percentage? A property-management company in the area should have these aggregated.
- How much new for-sale + rental construction is in the pipeline within 1–3 miles? Heavy new supply typically softens prices + rents 12–24 months out; constrained supply supports both.
Investment metrics
- 1% rule
- 0.96% ✗
- Cap rate
- 6.20%
- Cash-on-cash
- -0.34%
- DSCR
- 0.98
- GRM
- 8.7
CMA / ARV
- ARV (median comp)
- $167,246
- List price
- $149,900
- Delta
- -10.37%
- Verdict
- UNDERPRICED
- Comps
- 20 within 1.0 mi
Show comp detail 8 sales within ~0.75 mi
| Address | Dist | Beds/Ba | Sqft | Sold | Price | $/sf | Match |
|---|---|---|---|---|---|---|---|
| 1113 N Noble Rd | 0.11mi | 3/1.5 | 1,059 (-0%) | 3mo | $150,000 | $142 | 92 |
| 8510 Shiloh Dr | 0.09mi | 3/1.5 | 1,129 (+6%) | 1mo | $129,000 | $114 | 85 |
| 1118 N Noble Rd | 0.10mi | 3/2.0 | 1,102 (+4%) | 6mo | $199,700 | $181 | 82 |
| 1314 N Noble Rd | 0.03mi | 3/1.5 | 1,144 (+8%) | 12mo | $140,000 | $122 | 76 |
| 1213 N Natchez Dr | 0.09mi | 3/2.0 | 1,174 (+10%) | 3mo | $194,900 | $166 | 74 |
| 1122 N Natchez Dr | 0.12mi | 3/1.5 | 1,180 (+11%) | 5mo | $98,000 | $83 | 72 |
| 617 N Noble Rd | 0.44mi | 3/1.5 | 1,200 (+13%) | 0mo | $220,000 | $183 | 58 |
| 9222 Mackerel Dr | 0.73mi | 3/2.0 | 1,134 (+7%) | 21mo | $138,000 | $122 | 36 |
Match score weights: distance 35% · size 25% · config 20% · recency 20%. Top-matched comps best support the ARV.
Projected returns pro-forma
-3.0% appreciation · 4.67% rent growth · sell at horizon
- IRR
- -14.7%
- Equity multiple
- 0.46×
- Total profit
- $-22,501
- Equity at exit
- $22,351
- IRR
- -3.2%
- Equity multiple
- 0.77×
- Total profit
- $-9,789
- Equity at exit
- $12,961
Cash invested: $41,972 (down + closing). Projections, not guarantees.
Landlord ↔ Tenant lean methodology
- Overall (STATE)
- 87 Strongly Landlord-Friendly
- State Texas
- 87 Strongly Landlord-Friendly · R+5
- County
- — inherits STATE
- City
- — inherits STATE
ZIP-level market 77591
- Home prices YoY
- -5.6%
- Rents YoY
- 4.7%
- Active inventory
- 240
- Price-to-rent
- 8.7×
Monthly cashflow live
- Estimated rent
- $1,435 high interval (Pro) →
- Mortgage (P&I)
- −$786
- Tax from tax record
- −$297 /mo · $3,567/yr
- Insurance
- −$62
- HOA
- −$0
- Vacancy / Maint / Mgmt
- −$301
- Net cashflow
- $-12
Break-even live
Sensitivity live
| Price | -10% $73 | -5% $31 | +0% $-12 | +5% $-54 | +10% $-97 |
|---|---|---|---|---|---|
| Rent | -10% $-125 | -5% $-69 | +0% $-12 | +5% $45 | +10% $102 |
| Rate | -1.0pp $64 | -0.5pp $26 | base $-12 | +0.5pp $-51 | +1.0pp $-90 |
UW: 25.0% down · 7.5% · 30yr · 1.5% tax · 5.0% vac · 8.0% maint · 8.0% mgmt
Financing live
Cash to close
- Down payment
- $37,475
- Closing costs
- $4,497
- Reserves months
- —
- Total cash needed
- —
Loan-product check · same deal, 3 products live
Conventional
25% down · 7.5% · 30yr
- Down + closing
- —
- Monthly P&I
- —
- Monthly cashflow
- —
- DSCR
- —
- Eligible?
- —
Personal DTI + credit; lowest rate.
DSCR
20% down · 8.5% · 30yr
- Down + closing
- —
- Monthly P&I
- —
- Monthly cashflow
- —
- DSCR
- —
- Eligible?
- —
No personal income docs; deal must DSCR.
Hard money
10% down · 12.0% · 12mo
- Down + closing
- —
- Monthly P&I
- —
- Monthly cashflow
- —
- DSCR
- —
- Eligible?
- —
Short-term bridge; refi at stabilization.
Rent comps 5 comps
| Address | Beds | Baths | Sqft | Rent | $/sqft | DOM | Units | Dist |
|---|---|---|---|---|---|---|---|---|
| 8807 Emmett F Lowry Expy Texas City, TX | 2.0 | 2.0 | 987 | $1,105 | $1.12 | 46d | 1 | 0.23mi |
| 7561 Medical Center Dr Texas City, TX | 2.0 | 2.0 | 892 | $1,113 | $1.25 | 46d | 1 | 0.72mi |
| 9001 Glacier Ave Texas City, TX | 2.0 | 2.0 | 1062 | $1,180 | $1.11 | 0d | 4 | 0.77mi |
| 7510 Hummingbird Ln Texas City, TX | 3.0 | 1.5 | 1200 | $1,550 | $1.29 | 5d | 1 | 1.23mi |
| 6607 Memorial Dr Texas City, TX | 2.0 | 1.0 | 936 | $1,200 | $1.28 | 46d | 1 | 1.30mi |
Listing history 22 events
-
2026-06-21days on market $149,900 Active 107 DOM
-
2026-06-18days on market $149,900 Active 104 DOM
-
2026-06-17days on market $149,900 Active 103 DOM
-
2026-06-16days on market $149,900 Active 102 DOM
-
2026-06-15days on market $149,900 Active 101 DOM
-
2026-06-13days on market $149,900 Active 99 DOM
-
2026-06-09days on market $149,900 Active 95 DOM
-
2026-06-08days on market $149,900 Active 94 DOM
-
2026-06-07days on market $149,900 Active 93 DOM
-
2026-06-04days on market $149,900 Active 90 DOM
-
2026-06-03days on market $149,900 Active 89 DOM
-
2026-06-02days on market $149,900 Active 88 DOM
-
2026-06-01days on market $149,900 Active 87 DOM
-
2026-05-31days on market $149,900 Active 86 DOM
-
2026-05-02price $149,900 467-char remark
Show marketing remark (467 chars)
Charming single-family home with 3 bedrooms and 1 bathroom. New roof in Nov. 2009, re-piped in Nov. 2013, and A/C replaced with 14 seer in May 2013. Some new flooring in living room, kitchen, and dining area. Separate storage building and a nice patio in the back. 1-car garage with carport in front. Lots of potential to make it your own. Built in 1970, this property sits on a 6010 square foot lot. Contact me for more information on this lovely home at 1313 Noble.
-
2026-03-03$188,210 Active 467-char remark
Show marketing remark (467 chars)
Charming single-family home with 3 bedrooms and 1 bathroom. New roof in Nov. 2009, re-piped in Nov. 2013, and A/C replaced with 14 seer in May 2013. Some new flooring in living room, kitchen, and dining area. Separate storage building and a nice patio in the back. 1-car garage with carport in front. Lots of potential to make it your own. Built in 1970, this property sits on a 6010 square foot lot. Contact me for more information on this lovely home at 1313 Noble.
-
2018-07-02soldstatus Sold 290-char remark
Show marketing remark (290 chars)
Needs a little work. Some work already completed. New roof Nov. 2009, Re-piped Nov. 2013, and A/c replaced with 14 seer in May 2013. Some new flooring in living room, kitchen and dining area. Separate storage bldg. Nice patio in back. 1 car garage with carport in front. Lots of potential.
-
2018-07-02soldstatus
Show marketing remark (290 chars)
Needs a little work. Some work already completed. New roof Nov. 2009, Re-piped Nov. 2013, and A/c replaced with 14 seer in May 2013. Some new flooring in living room, kitchen and dining area. Separate storage bldg. Nice patio in back. 1 car garage with carport in front. Lots of potential.
-
2018-04-19status Pending 290-char remark
Show marketing remark (290 chars)
Needs a little work. Some work already completed. New roof Nov. 2009, Re-piped Nov. 2013, and A/c replaced with 14 seer in May 2013. Some new flooring in living room, kitchen and dining area. Separate storage bldg. Nice patio in back. 1 car garage with carport in front. Lots of potential.
-
2018-04-13status Option Pending 290-char remark
Show marketing remark (290 chars)
Needs a little work. Some work already completed. New roof Nov. 2009, Re-piped Nov. 2013, and A/c replaced with 14 seer in May 2013. Some new flooring in living room, kitchen and dining area. Separate storage bldg. Nice patio in back. 1 car garage with carport in front. Lots of potential.
-
2018-04-09$89,000 Active 290-char remark
Show marketing remark (290 chars)
Needs a little work. Some work already completed. New roof Nov. 2009, Re-piped Nov. 2013, and A/c replaced with 14 seer in May 2013. Some new flooring in living room, kitchen and dining area. Separate storage bldg. Nice patio in back. 1 car garage with carport in front. Lots of potential.
-
2008-10-30soldstatus
ⓘ Source: listings_history table (triggers on properties + properties_extension) + one-shot
backfill from property_details.listing_events for pre-trigger history.
Tax reassessment forecast TX · Resets to sale price
- Current annual tax
- $3,567 · $297/mo
- Projected year-2 tax
- $3,567 · $297/mo
- Expected delta
- $0/yr ($0/mo · 0.0%)
ⓘ Screening estimate from a state-policy table — verify with the county assessor before closing.
Climate risk First Street
- Flood 6/10 Major FEMA zone X (unshaded) · 69% chance over 30 yrs
- Wildfire 2/10 Low
- Heat 10/10 Extreme 7 d/yr ≥110°F today · 27 d/yr by 30 yrs out
- Wind 10/10 Extreme 99% chance of damaging wind over 30 yrs
- Air quality 3/10 Moderate 2 unhealthy d/yr today · 2 by 30 yrs out
Nearby sold comps map
Loading sold comps map…
Walkable amenities ~0.75 mi
Loading nearby amenities…
Taxation est. · year 1
- Rental income
- $17,225
- − Mortgage interest
- −$8,397
- − Property taxes
- −$3,567
- − Insurance
- −$750
- − Repairs & maintenance
- −$1,378
- − Management
- −$1,378
- − Depreciation
- −$4,361
- Taxable loss
- −$2,605
- Est. tax savings @ 24.0%
- +$625
- After-tax cash flow
- $483/yr
For passive investors: Depreciation is non-cash, so a rental often shows a tax loss while cash-flowing — sheltering income. Rental losses are passive: they offset passive income freely, and up to $25,000/yr can offset ordinary (W-2) income if you actively participate and your MAGI is under $100k (phasing out to $0 by $150k); unused losses carry forward. On sale, claimed depreciation is recaptured at up to 25%, and gains may owe capital-gains tax (a 1031 exchange can defer both). Figures are a year-1 estimate at your 24.0% rate — not tax advice; consult a CPA.
Schools (NCES district)
- District
- Texas City ISD
- NCES district ID
- 4842510
- Math proficiency
- 28% ▼ -10.00%
- Reading proficiency
- 29% ▼ -4.00%
- Median HH income
- $44,875
- Composite
- 24.47/100
- National rank
- #7664
- State rank
- #655 of 826 in TX
Livability — Texas City
- Score
- 62/100
- State rank
- #907
- US rank
- #16268
Category grades
Schools grade is shown separately in the Schools card above.
Census & demographics
- Census place
- Texas City, TX
- County
- Galveston County · 357,330 people
- City population
- 49,936
- Metro
- Houston-The Woodlands-Sugar Land, TX
- Population (ZIP)
- 18,294
- Household income
- $68,593
- Rent vs Own
- Severe rent burden
- 718.0
Population outlook (Galveston County) Hauer SSP2
- Today (2025)
- 390,640 people
- By 2030
- 425,226 · +8.9%
- By 2040
- 493,765 · +26.4%
- By 2050
- 559,698 · +43.3%
- By 2075
- 719,260 · +84.1%
- By 2100
- 819,628 · +109.8%
Race, ethnicity, and origin ACS 2023
- Neighborhood character
- Diverse neighborhood (Simpson 0.65)
- Race & ethnicity
- Black 50% White 26% Hispanic / Latino 19% Two or more races 9% Asian 2%
- Hispanic origin (detail)
- Mexican 15%
- Common ancestry
- Lithuanian 2% Romanian 1% Slovak 1%
- Foreign-born
- 7% · Canada, China
- Languages at home
- 88% English-only · Spanish 9% Other Indo-European 1% Chinese 1%
Political lean MEDSL · Galveston
- 2024 margin
- Strong R (+27.4) · D 35.7% · R 63.1% · Other 1.2%
- 2008→2024 swing
- -7.9pp toward R · 2008: -19.5pp · 2024: -27.4pp
- All cycles
- 2024: R+27.4 2020: R+22.6 2016: R+22.6 2012: R+26.9 2008: R+19.5
Not yet ingested
- Civics
- —
Market trends
- HPI YoY
- ▼ -14.63%
- Current HPI
- 247.1905
- Rent YoY
- ▲ 4.67%
- Metro
- Houston-The Woodlands-Sugar Land, TX
- State GDP YoY
- ▲ 3.95%
- F500 in state
- 110
Industry mix (Fortune 500 HQ in TX)
| Industry | F500 HQs | Revenue |
|---|---|---|
| Energy | 16 | $1,198B |
|
||
| Technology | 5 | $198B |
|
||
| Engineering / Construction | 4 | $72B |
|
||
| Energy Services | 3 | $60B |
|
||
| Utilities | 3 | $41B |
|
||
| Healthcare | 2 | $330B |
|
||
Price history
+68.4% since first listed8 events — show timeline
- 2026-05-02 Price Changed $149,900 HARMLS
- 2026-03-03 Listed $188,210 HARMLS
- 2018-07-02 Sold (Public Records) — Public Records
- 2018-07-02 Sold (MLS) — HARMLS
- 2018-04-19 Pending — HARMLS
- 2018-04-13 Pending — HARMLS
- 2018-04-09 Listed $89,000 HARMLS
- 2008-10-30 Sold (Public Records) — Public Records
Property tax history
+8.0%/yrLatest (2025): $3,567 · +11.6% YoY. Source: county tax records.
Cash-flow waterfall
monthlySold comps — $/sqft
last 12 mo · ≤1 miLoading sold comps…