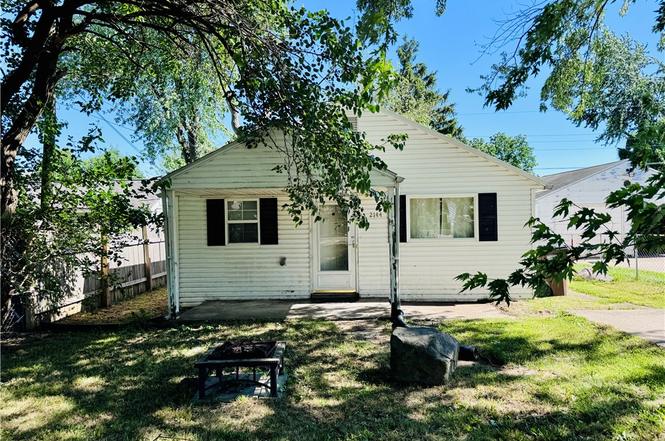
2144 Arthur Ave · Vandalia, OH
Flood risk 1/10 · Minimal
- FEMA flood zone
- X (unshaded)
- Chance of flooding over 30 yrs
- 0.0%
- Est. flood insurance / yr
- $507 – $1,088
Fire risk 1/10 · Minimal
- Est. fire insurance / yr
- $713 – $1,323
Heat risk 3/10 · Minor
- Hot days now (above 103°F)
- 7 days/yr
- Hot days in 30 yrs
- 18 days/yr
Wind risk 2/10 · Minimal
- Chance of severe wind over 30 yrs
- —
Air-quality risk 3/10 · Minor
- Unhealthy air days now
- 2 days/yr
- Unhealthy air days in 30 yrs
- 4 days/yr
Risk factors via First Street. Map © Google.
Why this score? — see what drove the A- grade
The composite is a weighted blend of 9 inputs, each scored 0–100. Each bar is that input's sub-score; the figure is the points it added to the 100-point composite (weight × sub-score).
- Cash flow +30.0/30.0
- ARV discount +15.0/15.0
- 1% rule +10.0/10.0
- DSCR +10.0/10.0
- Schools +5.0/10.0
- Rent growth +4.4/5.0
- Livability +3.5/5.0
- Condition / age +2.5/5.0
- Appreciation +0.0/10.0
$75,000
🖨 Deal sheet 📄 Offer letter ✓ Due diligence
Listing remarks
Quaint little bungalow in Harrison Township with 2 bedrooms, 1 large bathroom and an open concept floor plan with the living room open to the eat-in-kitchen with a perfect area for bar stools. No stairs anywhere. Central air. Large front yard which could be easily fenced in entirely with a gate. Long driveway for off-street parking. Home needs flooring, paint & a new roof.
Key facts
- Eat-in-kitchen
- Large front yard
- Long driveway
Tags
Property features AI
Finance
- Financial info: Offered for sale
Exterior
- Parking: No garage
- Utilities: Natural gas available; Public water; Public sewer
- Home design: Single-story home
- Construction: Vinyl siding
- Exterior features: Residential lot approximately 111' x 40'
Interior
- Kitchen: Eat-in kitchen; Microwave; Range; Refrigerator
- Bedrooms: Two main-level bedrooms (12 x 8 and 12 x 12)
- Bathrooms: One full bathroom on the main level
- Heating & cooling: Central air conditioning; Forced air heating (natural gas)
- Interior features: Crawl space basement
- Laundry & utility: Gas water heater
Neighborhood map
What this means for you Summary
Snapshot
- This is a 2-bed/1.0-bath single-family listed at $75k.
Deal economics
- At list price, monthly cash flow is $474 ($6k/yr) — positive.
- The deal already cash-flows at list — no discount required.
- Meets the 1% rule at list price ($1k rent vs $75k).
- Cap rate 13.9% vs local median 2.9% in Vandalia — top-decile yield for the area; either an underpriced asset or a hidden risk that comps aren't pricing in. Stress-test before assuming the spread holds.
Location & tenants
- Location reads 70/100 on livability (#463 in OH) — a middle-class / working-renter tenant base. Strengths: cost of living A+, housing A+, schools B+; Watch: amenities F, commute F, health & safety F.
- Market conditions: Rents rising fast (+7.4%/yr); 51 active listings in the ZIP; 6 comparable units currently listed for rent nearby; rentals leasing fast (median 3d on market — plan ~1-2 weeks tenant-placement turnaround); 907 units permitted in Montgomery County in 2024 (416 in 5+ unit buildings).
Forward outlook
- Local home prices are declining (-3.0%/yr); year-one equity from $519 of loan paydown is wiped out by about $2k of value loss. Plan a longer hold.
- Montgomery County population projected at -10% by 2050 — secular population decline; favor cash flow + early exit over multi-decade hold.
- At projected returns (-3.0% appreciation + 7.4% rent growth), your $21k cash investment doubles in ~4 years — after that, you're playing with house money.
Negotiation context
- Only 4 days on market — expect competitive offers; lowballing is unlikely to land.
- 2 sale attempts since 9y ago with the ask held roughly flat each time — persistent listings suggest the price (not the market) is what's stuck; bring a comps-based counter.
- Current owner paid $34k; list at $75k implies a 123% gain — meaningful room to come down on a strong offer.
Risks & watch-outs
- Watch-outs: built in 1955 — expect roof / HVAC / electrical / plumbing capex.
Questions for the listing agent
- Built in 1955 — when were the roof, HVAC, electrical panel, plumbing, and water heater last replaced?
- Is there a deadline driving the sale (1031 exchange, divorce, estate, relocation)? That informs how much negotiation room exists.
- Schools are B-rated — typically a magnet for longer-tenancy family renters. What's the average tenant stay here, and is there a school-zone premium baked into asking?
- What's the average days-on-market for RENTAL listings here right now (not sales)? A rising rental-DOM trend means longer vacancies and softer asking-rent achievability than the comps imply.
- What's the recent tenant-quality profile in this submarket — average credit score on applications, eviction rate, late-payment / NSF rate, and stable-employment percentage? A property-management company in the area should have these aggregated.
- How much new for-sale + rental construction is in the pipeline within 1–3 miles? Heavy new supply typically softens prices + rents 12–24 months out; constrained supply supports both.
Investment metrics
- 1% rule
- 1.72% ✓
- Cap rate
- 13.87%
- Cash-on-cash
- 27.06%
- DSCR
- 2.20
- GRM
- 4.9
CMA / ARV
- ARV (on-the-fly)
- $118,680
- Comps found
- 12
Show comp detail 12 sales within ~0.75 mi
| Address | Dist | Beds/Ba | Sqft | Sold | Price | $/sf | Match |
|---|---|---|---|---|---|---|---|
| 2203 Arthur Ave | 0.06mi | 3/1.0 (+1) | 957 (+4%) | 7mo | $130,000 | $136 | 80 |
| 2020 Wilding Ave | 0.21mi | 3/1.0 (+1) | 872 (-5%) | 0mo | $41,910 | $48 | 76 |
| 2211 Martin Ave | 0.30mi | 3/1.0 (+1) | 988 (+7%) | 2mo | $131,400 | $133 | 67 |
| 2213 Martin Ave | 0.30mi | 3/1.0 (+1) | 988 (+7%) | 3mo | $127,000 | $129 | 66 |
| 2234 Gipsy Dr | 0.45mi | 3/1.0 (+1) | 910 (-1%) | 8mo | $119,000 | $131 | 66 |
| 2017 Kildare Ave | 0.17mi | 3/1.0 (+1) | 832 (-10%) | 10mo | $155,000 | $186 | 62 |
| 2130 Nomad Ave | 0.39mi | 2/2.0 | 960 (+4%) | 12mo | $160,000 | $167 | 60 |
| 2234 Nomad Ave | 0.39mi | 3/1.0 (+1) | 960 (+4%) | 11mo | $111,000 | $116 | 60 |
| 2144 Nomad Ave | 0.38mi | 3/1.0 (+1) | 962 (+5%) | 15mo | $67,000 | $70 | 57 |
| 2328 Cardinal Ave | 0.53mi | 2/1.0 | 840 (-9%) | 13mo | $32,000 | $38 | 50 |
| 2108 Gipsy Dr | 0.45mi | 3/1.0 (+1) | 1,053 (+14%) | 4mo | $54,670 | $52 | 46 |
| 2240 Cardinal Ave | 0.51mi | 2/1.0 | 816 (-11%) | 14mo | $68,500 | $84 | 46 |
Match score weights: distance 35% · size 25% · config 20% · recency 20%. Top-matched comps best support the ARV.
Projected returns pro-forma
-3.0% appreciation · 7.41% rent growth · sell at horizon
- IRR
- 26.1%
- Equity multiple
- 2.14×
- Total profit
- $24,012
- Equity at exit
- $11,183
- IRR
- 36.4%
- Equity multiple
- 5.13×
- Total profit
- $86,729
- Equity at exit
- $6,485
Cash invested: $21,000 (down + closing). Projections, not guarantees.
Landlord ↔ Tenant lean methodology
- Overall (STATE)
- 73 Landlord-Friendly
- State Ohio
- 73 Landlord-Friendly · R+6
- County
- — inherits STATE
- City
- — inherits STATE
ZIP-level market 45414
- Rents YoY
- 7.4%
- Active inventory
- 51
- Price-to-rent
- 4.9×
Monthly cashflow live
- Estimated rent
- $1,289 high interval (Pro) →
- Mortgage (P&I)
- −$393
- Tax from tax record
- −$120 /mo · $1,439/yr
- Insurance
- −$31
- HOA
- −$0
- Vacancy / Maint / Mgmt
- −$271
- Net cashflow
- $474
Break-even live
UW: 25.0% down · 7.5% · 30yr · 1.5% tax · 5.0% vac · 8.0% maint · 8.0% mgmt
Financing live
Cash to close
- Down payment
- $18,750
- Closing costs
- $2,250
- Reserves months
- —
- Total cash needed
- —
Loan-product check · same deal, 3 products live
Conventional
25% down · 7.5% · 30yr
- Down + closing
- —
- Monthly P&I
- —
- Monthly cashflow
- —
- DSCR
- —
- Eligible?
- —
Personal DTI + credit; lowest rate.
DSCR
20% down · 8.5% · 30yr
- Down + closing
- —
- Monthly P&I
- —
- Monthly cashflow
- —
- DSCR
- —
- Eligible?
- —
No personal income docs; deal must DSCR.
Hard money
10% down · 12.0% · 12mo
- Down + closing
- —
- Monthly P&I
- —
- Monthly cashflow
- —
- DSCR
- —
- Eligible?
- —
Short-term bridge; refi at stabilization.
Rent comps 6 comps
| Address | Beds | Baths | Sqft | Rent | $/sqft | DOM | Units | Dist |
|---|---|---|---|---|---|---|---|---|
| 2109 Harding Ave Dayton, OH | 2.0 | 1.0 | 750 | $950 | $1.27 | 3d | 1 | 0.15mi |
| 2022 Arthur Ave Unit NA Dayton, OH | 3.0 | 1.0 | 1040 | $1,500 | $1.44 | 11d | 1 | 0.16mi |
| 5900 Erica Ct Dayton, OH | 2.0 | 1.0 | 800 | $975 | $1.22 | 3d | 1 | 0.23mi |
| 2991 Benchwood Rd Unit 2993 Dayton, OH | 2.0 | 1.5 | 1063 | $1,295 | $1.22 | 3d | 1 | 1.05mi |
| 3097 Silver Rock Ave Unit 3103 Dayton, OH | 2.0 | 1.5 | 1035 | $1,295 | $1.25 | 14d | 1 | 1.11mi |
| 4911 Northcutt Pl Dayton, OH | 2.0 | 1.0 | 850 | $825 | $0.97 | 3d | 1 | 1.19mi |
Listing history 6 events
-
2026-06-18status $75,000 Active 4 DOM
-
2026-06-18days on market $75,000 ActiveUnderContract 4 DOM
-
2026-06-17statusdays on market $75,000 ActiveUnderContract 3 DOM
-
2026-06-16days on market $75,000 Active 2 DOM
-
2026-06-15remarks 377-char remark
-
2026-06-15$75,000 Active 1 DOM
ⓘ Source: listings_history table (triggers on properties + properties_extension) + one-shot
backfill from property_details.listing_events for pre-trigger history.
Tax reassessment forecast OH · Partial reset (capped growth)
- Current annual tax
- $1,439 · $120/mo
- Projected year-2 tax
- $1,439 · $120/mo
- Expected delta
- $0/yr ($0/mo · 0.0%)
ⓘ Screening estimate from a state-policy table — verify with the county assessor before closing.
Climate risk First Street
- Flood 1/10 Low FEMA zone X (unshaded) · 0% chance over 30 yrs
- Wildfire 1/10 Low
- Heat 3/10 Moderate 7 d/yr ≥103°F today · 18 d/yr by 30 yrs out
- Wind 2/10 Low
- Air quality 3/10 Moderate 2 unhealthy d/yr today · 4 by 30 yrs out
Nearby sold comps map
Loading sold comps map…
Walkable amenities ~0.75 mi
Loading nearby amenities…
Taxation est. · year 1
- Rental income
- $15,463
- − Mortgage interest
- −$4,201
- − Property taxes
- −$1,439
- − Insurance
- −$375
- − Repairs & maintenance
- −$1,237
- − Management
- −$1,237
- − Depreciation
- −$2,182
- Taxable income
- $4,792
- Est. tax owed @ 24.0%
- −$1,150
- After-tax cash flow
- $4,532/yr
For passive investors: Depreciation is non-cash, so a rental often shows a tax loss while cash-flowing — sheltering income. Rental losses are passive: they offset passive income freely, and up to $25,000/yr can offset ordinary (W-2) income if you actively participate and your MAGI is under $100k (phasing out to $0 by $150k); unused losses carry forward. On sale, claimed depreciation is recaptured at up to 25%, and gains may owe capital-gains tax (a 1031 exchange can defer both). Figures are a year-1 estimate at your 24.0% rate — not tax advice; consult a CPA.
Schools (NCES district)
No district data.
Livability — Vandalia
- Score
- 70/100
- State rank
- #463
- US rank
- #7669
Category grades
Schools grade is shown separately in the Schools card above.
Census & demographics
- County
- Montgomery County · 459,541 people
- City population
- 14,888
- Metro
- Dayton-Kettering, OH
- Population (ZIP)
- 21,167
- Household income
- $54,485
- Rent vs Own
- Severe rent burden
- 801.0
Population outlook (Montgomery County) Hauer SSP2
- Today (2025)
- 523,241 people
- By 2030
- 514,948 · -1.6%
- By 2040
- 493,378 · -5.7%
- By 2050
- 469,639 · -10.2%
- By 2075
- 418,360 · -20.0%
- By 2100
- 353,315 · -32.5%
Race, ethnicity, and origin ACS 2023
- Neighborhood character
- Predominantly White (75%)
- Race & ethnicity
- White 75% Black 15% Two or more races 6% Hispanic / Latino 4% Asian 1%
- Common ancestry
- Slovak 2% Romanian 2% Italian 2%
- Foreign-born
- 4% · Canada
- Languages at home
- 94% English-only · Spanish 2% Arabic 1% Tagalog/Filipino 1%
Political lean MEDSL · Montgomery
- 2024 margin
- Toss-up / Even · D 49.8% · R 49.3%
- 2008→2024 swing
- -5.8pp toward R · 2008: 6.2pp · 2024: 0.5pp
- All cycles
- 2024: D+0.5 2020: D+2.2 2016: R+1.2 2012: D+3.1 2008: D+6.2
Not yet ingested
- Civics
- —
Market trends
- HPI YoY
- ▼ -142.46%
- Current HPI
- 183.1124
- Rent YoY
- ▲ 7.41%
- Metro
- Dayton-Kettering, OH
- State GDP YoY
- ▲ 1.98%
- F500 in state
- 48
Industry mix (Fortune 500 HQ in OH)
| Industry | F500 HQs | Revenue |
|---|---|---|
| Insurance | 3 | $145B |
|
||
| Industrial Machinery | 3 | $49B |
|
||
| Financial Services | 3 | $24B |
|
||
| Consumer Goods | 2 | $93B |
|
||
| Aerospace / Defense | 2 | $47B |
|
||
| Utilities | 2 | $33B |
|
||
Price history
+127.3% since first listed10 events — show timeline
- 2026-06-14 Listed $75,000 Dayton MLS
- 2020-02-03 Sold (Public Records) $33,600 Public Records
- 2017-07-13 Sold (Public Records) $27,500 Public Records
- 2017-07-05 Listing Removed — Dayton MLS
- 2017-06-27 Price Changed $39,900 Dayton MLS
- 2017-06-06 Price Changed $43,900 Dayton MLS
- 2017-05-23 Listed $44,900 Dayton MLS
- 2006-01-25 Sold (Public Records) $71,900 Public Records
- 1998-05-06 Sold (Public Records) $44,000 Public Records
- 1993-08-19 Sold (Public Records) $33,000 Public Records
Property tax history
+46.2%/yrLatest (2025): $1,439 · +2.2% YoY. Source: county tax records.
Cash-flow waterfall
monthlySold comps — $/sqft
last 12 mo · ≤1 miLoading sold comps…