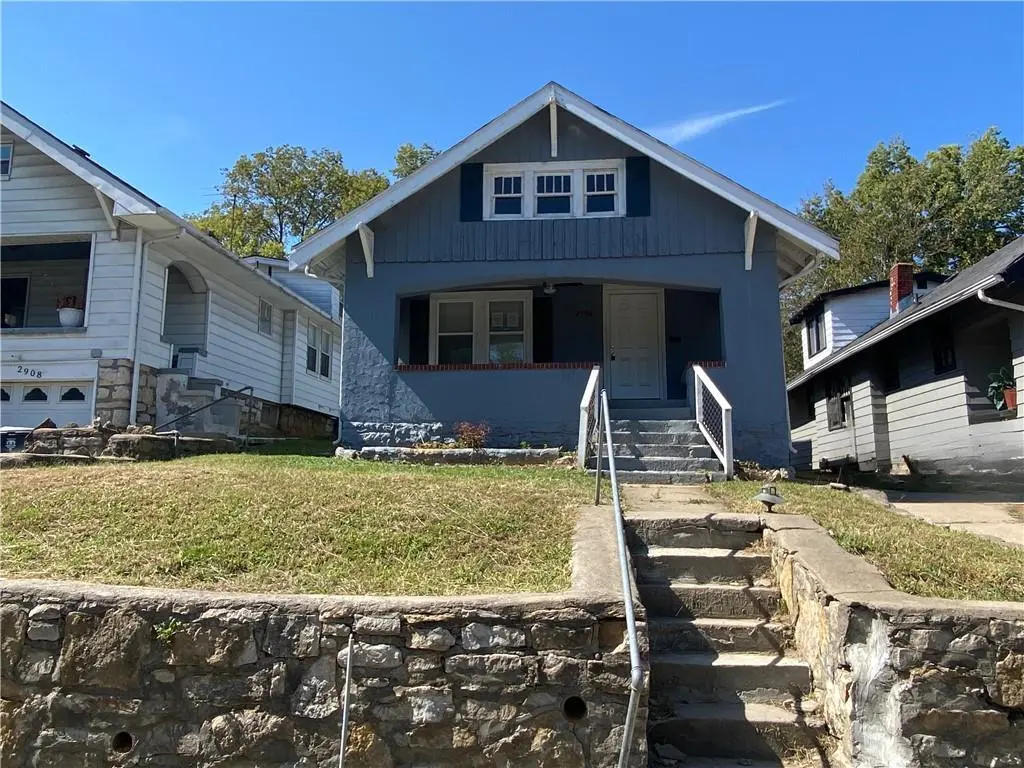
2906 Bales Ave · Kansas City, MO
Flood risk 1/10 · Minimal
- FEMA flood zone
- X (unshaded)
- Chance of flooding over 30 yrs
- 0.0%
- Est. flood insurance / yr
- $473 – $860
Fire risk 1/10 · Minimal
- Est. fire insurance / yr
- $1,054 – $1,958
Heat risk 4/10 · Minor
- Hot days now (above 106°F)
- 7 days/yr
- Hot days in 30 yrs
- 16 days/yr
Wind risk 2/10 · Minimal
- Chance of severe wind over 30 yrs
- —
Air-quality risk 3/10 · Minor
- Unhealthy air days now
- 2 days/yr
- Unhealthy air days in 30 yrs
- 3 days/yr
Risk factors via First Street. Map © Google.
Why this score? — see what drove the A grade
The composite is a weighted blend of 9 inputs, each scored 0–100. Each bar is that input's sub-score; the figure is the points it added to the 100-point composite (weight × sub-score).
- Cash flow +30.0/30.0
- ARV discount +15.0/15.0
- DSCR +10.0/10.0
- Appreciation +10.0/10.0
- 1% rule +9.1/10.0
- Livability +3.9/5.0
- Rent growth +3.7/5.0
- Condition / age +2.5/5.0
- Schools +1.5/10.0
$94,900
🖨 Deal sheet 📄 Offer letter ✓ Due diligence
Listing remarks MLS
Charming and move-in ready, this 3-bedroom, 1-bath home in Kansas City, MO features fresh updates throughout, including neutral décor and solid-surface countertops in the modern kitchen. Enjoy a covered front porch for relaxing, a spacious full basement for storage or expansion, and a private second-floor primary bedroom for added comfort.
Key facts
- Covered front porch
- 4,404 sq ft lot
- Built 1925
Tags
Neighborhood map
What this means for you Summary
Snapshot
- This is a 3-bed/1.0-bath single-family listed at $95k.
Deal economics
- At list price, monthly cash flow is $472 ($6k/yr) — positive.
- The deal already cash-flows at list — no discount required.
- Meets the 1% rule at list price ($1k rent vs $95k).
- Recommended offer: $84k (12.0% below list) — sets the bar for market timing.
- Cap rate 12.3% vs local median 3.9% in Kansas City — top-decile yield for the area; either an underpriced asset or a hidden risk that comps aren't pricing in. Stress-test before assuming the spread holds.
Location & tenants
- Location reads 78/100 on livability (#28 in MO, #2,671 nationally) — a middle-class / working-renter tenant base. Strengths: amenities A+, commute A+, cost of living A+; Watch: schools C-, crime F.
- Kansas City 33 (urban): math 12% / reading 24% proficiency, ranked #308 of 324 in MO (top 95%) — low school quality limits family demand, transient renter base, plan for 1-2y turnover; 75% free/reduced lunch — lower-income household profile, screen leases tightly.
- Market conditions: Rents rising fast (+4.7%/yr); 86 active listings in the ZIP; 40 comparable units currently listed for rent nearby; rentals at typical pace (median 24d on market — plan ~3-4 weeks tenant-placement turnaround); lower-income renter base — watch delinquency; 4,002 units permitted in Jackson County in 2024 (2,271 in 5+ unit buildings).
- This rent runs 44% of the median local income ($36k/yr) — at the standard rent-burdened threshold; future hikes will face affordability resistance.
Forward outlook
- In year one you build about $10k of equity ($656 loan paydown + $9k appreciation (10.0% local appreciation)).
- Jackson County population projected at +4% by 2050 — modest demand growth; plan on rents tracking national, not racing it.
- At projected returns (10.0% appreciation + 4.7% rent growth), your $27k cash investment doubles in ~2 years — after that, you're playing with house money.
- By year 4, paydown + projected appreciation supports a ~$36k cash-out refi (75% LTV) — recoverable capital for the next deal without selling this one.
Negotiation context
- It's been on market 235 days — a 12% lower offer ($84k) is reasonable based on typical stale-listing flexibility.
- 4 sale attempts since 17y ago; this cycle's ask has dropped $55k (37%) from the opening price — seller is motivated, your offer sets the floor, not the list.
Risks & watch-outs
- Watch-outs: built in 1925 — expect roof / HVAC / electrical / plumbing capex.
Questions for the listing agent
- It's been on market 235 days. Have you received any prior offers? Is the seller open to a 12% concession, seller financing, or rate buy-down credit?
- Built in 1925 — when were the roof, HVAC, electrical panel, plumbing, and water heater last replaced?
- Why hasn't it sold? Are there any deal-killer items the seller is aware of (foundation, flood, title, zoning, code violations)?
- Is there a deadline driving the sale (1031 exchange, divorce, estate, relocation)? That informs how much negotiation room exists.
- Crime grade is F in this area — have there been break-ins, vandalism, or insurance claims at this property in the last 3 years? What carrier currently insures it and at what premium?
- What's the average days-on-market for RENTAL listings here right now (not sales)? A rising rental-DOM trend means longer vacancies and softer asking-rent achievability than the comps imply.
- What's the recent tenant-quality profile in this submarket — average credit score on applications, eviction rate, late-payment / NSF rate, and stable-employment percentage? A property-management company in the area should have these aggregated.
- How much new for-sale + rental construction is in the pipeline within 1–3 miles? Heavy new supply typically softens prices + rents 12–24 months out; constrained supply supports both.
Investment metrics
- 1% rule
- 1.41% ✓
- Cap rate
- 12.27%
- Cash-on-cash
- 21.34%
- DSCR
- 1.95
- GRM
- 5.9
CMA / ARV
- ARV (median comp)
- $134,296
- List price
- $94,900
- Delta
- -29.34%
- Verdict
- UNDERPRICED
- Comps
- 20 within 1.0 mi
Show comp detail 12 sales within ~0.75 mi
| Address | Dist | Beds/Ba | Sqft | Sold | Price | $/sf | Match |
|---|---|---|---|---|---|---|---|
| 2922 E 30th St | 0.31mi | 3/1.0 | 1,364 (-5%) | 3mo | $73,600 | $54 | 74 |
| 2850 Mersington Ave | 0.25mi | 3/2.0 | 1,382 (-4%) | 10mo | $119,500 | $86 | 70 |
| 3706 E 29th St | 0.16mi | 3/1.0 | 1,248 (-13%) | 2mo | $95,000 | $76 | 69 |
| 3023 College Ave | 0.18mi | 3/1.5 | 1,320 (-8%) | 9mo | $40,000 | $30 | 68 |
| 2512 Mersington Ave | 0.55mi | 4/1.5 (+1) | 1,500 (+4%) | 6mo | $72,000 | $48 | 55 |
| 3026 Walrond Ave | 0.25mi | 2/1.0 (-1) | 1,244 (-14%) | 8mo | $55,000 | $44 | 54 |
| 3341 Chestnut Ave | 0.70mi | 3/1.0 | 1,366 (-5%) | 10mo | $80,000 | $59 | 51 |
| 2334 Walrond Ave | 0.72mi | 3/1.5 | 1,370 (-5%) | 8mo | $59,000 | $43 | 50 |
| 3422 Askew Ave | 0.66mi | 3/1.0 | 1,226 (-15%) | 4mo | $114,900 | $94 | 41 |
| 2636 Spruce St | 0.58mi | 4/2.0 (+1) | 1,282 (-11%) | 7mo | $199,000 | $155 | 40 |
| 2455 Montgall Ave | 0.72mi | 3/2.0 | 1,256 (-13%) | 13mo | $170,000 | $135 | 31 |
| 2456 Spruce Ave | 0.72mi | 2/2.0 (-1) | 1,625 (+13%) | 11mo | $105,000 | $65 | 26 |
Match score weights: distance 35% · size 25% · config 20% · recency 20%. Top-matched comps best support the ARV.
Projected returns pro-forma
10.0% appreciation · 4.65% rent growth · sell at horizon
- IRR
- 41.1%
- Equity multiple
- 4.16×
- Total profit
- $84,006
- Equity at exit
- $85,493
- IRR
- 36.0%
- Equity multiple
- 9.60×
- Total profit
- $228,563
- Equity at exit
- $184,370
Cash invested: $26,572 (down + closing). Projections, not guarantees.
Landlord ↔ Tenant lean methodology
- Overall (STATE)
- 81 Strongly Landlord-Friendly
- State Missouri
- 81 Strongly Landlord-Friendly · R+10
- County
- — inherits STATE
- City
- — inherits STATE
ZIP-level market 64128
- Home prices YoY
- 21.6%
- Rents YoY
- 4.7%
- Active inventory
- 86
- Price-to-rent
- 5.9×
Monthly cashflow live
- Estimated rent
- $1,336 high interval (Pro) →
- Mortgage (P&I)
- −$498
- Tax from tax record
- −$46 /mo · $548/yr
- Insurance
- −$40
- HOA
- −$0
- Vacancy / Maint / Mgmt
- −$281
- Net cashflow
- $472
Break-even live
UW: 25.0% down · 7.5% · 30yr · 1.5% tax · 5.0% vac · 8.0% maint · 8.0% mgmt
Financing live
Cash to close
- Down payment
- $23,725
- Closing costs
- $2,847
- Reserves months
- —
- Total cash needed
- —
Loan-product check · same deal, 3 products live
Conventional
25% down · 7.5% · 30yr
- Down + closing
- —
- Monthly P&I
- —
- Monthly cashflow
- —
- DSCR
- —
- Eligible?
- —
Personal DTI + credit; lowest rate.
DSCR
20% down · 8.5% · 30yr
- Down + closing
- —
- Monthly P&I
- —
- Monthly cashflow
- —
- DSCR
- —
- Eligible?
- —
No personal income docs; deal must DSCR.
Hard money
10% down · 12.0% · 12mo
- Down + closing
- —
- Monthly P&I
- —
- Monthly cashflow
- —
- DSCR
- —
- Eligible?
- —
Short-term bridge; refi at stabilization.
Rent comps 40 comps
| Address | Beds | Baths | Sqft | Rent | $/sqft | DOM | Units | Dist |
|---|---|---|---|---|---|---|---|---|
| 3220 E 30th St Unit 1A Kansas City, MO | 2.0 | 1.0 | 1214 | $950 | $0.78 | 43d | 1 | 0.15mi |
| 3205 E 31st St Kansas City, MO | 4.0 | 1.0 | 1800 | $1,325 | $0.74 | 23d | 1 | 0.29mi |
| 2846 Myrtle Ave Kansas City, MO | 3.0 | 2.0 | 1705 | $1,350 | $0.79 | 16d | 1 | 0.33mi |
| 2637 E 29th St Unit 3 Kansas City, MO | 2.0 | 1.0 | 954 | $1,050 | $1.10 | 43d | 1 | 0.43mi |
| 3305 Askew Ave Kansas City, MO | 3.0 | 1.5 | 1428 | $1,450 | $1.02 | 23d | 1 | 0.51mi |
| 3304 Agnes Ave Unit Downstairs Kansas City, MO | 3.0 | 1.0 | 1150 | $1,095 | $0.95 | 43d | 1 | 0.58mi |
| 2419 Bales Ave Kansas City, MO | 3.0 | 1.5 | 1116 | $1,500 | $1.34 | 3d | 1 | 0.63mi |
| 3330 Agnes Ave Kansas City, MO | 3.0 | 1.0 | 1000 | $1,410 | $1.41 | 43d | 1 | 0.63mi |
| 2413 College Ave Kansas City, MO | 2.0 | 2.0 | 1022 | $1,225 | $1.20 | 23d | 1 | 0.65mi |
| 3419 College Ave Kansas City, MO | 4.0 | 1.0 | 1608 | $1,300 | $0.81 | 2d | 1 | 0.66mi |
| 3346 Agnes Ave Kansas City, MO | 3.0 | 1.0 | 1400 | $1,200 | $0.86 | 7d | 1 | 0.67mi |
| 3332 Norton Ave Kansas City, MO | 3.0 | 1.0 | 1272 | $1,350 | $1.06 | 43d | 1 | 0.69mi |
| 2708 Olive St Kansas City, MO | 4.0 | 2.0 | 1585 | $1,500 | $0.95 | 17d | 1 | 0.70mi |
| 2424 Norton Ave Unit B Kansas City, MO | 3.0 | 1.0 | 982 | $1,150 | $1.17 | 16d | 1 | 0.70mi |
| 3032 Elmwood Ave Kansas City, MO | 3.0 | 1.0 | 1027 | $1,275 | $1.24 | 7d | 1 | 0.73mi |
| 2724 Brooklyn Ave Kansas City, MO | 3.0 | 2.5 | 1398 | $1,440 | $1.03 | 23d | 1 | 0.81mi |
| 3434 Chestnut Ave Kansas City, MO | 2.0 | 1.0 | 1512 | $1,100 | $0.73 | 10d | 1 | 0.81mi |
| 3525 Monroe Ave Kansas City, MO | 3.0 | 2.0 | 1569 | $1,500 | $0.96 | 43d | 1 | 0.83mi |
| 3009 Garfield Ave Kansas City, MO | 3.0 | 1.5 | 1334 | $1,425 | $1.07 | 43d | 1 | 0.83mi |
| 3233 Park Ave Unit 2 Kansas City, MO | 2.0 | 1.0 | 950 | $1,000 | $1.05 | 23d | 1 | 0.83mi |
| 3233 Park Ave Unit 1 Kansas City, MO | 2.0 | 1.0 | 950 | $1,075 | $1.13 | 43d | 1 | 0.83mi |
| 3524 Bellefontaine Ave Kansas City, MO | 3.0 | 1.0 | 1228 | $1,350 | $1.10 | 43d | 1 | 0.84mi |
| 2120 Linwood Blvd Kansas City, MO | 3.0 | 1.0 | 1326 | $1,400 | $1.06 | 43d | 1 | 0.86mi |
| 3414 Elmwood Ave Kansas City, MO | 4.0 | 1.0 | 1109 | $1,300 | $1.17 | 16d | 1 | 0.96mi |
| 2900 E 21st St Kansas City, MO | 3.0 | 1.5 | 897 | $1,650 | $1.84 | 16d | 1 | 0.99mi |
| 3630 Agnes Ave Kansas City, MO | 3.0 | 2.0 | 1448 | $1,500 | $1.04 | 10d | 1 | 0.99mi |
| 3201 E 20th St Kansas City, MO | 2.0 | 1.0 | 900 | $1,050 | $1.17 | 23d | 1 | 1.03mi |
| 3713 Cleveland Ave Kansas City, MO | 4.0 | 1.0 | 1256 | $1,250 | $1.00 | 16d | 1 | 1.05mi |
| 5108 E 30th St Kansas City, MO | 3.0 | 1.0 | 960 | $1,400 | $1.46 | 3d | 1 | 1.06mi |
| 3739 Bales Ave Kansas City, MO | 3.0 | 2.0 | 1400 | $1,575 | $1.12 | 23d | 1 | 1.10mi |
| 2018 E 35th St Kansas City, MO | 3.0 | 2.0 | 1502 | $1,800 | $1.20 | 3d | 1 | 1.11mi |
| 2002 E 35th St Kansas City, MO | 3.0 | 2.0 | 1426 | $1,295 | $0.91 | 7d | 1 | 1.13mi |
| 3710 Wabash Ave Unit 2S Kansas City, MO | 2.0 | 1.0 | 875 | $850 | $0.97 | 23d | 1 | 1.14mi |
| 3305 E 19th St Kansas City, MO | 2.0 | 1.0 | 1500 | $1,200 | $0.80 | 43d | 1 | 1.14mi |
| 2003 Wabash Ave Unit B Kansas City, MO | 3.0 | 2.0 | 1200 | $1,095 | $0.91 | 23d | 1 | 1.15mi |
| 3818 Indiana Ave Kansas City, MO | 3.0 | 1.5 | 1223 | $1,147 | $0.94 | 43d | 1 | 1.16mi |
| 3817 S Benton Ave Kansas City, MO | 4.0 | 1.5 | 1380 | $1,650 | $1.20 | 23d | 1 | 1.20mi |
| 3243 Denver Dr Kansas City, MO | 1.0–3.0 | 1.0 | 862 | $1,226 | $1.42 | 43d | 1 | 1.22mi |
| 1905 Kensington Ave Kansas City, MO | 3.0 | 2.0 | 1285 | $1,325 | $1.03 | 23d | 1 | 1.24mi |
| 3840 Bellefontaine Ave Kansas City, MO | 3.0 | 1.0 | 1500 | $1,500 | $1.00 | 16d | 1 | 1.24mi |
Listing history 13 events
-
2026-04-13price $109,900 348-char remark
Show marketing remark (348 chars)
Charming and move-in ready, this 3-bedroom, 1-bath home in Kansas City, MO features fresh updates throughout, including neutral décor and solid-surface countertops in the modern kitchen. Enjoy a covered front porch for relaxing, a spacious full basement for storage or expansion, and a private second-floor primary bedroom for added comfort.
-
2026-01-13price $124,900 348-char remark
Show marketing remark (348 chars)
Charming and move-in ready, this 3-bedroom, 1-bath home in Kansas City, MO features fresh updates throughout, including neutral décor and solid-surface countertops in the modern kitchen. Enjoy a covered front porch for relaxing, a spacious full basement for storage or expansion, and a private second-floor primary bedroom for added comfort.
-
2025-11-18price $134,900 348-char remark
Show marketing remark (348 chars)
Charming and move-in ready, this 3-bedroom, 1-bath home in Kansas City, MO features fresh updates throughout, including neutral décor and solid-surface countertops in the modern kitchen. Enjoy a covered front porch for relaxing, a spacious full basement for storage or expansion, and a private second-floor primary bedroom for added comfort.
-
2025-10-03$149,900 Active 348-char remark
Show marketing remark (348 chars)
Charming and move-in ready, this 3-bedroom, 1-bath home in Kansas City, MO features fresh updates throughout, including neutral décor and solid-surface countertops in the modern kitchen. Enjoy a covered front porch for relaxing, a spacious full basement for storage or expansion, and a private second-floor primary bedroom for added comfort.
-
2025-02-05historical
-
2025-01-31$150,000 Active
-
2024-10-20historical $1,050
-
2024-10-10price $1,050
-
2024-08-08$1,095
-
2017-02-01soldstatus
-
2009-05-07soldstatus
-
2009-05-07soldstatus
-
2009-02-27$8,000
ⓘ Source: listings_history table (triggers on properties + properties_extension) + one-shot
backfill from property_details.listing_events for pre-trigger history.
Tax reassessment forecast MO · Resets to sale price
- Current annual tax
- $548 · $46/mo
- Projected year-2 tax
- $921 · $77/mo
- Expected delta
- +$373/yr (+$31/mo · 68.0%)
ⓘ Screening estimate from a state-policy table — verify with the county assessor before closing.
Climate risk First Street
- Flood 1/10 Low FEMA zone X (unshaded) · 0% chance over 30 yrs
- Wildfire 1/10 Low
- Heat 4/10 Moderate 7 d/yr ≥106°F today · 16 d/yr by 30 yrs out
- Wind 2/10 Low
- Air quality 3/10 Moderate 2 unhealthy d/yr today · 3 by 30 yrs out
Nearby sold comps map
Loading sold comps map…
Walkable amenities ~0.75 mi
Loading nearby amenities…
Taxation est. · year 1
- Rental income
- $16,030
- − Mortgage interest
- −$5,316
- − Property taxes
- −$548
- − Insurance
- −$474
- − Repairs & maintenance
- −$1,282
- − Management
- −$1,282
- − Depreciation
- −$2,761
- Taxable income
- $4,367
- Est. tax owed @ 24.0%
- −$1,048
- After-tax cash flow
- $4,622/yr
For passive investors: Depreciation is non-cash, so a rental often shows a tax loss while cash-flowing — sheltering income. Rental losses are passive: they offset passive income freely, and up to $25,000/yr can offset ordinary (W-2) income if you actively participate and your MAGI is under $100k (phasing out to $0 by $150k); unused losses carry forward. On sale, claimed depreciation is recaptured at up to 25%, and gains may owe capital-gains tax (a 1031 exchange can defer both). Figures are a year-1 estimate at your 24.0% rate — not tax advice; consult a CPA.
Schools (NCES district)
- District
- Kansas City 33
- NCES district ID
- 2916400
- Math proficiency
- 12% ▼ -8.00%
- Reading proficiency
- 24% ▬ 0.00%
- Median HH income
- $35,227
- Composite
- 14.8/100
- National rank
- #9387
- State rank
- #308 of 324 in MO
Livability — Kansas City
- Score
- 78/100
- State rank
- #28
- US rank
- #2671
Category grades
Schools grade is shown separately in the Schools card above.
Census & demographics
- Census place
- Kansas City, MO
- County
- Jackson County · 687,798 people
- City population
- 439,467
- Metro
- Kansas City, MO-KS
- Population (ZIP)
- 11,912
- Household income
- $36,088
- Rent vs Own
- Severe rent burden
- 946.0
Population outlook (Jackson County) Hauer SSP2
- Today (2025)
- 719,589 people
- By 2030
- 731,456 · +1.6%
- By 2040
- 746,689 · +3.8%
- By 2050
- 749,289 · +4.1%
- By 2075
- 736,227 · +2.3%
- By 2100
- 668,210 · -7.1%
Race, ethnicity, and origin ACS 2023
- Neighborhood character
- Predominantly Black (79%)
- Race & ethnicity
- Black 79% Hispanic / Latino 9% White 8% Two or more races 7%
- Hispanic origin (detail)
- Mexican 6%
- Common ancestry
- Swedish 1% Hispanic 1%
- Foreign-born
- 7% · Canada
- Languages at home
- 88% English-only · Spanish 7% French/Haitian/Cajun 2%
Political lean MEDSL · Jackson
- 2024 margin
- D (+19.3) · D 58.9% · R 39.5% · Other 1.6%
- 2008→2024 swing
- -6.1pp toward R · 2008: 25.4pp · 2024: 19.3pp
- All cycles
- 2024: D+19.3 2020: D+22.0 2016: D+16.6 2012: D+19.0 2008: D+25.4
Not yet ingested
- Civics
- —
Market trends
- HPI YoY
- ▲ 73.41%
- Current HPI
- 412.6862
- Rent YoY
- ▲ 4.65%
- Metro
- Kansas City, MO-KS
- State GDP YoY
- ▲ 1.84%
- F500 in state
- 20
Industry mix (Fortune 500 HQ in MO)
| Industry | F500 HQs | Revenue |
|---|---|---|
| Healthcare | 1 | $163B |
|
||
| Insurance | 1 | $21B |
|
||
| Industrial Technology | 1 | $17B |
|
||
| Retail | 1 | $16B |
|
||
| Industrial Distribution | 1 | $10B |
|
||
| Utilities | 1 | $9B |
|
||
Price history
+1273.8% since first listed13 events — show timeline
- 2026-04-13 Price Changed $109,900 Heartland MLS as Distributed by MLS Grid
- 2026-01-13 Price Changed $124,900 Heartland MLS as Distributed by MLS Grid
- 2025-11-18 Price Changed $134,900 Heartland MLS as Distributed by MLS Grid
- 2025-10-03 Listed $149,900 Heartland MLS as Distributed by MLS Grid
- 2025-02-05 Listing Removed — Heartland MLS as Distributed by MLS Grid
- 2025-01-31 Listed $150,000 Heartland MLS as Distributed by MLS Grid
- 2024-10-20 Rental Removed $1,050 SHOWMOJO
- 2024-10-10 Price Changed $1,050 SHOWMOJO
- 2024-08-08 Listed for Rent $1,095 SHOWMOJO
- 2017-02-01 Sold (Public Records) — Public Records
- 2009-05-07 Sold (Public Records) — Public Records
- 2009-05-07 Sold (MLS) — Heartland MLS as Distributed by MLS Grid
- 2009-02-27 Listed $8,000 Heartland MLS as Distributed by MLS Grid
Property tax history
+5.2%/yrLatest (2025): $548 · -22.9% YoY. Source: county tax records.
Cash-flow waterfall
monthlySold comps — $/sqft
last 12 mo · ≤1 miLoading sold comps…