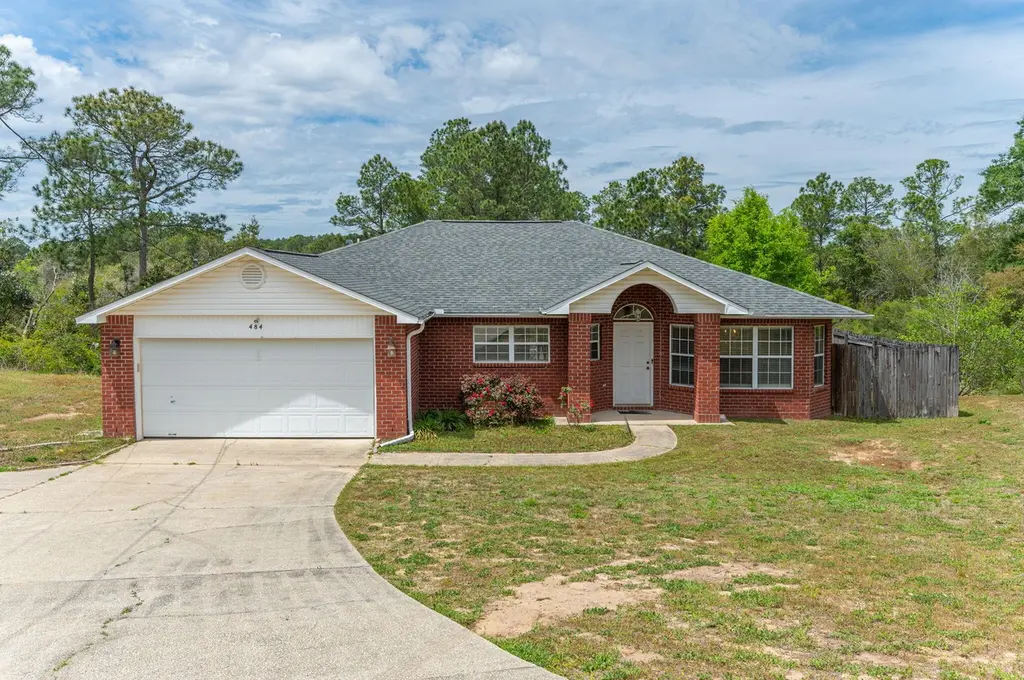
484 Jillian Dr · Crestview, FL
Flood risk 1/10 · Minimal
- FEMA flood zone
- X (unshaded)
- Chance of flooding over 30 yrs
- 0.0%
- Est. flood insurance / yr
- $507 – $1,088
Fire risk 4/10 · Minor
- Est. fire insurance / yr
- $947 – $1,759
Heat risk 9/10 · Severe
- Hot days now (above 106°F)
- 7 days/yr
- Hot days in 30 yrs
- 22 days/yr
Wind risk 9/10 · Severe
- Chance of severe wind over 30 yrs
- 99.0%
Air-quality risk 2/10 · Minimal
- Unhealthy air days now
- 1 days/yr
- Unhealthy air days in 30 yrs
- 1 days/yr
Risk factors via First Street. Map © Google.
Why this score? — see what drove the D- grade
The composite is a weighted blend of 9 inputs, each scored 0–100. Each bar is that input's sub-score; the figure is the points it added to the 100-point composite (weight × sub-score).
- ARV discount +14.2/15.0
- Cash flow +7.4/30.0
- Schools +5.2/10.0
- Livability +3.8/5.0
- Rent growth +2.8/5.0
- Condition / age +2.5/5.0
- 1% rule +1.9/10.0
- DSCR +1.5/10.0
- Appreciation +0.0/10.0
$277,000
🖨 Deal sheet (PDF) 📄 Offer letter ✓ Due diligence
Listing remarks MLS
SELLER OFFERING $10,000 IN BUYER'S CLOSING COST!!! Welcome home to this all brick 3-bedroom, 2-bath property with a 2-car garage, and fenced backyard. This inviting home offers an open floor plan with a spacious kitchen and island, a separate dining room, and a comfortable living room with wood floors. The split-bedroom layout features a generously sized primary suite with a double vanity, garden tub, and separate walk-in closets. Two additional bedrooms, a full bath, and an inside laundry room complete this functional and appealing floor plan.
Key facts
- Open floor plan
- Wood floors
- Separate dining room
Tags
Neighborhood map
What this means for you Summary
Snapshot
- This is a 3-bed/2.0-bath single-family listed at $277k.
Deal economics
- At list price, monthly cash flow is $-356 ($-4k/yr) — negative.
- To cash-flow at today's rent, offer at most $214k (22.7% below list).
- To meet the 1% rule (rent ≥ 1% of price), the offer needs to be $191k (31.2% below list).
- Recommended offer: $191k (31.2% below list) — sets the bar for 1% rule.
Location & tenants
- Location reads 75/100 on livability (#252 in FL, #3,858 nationally) — a middle-class / working-renter tenant base. Strengths: cost of living A+, housing A+, health & safety A+; Watch: employment D, amenities F, commute F.
- Okaloosa (other): math 60% / reading 60% proficiency, ranked #12 of 73 in FL (top 16%) — acceptable for families but not a draw, mixed tenant base, ~2y average lease.
- Market conditions: Rents rising (+1.2%/yr); 351 active listings in the ZIP; 19 comparable units currently listed for rent nearby; rentals lingering (median 45d on market — plan ~5-8 weeks vacancy on turnover, expect pricing pressure); 58% of comp listings sitting > 30 days — soft ceiling on asking rent; solid renter incomes; 1,268 units permitted in Okaloosa County in 2024 (175 in 5+ unit buildings).
Forward outlook
- Local home prices are declining (-3.0%/yr); year-one equity from $2k of loan paydown is wiped out by about $8k of value loss. Plan a longer hold.
- Okaloosa County population projected at +37% by 2050 — long-run rental-demand tailwind backs the buy-and-hold thesis.
Negotiation context
- It's been on market 69 days — a 6% lower offer ($260k) is reasonable based on typical stale-listing flexibility.
- 6 sale attempts since 23y ago with the ask held roughly flat each time — persistent listings suggest the price (not the market) is what's stuck; bring a comps-based counter.
- Current owner paid $123k; list at $277k implies a 124% gain — meaningful room to come down on a strong offer.
Risks & watch-outs
- Climate carrying-cost: severe wind risk, 99% chance of damaging wind over 30y; extreme-heat days projected 7→22/yr by 2055 (HVAC capex compounding) — expect insurance premiums to compound above CPI over the hold.
Questions for the listing agent
- What do current leases actually rent for vs. the listed asking? Can we see a recent rent roll and the last 12 months of T-12 income?
- It's been on market 69 days. Have you received any prior offers? Is the seller open to a 31% concession, seller financing, or rate buy-down credit?
- Why hasn't it sold? Are there any deal-killer items the seller is aware of (foundation, flood, title, zoning, code violations)?
- Is there a deadline driving the sale (1031 exchange, divorce, estate, relocation)? That informs how much negotiation room exists.
- Schools are B-rated — typically a magnet for longer-tenancy family renters. What's the average tenant stay here, and is there a school-zone premium baked into asking?
- The area grade is low — what's the realistic commute time and amenity access for the typical tenant pool here? Any planned neighborhood developments (good or bad) we should know about?
- What's the average days-on-market for RENTAL listings here right now (not sales)? A rising rental-DOM trend means longer vacancies and softer asking-rent achievability than the comps imply.
- What's the recent tenant-quality profile in this submarket — average credit score on applications, eviction rate, late-payment / NSF rate, and stable-employment percentage? A property-management company in the area should have these aggregated.
- How much new for-sale + rental construction is in the pipeline within 1–3 miles? Heavy new supply typically softens prices + rents 12–24 months out; constrained supply supports both.
Investment metrics
- 1% rule
- 0.69% ✗
- Cap rate
- 4.75%
- Cash-on-cash
- -5.52%
- DSCR
- 0.75
- GRM
- 12.1
CMA / ARV
- ARV (median comp)
- $325,718
- List price
- $277,000
- Delta
- -14.96%
- Verdict
- UNDERPRICED
- Comps
- 20 within 1.0 mi
Show comp detail 12 sales within ~0.75 mi
| Address | Dist | Beds/Ba | Sqft | Sold | Price | $/sf | Match |
|---|---|---|---|---|---|---|---|
| 1003 Quigley Dr | 0.28mi | 3/2.0 | 1,851 (+3%) | 2mo | $275,000 | $149 | 81 |
| 1207 Jefferyscot Dr | 0.38mi | 3/2.0 | 1,722 (-4%) | 1mo | $289,000 | $168 | 74 |
| 312 Scotch Pine Ln | 0.38mi | 3/2.0 | 1,936 (+8%) | 2mo | $305,000 | $158 | 68 |
| 486 Jillian Dr | 0.02mi | 4/2.0 (+1) | 2,068 (+15%) | 3mo | $335,000 | $162 | 67 |
| 217 Lustan Dr | 0.49mi | 4/2.0 (+1) | 1,726 (-4%) | 4mo | $269,000 | $156 | 62 |
| 119 Crab Apple Ave | 0.52mi | 3/2.0 | 1,950 (+8%) | 2mo | $316,000 | $162 | 60 |
| 1226 Northview Dr | 0.55mi | 4/2.0 (+1) | 1,666 (-8%) | 1mo | $269,000 | $161 | 56 |
| 1285 Jefferyscot Dr | 0.72mi | 3/2.0 | 1,662 (-8%) | 2mo | $270,000 | $162 | 51 |
| 1249 Jefferyscot Dr | 0.64mi | 3/2.0 | 1,606 (-11%) | 3mo | $290,000 | $181 | 50 |
| 604 Huck Finn Dr | 0.71mi | 4/2.0 (+1) | 1,673 (-7%) | 1mo | $305,000 | $182 | 49 |
| 326 Riverchase Blvd | 0.69mi | 3/2.0 | 1,563 (-13%) | 2mo | $217,500 | $139 | 44 |
| 5612 Thatcher Rd | 0.73mi | 4/3.0 (+1) | 1,968 (+9%) | 3mo | $359,900 | $183 | 39 |
Match score weights: distance 35% · size 25% · config 20% · recency 20%. Top-matched comps best support the ARV.
Projected returns pro-forma
-3.0% appreciation · 1.17% rent growth · sell at horizon
- IRR
- -27.7%
- Equity multiple
- 0.08×
- Total profit
- $-71,040
- Equity at exit
- $41,302
- IRR
- -34.2%
- Equity multiple
- -0.35×
- Total profit
- $-104,740
- Equity at exit
- $23,950
Cash invested: $77,560 (down + closing). Projections, not guarantees.
Landlord ↔ Tenant lean methodology
- Overall (STATE)
- 87 Strongly Landlord-Friendly
- State Florida
- 87 Strongly Landlord-Friendly · R+3
- County
- — inherits STATE
- City
- — inherits STATE
ZIP-level market 32536
- Home prices YoY
- -16.2%
- Rents YoY
- 1.2%
- Active inventory
- 351
- Price-to-rent
- 12.1×
Monthly cashflow live
- Estimated rent
- $1,906 high interval (Pro) →
- Mortgage (P&I)
- −$1,453
- Tax from tax record
- −$294 /mo · $3,526/yr
- Insurance
- −$115
- HOA
- −$0
- Vacancy / Maint / Mgmt
- −$400
- Net cashflow
- $-356
Break-even live
Sensitivity live
| Price | -10% $-200 | -5% $-278 | +0% $-356 | +5% $-435 | +10% $-513 |
|---|---|---|---|---|---|
| Rent | -10% $-507 | -5% $-432 | +0% $-356 | +5% $-281 | +10% $-206 |
| Rate | -1.0pp $-217 | -0.5pp $-286 | base $-356 | +0.5pp $-428 | +1.0pp $-501 |
UW: 25.0% down · 7.5% · 30yr · 1.5% tax · 5.0% vac · 8.0% maint · 8.0% mgmt
Financing live
Cash to close
- Down payment
- $69,250
- Closing costs
- $8,310
- Reserves months
- —
- Total cash needed
- —
Loan-product check · same deal, 3 products live
Conventional
25% down · 7.5% · 30yr
- Down + closing
- —
- Monthly P&I
- —
- Monthly cashflow
- —
- DSCR
- —
- Eligible?
- —
Personal DTI + credit; lowest rate.
DSCR
20% down · 8.5% · 30yr
- Down + closing
- —
- Monthly P&I
- —
- Monthly cashflow
- —
- DSCR
- —
- Eligible?
- —
No personal income docs; deal must DSCR.
Hard money
10% down · 12.0% · 12mo
- Down + closing
- —
- Monthly P&I
- —
- Monthly cashflow
- —
- DSCR
- —
- Eligible?
- —
Short-term bridge; refi at stabilization.
Rent comps 19 comps
| Address | Beds | Baths | Sqft | Rent | $/sqft | DOM | Units | Dist |
|---|---|---|---|---|---|---|---|---|
| 1123 Northview Dr Crestview, FL | 3.0 | 2.0 | 1589 | $1,950 | $1.23 | 45d | 1 | 0.41mi |
| 212 Lustan Dr Crestview, FL | 4.0 | 2.0 | 1481 | $1,695 | $1.14 | 15d | 1 | 0.50mi |
| 127 Nivana Dr Crestview, FL | 3.0 | 2.0 | 1721 | $1,600 | $0.93 | 15d | 1 | 0.53mi |
| 535 Wingspan Way Crestview, FL | 2.0 | 2.0 | 1264 | $1,350 | $1.07 | 45d | 1 | 0.64mi |
| 535 Wingspan Way Unit 535 Crestview, FL | 2.0 | 2.5 | 1264 | $1,349 | $1.07 | 45d | 1 | 0.64mi |
| 428 Riverchase Blvd Crestview, FL | 3.0 | 2.5 | 2232 | $2,500 | $1.12 | 15d | 1 | 0.66mi |
| 551 Wingspan Way Unit 551 Crestview, FL | 2.0 | 3.0 | 1264 | $1,595 | $1.26 | 22d | 1 | 0.67mi |
| 551 Wingspan Way Crestview, FL | 2.0 | 2.5 | 1264 | $1,595 | $1.26 | 22d | 1 | 0.67mi |
| 738 Majestic Dr Crestview, FL | 3.0 | 2.0 | 1460 | $1,600 | $1.10 | 45d | 1 | 0.76mi |
| 748 Majestic Dr Crestview, FL | 3.0 | 2.5 | 1460 | $1,595 | $1.09 | 45d | 1 | 0.79mi |
| 628 Wingspan Way Crestview, FL | 2.0 | 2.5 | 1264 | $1,400 | $1.11 | 45d | 1 | 0.83mi |
| 609 Prairie St Crestview, FL | 3.0 | 2.0 | 1428 | $1,775 | $1.24 | 15d | 1 | 0.96mi |
| 514 Boulder St Crestview, FL | 4.0 | 3.0 | 2102 | $2,400 | $1.14 | 45d | 1 | 0.96mi |
| 713 Presscott St Crestview, FL | 4.0 | 2.5 | 2168 | $2,295 | $1.06 | 46d | 1 | 1.06mi |
| 180 Peoria Blvd Crestview, FL | 4.0 | 3.0 | 2292 | $2,595 | $1.13 | 45d | 1 | 1.15mi |
| 200 Mirage Ave Crestview, FL | 1.0–3.0 | 1.0–2.0 | 1100 | $1,904 | $1.73 | 15d | 34 | 1.30mi |
| 315 Egan Dr Crestview, FL | 4.0 | 2.0 | 1835 | $1,950 | $1.06 | 45d | 1 | 1.37mi |
| 526 Tikell Dr Crestview, FL | 3.0 | 2.5 | 2095 | $2,100 | $1.00 | 15d | 1 | 1.42mi |
| 4699 Meadow Lake Dr Crestview, FL | 4.0 | 3.0 | 2148 | $2,500 | $1.16 | 45d | 1 | 1.49mi |
Listing history 26 events
-
2026-06-21statusdays on market $277,000 Pending 69 DOM
-
2026-06-18days on market $277,000 Active 66 DOM
-
2026-06-17days on market $277,000 Active 65 DOM
-
2026-06-16days on market $277,000 Active 64 DOM
-
2026-06-15days on market $277,000 Active 63 DOM
-
2026-06-14days on market $277,000 Active 61 DOM
-
2026-06-13days on market $277,000 Active 60 DOM
-
2026-06-10days on market $277,000 Active 58 DOM
-
2026-06-09days on market $277,000 Active 57 DOM
-
2026-06-08days on market $277,000 Active 56 DOM
-
2026-06-07days on market $277,000 Active 55 DOM
-
2026-06-05days on market $277,000 Active 52 DOM
-
2026-06-02days on market $277,000 Active 50 DOM
-
2026-06-01days on market $277,000 Active 49 DOM
-
2026-05-31days on market $277,000 Active 48 DOM
-
2026-05-30days on market $277,000 Active 47 DOM
-
2026-04-08$277,000 Active 552-char remark
Show marketing remark (552 chars)
SELLER OFFERING $10,000 IN BUYER'S CLOSING COST!!! Welcome home to this all brick 3-bedroom, 2-bath property with a 2-car garage, and fenced backyard. This inviting home offers an open floor plan with a spacious kitchen and island, a separate dining room, and a comfortable living room with wood floors. The split-bedroom layout features a generously sized primary suite with a double vanity, garden tub, and separate walk-in closets. Two additional bedrooms, a full bath, and an inside laundry room complete this functional and appealing floor plan.
-
2007-09-20$187,000
-
2006-07-25historical
-
2006-03-30$227,000
-
2006-03-30$227,000
-
2004-02-26soldstatus $123,400
-
2004-02-20soldstatus $123,395
-
2004-02-20soldstatus $123,395
-
2003-09-08$123,395
-
2003-09-08$123,395
ⓘ Source: listings_history table (triggers on properties + properties_extension) + one-shot
backfill from property_details.listing_events for pre-trigger history.
Tax reassessment forecast FL · Resets to sale price
- Current annual tax
- $3,526 · $294/mo
- Projected year-2 tax
- $3,526 · $294/mo
- Expected delta
- $0/yr ($0/mo · 0.0%)
ⓘ Screening estimate from a state-policy table — verify with the county assessor before closing.
Climate risk First Street
- Flood 1/10 Low FEMA zone X (unshaded) · 0% chance over 30 yrs
- Wildfire 4/10 Moderate
- Heat 9/10 Extreme 7 d/yr ≥106°F today · 22 d/yr by 30 yrs out
- Wind 9/10 Extreme 99% chance of damaging wind over 30 yrs
- Air quality 2/10 Low 1 unhealthy d/yr today · 1 by 30 yrs out
Nearby sold comps map
Loading sold comps map…
Walkable amenities ~0.75 mi
Loading nearby amenities…
Taxation est. · year 1
- Rental income
- $22,867
- − Mortgage interest
- −$15,516
- − Property taxes
- −$3,526
- − Insurance
- −$1,385
- − Repairs & maintenance
- −$1,829
- − Management
- −$1,829
- − Depreciation
- −$8,058
- Taxable loss
- −$9,278
- Est. tax savings @ 24.0%
- +$2,227
- After-tax cash flow
- $-2,051/yr
For passive investors: Depreciation is non-cash, so a rental often shows a tax loss while cash-flowing — sheltering income. Rental losses are passive: they offset passive income freely, and up to $25,000/yr can offset ordinary (W-2) income if you actively participate and your MAGI is under $100k (phasing out to $0 by $150k); unused losses carry forward. On sale, claimed depreciation is recaptured at up to 25%, and gains may owe capital-gains tax (a 1031 exchange can defer both). Figures are a year-1 estimate at your 24.0% rate — not tax advice; consult a CPA.
Schools (NCES district)
- District
- Okaloosa
- NCES district ID
- 1201380
- Math proficiency
- 60% ▼ -12.00%
- Reading proficiency
- 60% ▼ -4.00%
- Median HH income
- $55,601
- Composite
- 51.62/100
- National rank
- #1705
- State rank
- #12 of 73 in FL
Livability — Crestview
- Score
- 75/100
- State rank
- #252
- US rank
- #3858
Category grades
Schools grade is shown separately in the Schools card above.
Census & demographics
- Census place
- Crestview, FL
- County
- Okaloosa County · 194,352 people
- City population
- 58,889
- Metro
- Crestview-Fort Walton Beach-Destin, FL
- Population (ZIP)
- 25,599
- Household income
- $78,119
- Rent vs Own
- Severe rent burden
- 634.0
Population outlook (Okaloosa County) Hauer SSP2
- Today (2025)
- 235,133 people
- By 2030
- 253,483 · +7.8%
- By 2040
- 289,537 · +23.1%
- By 2050
- 322,954 · +37.3%
- By 2075
- 399,624 · +70.0%
- By 2100
- 425,311 · +80.9%
Race, ethnicity, and origin ACS 2023
- Neighborhood character
- Diverse neighborhood (Simpson 0.56)
- Race & ethnicity
- White 64% Black 16% Hispanic / Latino 12% Two or more races 9% Asian 3%
- Hispanic origin (detail)
- Mexican 4% Puerto Rican 2% Dominican 1%
- Common ancestry
- Lithuanian 2% Slovak 2% Italian 2%
- Foreign-born
- 6% · Canada, South Korea
- Languages at home
- 91% English-only · Spanish 7% Tagalog/Filipino 1%
Political lean MEDSL · Okaloosa
- 2024 margin
- Solid R (+42.4) · D 28.2% · R 70.7% · Other 1.1%
- 2008→2024 swing
- +2.5pp toward D · 2008: -44.9pp · 2024: -42.4pp
- All cycles
- 2024: R+42.4 2020: R+39.1 2016: R+47.8 2012: R+49.4 2008: R+44.9
Not yet ingested
- Civics
- —
Market trends
- HPI YoY
- ▼ -51.48%
- Current HPI
- 265.9926
- Rent YoY
- ▲ 1.17%
- Metro
- Crestview-Fort Walton Beach-Destin, FL
- State GDP YoY
- ▲ 3.28%
- F500 in state
- 36
Industry mix (Fortune 500 HQ in FL)
| Industry | F500 HQs | Revenue |
|---|---|---|
| Industrial Technology | 2 | $29B |
|
||
| Insurance | 2 | $17B |
|
||
| Retail | 1 | $60B |
|
||
| Technology Distribution | 1 | $58B |
|
||
| Homebuilding | 1 | $35B |
|
||
| Technology Manufacturing | 1 | $35B |
|
||
Price history
+124.5% since first listed10 events — show timeline
- 2026-04-08 Listed $277,000 ECAR
- 2007-09-20 Listed $187,000 ECAR
- 2006-07-25 Listing Removed — NAMLS
- 2006-03-30 Listed $227,000 NAMLS
- 2006-03-30 Listed $227,000 ECAR
- 2004-02-26 Sold (Public Records) $123,400 Public Records
- 2004-02-20 Sold (MLS) $123,395 NAMLS
- 2004-02-20 Sold (MLS) $123,395 ECAR
- 2003-09-08 Listed $123,395 NAMLS
- 2003-09-08 Listed $123,395 ECAR
Property tax history
+5.7%/yrLatest (2025): $3,526 · +0.0% YoY. Source: county tax records.
Cash-flow waterfall
monthlySold comps — $/sqft
last 12 mo · ≤1 miLoading sold comps…