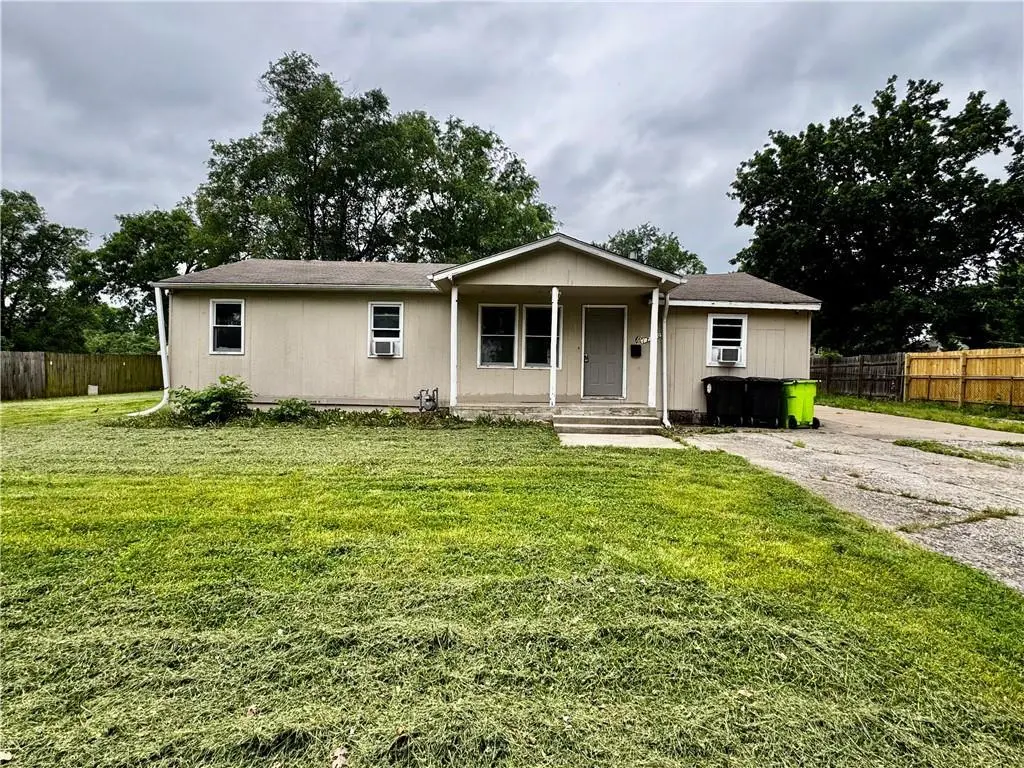
17210 Chestnut Dr · Belton, MO
Flood risk 1/10 · Minimal
- FEMA flood zone
- X (unshaded)
- Chance of flooding over 30 yrs
- 0.0%
- Est. flood insurance / yr
- $507 – $1,088
Fire risk 2/10 · Minimal
- Est. fire insurance / yr
- $1,054 – $1,958
Heat risk 4/10 · Minor
- Hot days now (above 107°F)
- 7 days/yr
- Hot days in 30 yrs
- 17 days/yr
Wind risk 2/10 · Minimal
- Chance of severe wind over 30 yrs
- —
Air-quality risk 2/10 · Minimal
- Unhealthy air days now
- 2 days/yr
- Unhealthy air days in 30 yrs
- 2 days/yr
Risk factors via First Street. Map © Google.
Why this score? — see what drove the C+ grade
The composite is a weighted blend of 9 inputs, each scored 0–100. Each bar is that input's sub-score; the figure is the points it added to the 100-point composite (weight × sub-score).
- Cash flow +22.8/30.0
- ARV discount +14.4/15.0
- DSCR +7.3/10.0
- 1% rule +5.1/10.0
- Rent growth +3.8/5.0
- Livability +3.8/5.0
- Schools +3.0/10.0
- Condition / age +2.5/5.0
- Appreciation +0.0/10.0
$185,000
🖨 Deal sheet (PDF) 📄 Offer letter ✓ Due diligence
Key facts
- 0.4 acre lot
- Garage
- Built 1960
Property features AI
Finance
- Financial info: Annual tax amount reported
Exterior
- Parking: Detached garage (1 car)
- Utilities: City/public water (verify); Public sewer
- Home design: Single-family residence; Residential property; Above-grade living area reported as 1,200
- Construction: Frame construction; Composition roof; Estimated age: 51–75 years
- Exterior features: Lot approximately 17,424 square feet
Interior
- Bedrooms: 4 bedrooms
- Bathrooms: 1 full bathroom
- Heating & cooling: Forced air heating; Window air conditioning units
- Interior features: Ranch floor plan; Workshop; Crawl space basement
Neighborhood map
What this means for you Summary
Snapshot
- This is a 3-bed/1.0-bath single-family listed at $185k.
Deal economics
- At list price, monthly cash flow is $320 ($4k/yr) — positive.
- The deal already cash-flows at list — no discount required.
- Meets the 1% rule at list price ($2k rent vs $185k).
- Cap rate 8.4% vs local median 4.7% in Belton — top-decile yield for the area; either an underpriced asset or a hidden risk that comps aren't pricing in. Stress-test before assuming the spread holds.
Location & tenants
- Location reads 76/100 on livability (#52 in MO, #3,782 nationally) — a middle-class / working-renter tenant base. Strengths: cost of living A+, housing A+, health & safety A+; Watch: crime C-, commute F.
- Belton 124 (suburban): math 28% / reading 39% proficiency, ranked #216 of 324 in MO (top 67%) — families likely to look elsewhere, expect single-tenant / working-renter base with shorter leases.
- Zoned schools: Wilckens Steam Acad @Hillcrest (math 44% / reading 47%, grade D-, #405 of 1,115 statewide, top 37%, 474 students, 37% FRL); Belton Middle School (math 24% / reading 35%, grade F, #291 of 391 statewide, top 76%, 639 students, 46% FRL); Belton High (math 27% / reading 59%, grade F, #211 of 521 statewide, top 41%, 1,374 students, 42% FRL) — zoned schools at 42% FRL track the district average.
- Market conditions: Rents rising fast (+5.2%/yr); 205 active listings in the ZIP; 5 comparable units currently listed for rent nearby; rentals leasing fast (median 6d on market — plan ~1-2 weeks tenant-placement turnaround); 588 units permitted in Cass County in 2024 (0 in 5+ unit buildings).
- This rent runs 31% of the median local income ($72k/yr) — at the standard rent-burdened threshold; future hikes will face affordability resistance.
Forward outlook
- Local home prices are declining (-3.0%/yr); year-one equity from $1k of loan paydown is wiped out by about $6k of value loss. Plan a longer hold.
- Cass County population projected to shrink 3% by 2050 — rents likely to lag national; underwrite the cash flow, not the appreciation.
- At projected returns (-3.0% appreciation + 5.2% rent growth), your $52k cash investment doubles in ~10 years — after that, you're playing with house money.
Negotiation context
- Only 3 days on market — expect competitive offers; lowballing is unlikely to land.
Questions for the listing agent
- Built in 1960 — when were the roof, HVAC, electrical panel, plumbing, and water heater last replaced?
- Is there a deadline driving the sale (1031 exchange, divorce, estate, relocation)? That informs how much negotiation room exists.
- Schools are D-rated, which usually means shorter tenancies and higher turnover. Who's the typical renter profile here, and what's been the actual vacancy rate?
- What's the average days-on-market for RENTAL listings here right now (not sales)? A rising rental-DOM trend means longer vacancies and softer asking-rent achievability than the comps imply.
- What's the recent tenant-quality profile in this submarket — average credit score on applications, eviction rate, late-payment / NSF rate, and stable-employment percentage? A property-management company in the area should have these aggregated.
- How much new for-sale + rental construction is in the pipeline within 1–3 miles? Heavy new supply typically softens prices + rents 12–24 months out; constrained supply supports both.
Investment metrics
- 1% rule
- 1.01% ✓
- Cap rate
- 8.37%
- Cash-on-cash
- 7.41%
- DSCR
- 1.33
- GRM
- 8.2
CMA / ARV
- ARV (on-the-fly)
- $218,400
- Comps found
- 12
Show comp detail 12 sales within ~0.75 mi
| Address | Dist | Beds/Ba | Sqft | Sold | Price | $/sf | Match |
|---|---|---|---|---|---|---|---|
| 17244 Montgall Dr | 0.19mi | 4/2.0 (+1) | 1,184 (-1%) | 4mo | $179,000 | $151 | 76 |
| 17217 Chestnut St | 0.05mi | 3/1.5 | 1,228 (+2%) | 19mo | $174,900 | $142 | 76 |
| 17220 Monte Verde Dr | 0.31mi | 3/1.0 | 1,220 (+2%) | 12mo | $214,900 | $176 | 72 |
| 17233 Monte Verde Dr | 0.36mi | 2/1.0 (-1) | 1,200 (0%) | 15mo | $236,900 | $197 | 65 |
| 17233 Chestnut Dr | 0.13mi | 3/1.0 | 1,266 (+6%) | 23mo | $199,900 | $158 | 65 |
| 17130 Cerrito Dr | 0.32mi | 3/1.0 | 1,104 (-8%) | 9mo | $205,000 | $186 | 64 |
| 17405 S Benton Dr | 0.32mi | 3/1.0 | 1,336 (+11%) | 6mo | $189,900 | $142 | 61 |
| 17405 Chula Vista Dr | 0.35mi | 4/2.0 (+1) | 1,200 (0%) | 17mo | $224,999 | $187 | 60 |
| 17604 Montgall Dr | 0.58mi | 3/1.5 | 1,100 (-8%) | 3mo | $179,900 | $164 | 55 |
| 17229 Monte Verde Dr | 0.35mi | 3/2.0 | 1,128 (-6%) | 18mo | $229,000 | $203 | 54 |
| 17201 Cerrito Dr | 0.36mi | 3/1.0 | 1,048 (-13%) | 10mo | $239,000 | $228 | 54 |
| 17401 S Prospect Ave | 0.31mi | 4/1.5 (+1) | 1,100 (-8%) | 19mo | $199,900 | $182 | 49 |
Match score weights: distance 35% · size 25% · config 20% · recency 20%. Top-matched comps best support the ARV.
Projected returns pro-forma
-3.0% appreciation · 5.17% rent growth · sell at horizon
- IRR
- -2.7%
- Equity multiple
- 0.89×
- Total profit
- $-5,461
- Equity at exit
- $27,584
- IRR
- 9.0%
- Equity multiple
- 1.76×
- Total profit
- $39,227
- Equity at exit
- $15,995
Cash invested: $51,800 (down + closing). Projections, not guarantees.
Landlord ↔ Tenant lean methodology
- Overall (STATE)
- 81 Strongly Landlord-Friendly
- State Missouri
- 81 Strongly Landlord-Friendly · R+10
- County
- — inherits STATE
- City
- — inherits STATE
ZIP-level market 64012
- Rents YoY
- 5.2%
- Active inventory
- 205
- Price-to-rent
- 8.2×
Monthly cashflow live
- Estimated rent
- $1,872 high interval (Pro) →
- Mortgage (P&I)
- −$970
- Tax from tax record
- −$112 /mo · $1,342/yr
- Insurance
- −$77
- HOA
- −$0
- Vacancy / Maint / Mgmt
- −$393
- Net cashflow
- $320
Break-even live
Sensitivity live
| Price | -10% $425 | -5% $372 | +0% $320 | +5% $268 | +10% $215 |
|---|---|---|---|---|---|
| Rent | -10% $172 | -5% $246 | +0% $320 | +5% $394 | +10% $468 |
| Rate | -1.0pp $413 | -0.5pp $367 | base $320 | +0.5pp $272 | +1.0pp $223 |
UW: 25.0% down · 7.5% · 30yr · 1.5% tax · 5.0% vac · 8.0% maint · 8.0% mgmt
Financing live
Cash to close
- Down payment
- $46,250
- Closing costs
- $5,550
- Reserves months
- —
- Total cash needed
- —
Loan-product check · same deal, 3 products live
Conventional
25% down · 7.5% · 30yr
- Down + closing
- —
- Monthly P&I
- —
- Monthly cashflow
- —
- DSCR
- —
- Eligible?
- —
Personal DTI + credit; lowest rate.
DSCR
20% down · 8.5% · 30yr
- Down + closing
- —
- Monthly P&I
- —
- Monthly cashflow
- —
- DSCR
- —
- Eligible?
- —
No personal income docs; deal must DSCR.
Hard money
10% down · 12.0% · 12mo
- Down + closing
- —
- Monthly P&I
- —
- Monthly cashflow
- —
- DSCR
- —
- Eligible?
- —
Short-term bridge; refi at stabilization.
Rent comps 5 comps
| Address | Beds | Baths | Sqft | Rent | $/sqft | DOM | Units | Dist |
|---|---|---|---|---|---|---|---|---|
| 107 N Cleveland Ave Belton, MO | 3.0 | 2.0 | 1128 | $1,860 | $1.65 | 6d | 1 | 0.80mi |
| 611 W Sunrise Dr Belton, MO | 3.0 | 2.5 | 1496 | $1,990 | $1.33 | 9d | 1 | 1.00mi |
| 401 Lacy Ln Belton, MO | 4.0 | 2.0 | 1225 | $1,750 | $1.43 | 9d | 1 | 1.28mi |
| 403 Shawn Dr Belton, MO | 4.0 | 2.0 | 1234 | $1,495 | $1.21 | 0d | 1 | 1.33mi |
| 210 Mill St Belton, MO | 2.0 | 1.0 | 700 | $1,050 | $1.50 | 0d | 1 | 1.37mi |
Listing history 2 events
-
2026-05-23status Pending
-
2026-05-20$185,000 Active
ⓘ Source: listings_history table (triggers on properties + properties_extension) + one-shot
backfill from property_details.listing_events for pre-trigger history.
Tax reassessment forecast MO · Resets to sale price
- Current annual tax
- $1,342 · $112/mo
- Projected year-2 tax
- $1,794 · $150/mo
- Expected delta
- +$452/yr (+$38/mo · 33.7%)
ⓘ Screening estimate from a state-policy table — verify with the county assessor before closing.
Climate risk First Street
- Flood 1/10 Low FEMA zone X (unshaded) · 0% chance over 30 yrs
- Wildfire 2/10 Low
- Heat 4/10 Moderate 7 d/yr ≥107°F today · 17 d/yr by 30 yrs out
- Wind 2/10 Low
- Air quality 2/10 Low 2 unhealthy d/yr today · 2 by 30 yrs out
Nearby sold comps map
Loading sold comps map…
Walkable amenities ~0.75 mi
Loading nearby amenities…
Taxation est. · year 1
- Rental income
- $22,469
- − Mortgage interest
- −$10,363
- − Property taxes
- −$1,342
- − Insurance
- −$925
- − Repairs & maintenance
- −$1,797
- − Management
- −$1,797
- − Depreciation
- −$5,382
- Taxable income
- $861
- Est. tax owed @ 24.0%
- −$207
- After-tax cash flow
- $3,634/yr
For passive investors: Depreciation is non-cash, so a rental often shows a tax loss while cash-flowing — sheltering income. Rental losses are passive: they offset passive income freely, and up to $25,000/yr can offset ordinary (W-2) income if you actively participate and your MAGI is under $100k (phasing out to $0 by $150k); unused losses carry forward. On sale, claimed depreciation is recaptured at up to 25%, and gains may owe capital-gains tax (a 1031 exchange can defer both). Figures are a year-1 estimate at your 24.0% rate — not tax advice; consult a CPA.
Schools (NCES district)
- District
- Belton 124
- NCES district ID
- 2904620
- Math proficiency
- 28% ▼ -9.00%
- Reading proficiency
- 39% ▼ -9.00%
- Median HH income
- $56,946
- Composite
- 29.73/100
- National rank
- #6446
- State rank
- #216 of 324 in MO
Livability — Belton
- Score
- 76/100
- State rank
- #52
- US rank
- #3782
Category grades
Schools grade is shown separately in the Schools card above.
Census & demographics
- Census place
- Belton, MO
- County
- Cass County · 65,358 people
- City population
- 29,304
- Metro
- Kansas City, MO-KS
- Population (ZIP)
- 29,304
- Household income
- $71,814
- Rent vs Own
- Severe rent burden
- 1081.0
Population outlook (Cass County) Hauer SSP2
- Today (2025)
- 105,292 people
- By 2030
- 106,109 · +0.8%
- By 2040
- 105,786 · +0.5%
- By 2050
- 102,062 · -3.1%
- By 2075
- 88,569 · -15.9%
- By 2100
- 68,293 · -35.1%
Race, ethnicity, and origin ACS 2023
- Neighborhood character
- Predominantly White (80%)
- Race & ethnicity
- White 80% Two or more races 7% Hispanic / Latino 7% Black 6% Asian 1%
- Hispanic origin (detail)
- Mexican 5%
- Common ancestry
- Italian 2% Lithuanian 2% Portuguese 2%
- Foreign-born
- 2% · Canada
- Languages at home
- 96% English-only · Spanish 2% German/W. Germanic 1% Other Asian/Pacific 1%
Political lean MEDSL · Cass
- 2024 margin
- Solid R (+32.1) · D 33.3% · R 65.4% · Other 1.3%
- 2008→2024 swing
- -12.5pp toward R · 2008: -19.6pp · 2024: -32.1pp
- All cycles
- 2024: R+32.1 2020: R+31.6 2016: R+35.9 2012: R+28.4 2008: R+19.6
Not yet ingested
- Civics
- —
Market trends
- HPI YoY
- ▼ -244.76%
- Current HPI
- 214.6157
- Rent YoY
- ▲ 5.17%
- Metro
- Kansas City, MO-KS
- State GDP YoY
- ▲ 1.84%
- F500 in state
- 20
Industry mix (Fortune 500 HQ in MO)
| Industry | F500 HQs | Revenue |
|---|---|---|
| Healthcare | 1 | $163B |
|
||
| Insurance | 1 | $21B |
|
||
| Industrial Technology | 1 | $17B |
|
||
| Retail | 1 | $16B |
|
||
| Industrial Distribution | 1 | $10B |
|
||
| Utilities | 1 | $9B |
|
||
Price history
2 events — show timeline
- 2026-05-23 Pending — Heartland MLS as Distributed by MLS Grid
- 2026-05-20 Listed $185,000 Heartland MLS as Distributed by MLS Grid
Property tax history
+3.0%/yrLatest (2025): $1,342 · +10.3% YoY. Source: county tax records.
Cash-flow waterfall
monthlySold comps — $/sqft
last 12 mo · ≤1 miLoading sold comps…