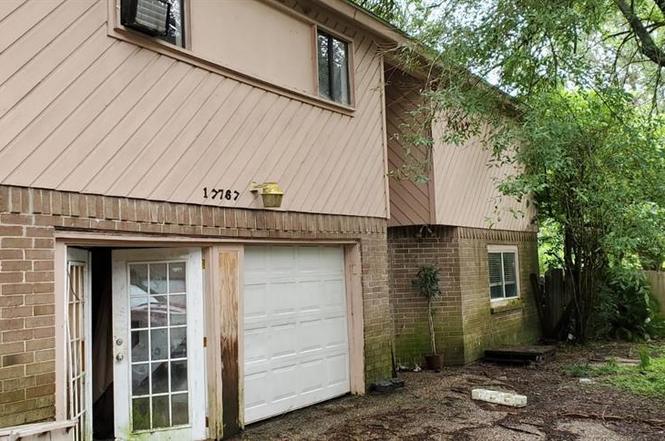
17767 S Cypress Villas Dr · Houston, TX
Flood risk 1/10 · Minimal
- FEMA flood zone
- X (unshaded)
- Chance of flooding over 30 yrs
- 0.0%
- Est. flood insurance / yr
- $507 – $1,088
Fire risk 1/10 · Minimal
- Est. fire insurance / yr
- $1,222 – $2,270
Heat risk 9/10 · Severe
- Hot days now (above 111°F)
- 7 days/yr
- Hot days in 30 yrs
- 23 days/yr
Wind risk 8/10 · Major
- Chance of severe wind over 30 yrs
- 99.0%
Air-quality risk 3/10 · Minor
- Unhealthy air days now
- 3 days/yr
- Unhealthy air days in 30 yrs
- 3 days/yr
Risk factors via First Street. Map © Google.
Why this score? — see what drove the B- grade
The composite is a weighted blend of 9 inputs, each scored 0–100. Each bar is that input's sub-score; the figure is the points it added to the 100-point composite (weight × sub-score).
- Cash flow +29.4/30.0
- DSCR +10.0/10.0
- 1% rule +9.1/10.0
- ARV discount +7.5/15.0
- Schools +4.1/10.0
- Livability +3.7/5.0
- Condition / age +2.5/5.0
- Rent growth +2.0/5.0
- Appreciation +0.0/10.0
$184,399
🖨 Deal sheet 📄 Offer letter ✓ Due diligence
Listing remarks MLS
Perfect property to invest on. See property under your own risk, stairs not reliable. Sold "AS IS" Excellent opportunity to flip or to make it yours in an excellent location.
Key facts
- 6,268 sq ft lot
- 2 garage spots
- Pool
Property features AI
Finance
- Other: Municipal Utility District disclosure available; Seller disclosure available
- HOA & community: Member of Olde Cypress Mill community association; Annual association fee of $200; Curbs in community
Exterior
- Parking: Attached garage (2 spaces)
- Utilities: Public water; Public sewer
- Home design: Residential property; Slab foundation; Composition roof; Built in 1983
- Construction: Brick and wood siding construction
- Exterior features: Private in-ground pool; Subdivision lot; Concrete and gravel road access; Additional parcel(s) included
Interior
- Kitchen: Kitchen on first level (12 x 10); Breakfast nook on first level (12 x 9)
- Bedrooms: Primary bedroom on second level (26 x 19); Three additional bedrooms on second level (16 x 11; 12 x 12; 12 x 12); Office on first level (18 x 8); Bonus room on first level (22 x 20)
- Flooring: Tile; Vinyl
- Bathrooms: 2 full bathrooms; 1 half bathroom
- Heating & cooling: Central heating (electric); Central air conditioning (electric)
- Interior features: Wood-burning fireplace; Electric dryer hookup
- Laundry & utility: Electric dryer hookup
Neighborhood map
What this means for you Summary
Snapshot
- This is a 3-bed/2.5-bath single-family listed at $184k.
Deal economics
- At list price, monthly cash flow is $653 ($8k/yr) — positive.
- The deal already cash-flows at list — no discount required.
- Meets the 1% rule at list price ($3k rent vs $184k).
- Recommended offer: $173k (6.0% below list) — sets the bar for market timing.
- Cap rate 10.5% vs local median 3.2% in Houston — top-decile yield for the area; either an underpriced asset or a hidden risk that comps aren't pricing in. Stress-test before assuming the spread holds.
Location & tenants
- Location reads 74/100 on livability (#184 in TX, #4,771 nationally) — a middle-class / working-renter tenant base. Strengths: amenities A+, cost of living A+, housing A+; Watch: crime F.
- Klein ISD (suburban): math 41% / reading 48% proficiency, ranked #213 of 826 in TX (top 26%) — families likely to look elsewhere, expect single-tenant / working-renter base with shorter leases.
- Zoned schools: Klein H S (math 58% / reading 67%, grade B-, #234 of 1,632 statewide, top 14%, 3,352 students, 45% FRL).
- Zoned-school proficiency averages 62% at this address vs 44% district-wide (+18 pts) — the actual schools serving this property are materially stronger than the Klein ISD average implies; a family-tenant draw the district grade alone would hide.
- Market conditions: Rents soft (-1.9%/yr); 622 active listings in the ZIP; 4 comparable units currently listed for rent nearby; rentals at typical pace (median 15d on market — plan ~3-4 weeks tenant-placement turnaround); solid renter incomes; 29,883 units permitted in Harris County in 2024 (8,621 in 5+ unit buildings).
Forward outlook
- Local home prices are declining (-3.0%/yr); year-one equity from $1k of loan paydown is wiped out by about $6k of value loss. Plan a longer hold.
- Harris County population projected at +47% by 2050 — long-run rental-demand tailwind backs the buy-and-hold thesis.
Negotiation context
- It's been on market 62 days — a 6% lower offer ($173k) is reasonable based on typical stale-listing flexibility.
- 12 sale attempts since 14y ago; this cycle's ask has dropped $16k (8%) from the opening price — seller is motivated, your offer sets the floor, not the list.
- Current owner paid $84k; list at $184k implies a 118% gain — meaningful room to come down on a strong offer.
Risks & watch-outs
- Climate carrying-cost: severe wind risk, 99% chance of damaging wind over 30y; extreme-heat days projected 7→23/yr by 2055 (HVAC capex compounding) — expect insurance premiums to compound above CPI over the hold.
Questions for the listing agent
- It's been on market 62 days. Have you received any prior offers? Is the seller open to a 6% concession, seller financing, or rate buy-down credit?
- What does the HOA fee cover, when was the last increase, and are there any pending special assessments or reserve-fund shortfalls?
- Why hasn't it sold? Are there any deal-killer items the seller is aware of (foundation, flood, title, zoning, code violations)?
- Is there a deadline driving the sale (1031 exchange, divorce, estate, relocation)? That informs how much negotiation room exists.
- Schools are D-rated, which usually means shorter tenancies and higher turnover. Who's the typical renter profile here, and what's been the actual vacancy rate?
- Crime grade is F in this area — have there been break-ins, vandalism, or insurance claims at this property in the last 3 years? What carrier currently insures it and at what premium?
- What's the average days-on-market for RENTAL listings here right now (not sales)? A rising rental-DOM trend means longer vacancies and softer asking-rent achievability than the comps imply.
- What's the recent tenant-quality profile in this submarket — average credit score on applications, eviction rate, late-payment / NSF rate, and stable-employment percentage? A property-management company in the area should have these aggregated.
- How much new for-sale + rental construction is in the pipeline within 1–3 miles? Heavy new supply typically softens prices + rents 12–24 months out; constrained supply supports both.
Investment metrics
- 1% rule
- 1.41% ✓
- Cap rate
- 10.54%
- Cash-on-cash
- 15.18%
- DSCR
- 1.68
- GRM
- 5.9
CMA / ARV
- ARV (on-the-fly)
- $444,152
- Comps found
- 8
Show comp detail 8 sales within ~0.75 mi
| Address | Dist | Beds/Ba | Sqft | Sold | Price | $/sf | Match |
|---|---|---|---|---|---|---|---|
| 17706 Asphodel Ln | 0.62mi | 4/2.5 (+1) | 3,802 (+1%) | 4mo | $389,000 | $102 | 61 |
| 17603 Loring Ln | 0.47mi | 4/2.5 (+1) | 3,241 (-14%) | 2mo | $354,000 | $109 | 48 |
| 17823 Villa Way Dr | 0.12mi | 4/2.5 (+1) | 3,216 (-15%) | 21mo | $299,954 | $93 | 48 |
| 17310 Loring Ln | 0.59mi | 4/3.0 (+1) | 3,612 (-4%) | 15mo | $306,000 | $85 | 46 |
| 5502 Brownlee Ln | 0.56mi | 4/4.5 (+1) | 3,854 (+2%) | 24mo | $489,000 | $127 | 37 |
| 5211 Dunleith Ln | 0.72mi | 4/3.5 (+1) | 3,526 (-6%) | 14mo | $460,000 | $130 | 35 |
| 17627 Macrantha Dr | 0.64mi | 4/3.5 (+1) | 3,477 (-8%) | 19mo | $460,000 | $132 | 33 |
| 5303 Lacreek Ln | 0.47mi | 4/3.0 (+1) | 3,265 (-13%) | 23mo | $385,000 | $118 | 30 |
Match score weights: distance 35% · size 25% · config 20% · recency 20%. Top-matched comps best support the ARV.
Projected returns pro-forma
-3.0% appreciation · 0.0% rent growth · sell at horizon
- IRR
- 2.2%
- Equity multiple
- 1.08×
- Total profit
- $4,208
- Equity at exit
- $27,494
- IRR
- 8.4%
- Equity multiple
- 1.55×
- Total profit
- $28,236
- Equity at exit
- $15,943
Cash invested: $51,632 (down + closing). Projections, not guarantees.
Landlord ↔ Tenant lean methodology
- Overall (STATE)
- 87 Strongly Landlord-Friendly
- State Texas
- 87 Strongly Landlord-Friendly · R+5
- County
- — inherits STATE
- City
- — inherits STATE
ZIP-level market 77379
- Home prices YoY
- -34.7%
- Rents YoY
- -1.9%
- Active inventory
- 622
- Price-to-rent
- 5.9×
Monthly cashflow live
- Estimated rent
- $2,602 medium interval (Pro) →
- Mortgage (P&I)
- −$967
- Tax from tax record
- −$342 /mo · $4,098/yr
- Insurance
- −$77
- HOA
- −$17
- Vacancy / Maint / Mgmt
- −$546
- Net cashflow
- $653
Break-even live
UW: 25.0% down · 7.5% · 30yr · 1.5% tax · 5.0% vac · 8.0% maint · 8.0% mgmt
Financing live
Cash to close
- Down payment
- $46,100
- Closing costs
- $5,532
- Reserves months
- —
- Total cash needed
- —
Loan-product check · same deal, 3 products live
Conventional
25% down · 7.5% · 30yr
- Down + closing
- —
- Monthly P&I
- —
- Monthly cashflow
- —
- DSCR
- —
- Eligible?
- —
Personal DTI + credit; lowest rate.
DSCR
20% down · 8.5% · 30yr
- Down + closing
- —
- Monthly P&I
- —
- Monthly cashflow
- —
- DSCR
- —
- Eligible?
- —
No personal income docs; deal must DSCR.
Hard money
10% down · 12.0% · 12mo
- Down + closing
- —
- Monthly P&I
- —
- Monthly cashflow
- —
- DSCR
- —
- Eligible?
- —
Short-term bridge; refi at stabilization.
Rent comps 4 comps
| Address | Beds | Baths | Sqft | Rent | $/sqft | DOM | Units | Dist |
|---|---|---|---|---|---|---|---|---|
| 18011 Tall Cypress Dr Spring, TX | 4.0 | 2.5 | 2824 | $3,120 | $1.10 | 7d | 1 | 0.54mi |
| 17734 Moss Point Dr Spring, TX | 4.0 | 3.5 | 2734 | $2,470 | $0.90 | 15d | 1 | 0.75mi |
| 16415 Lapis River Dr Spring, TX | 4.0 | 2.5 | 2804 | $2,500 | $0.89 | 43d | 1 | 1.20mi |
| 6302 Laver Love Dr Spring, TX | 4.0 | 3.5 | 3553 | $3,549 | $1.00 | 5d | 1 | 1.47mi |
HOA detail
- Monthly dues
- $17 · $204/yr
Listing history 40 events
-
2026-04-27status Pending
-
2026-04-14price $184,399
-
2026-04-07status Active
-
2026-03-30status Pending
-
2026-03-05price $184,999
-
2026-02-16$199,990 Active
-
2023-01-13soldstatus
-
2020-07-17soldstatus
-
2020-07-16soldstatus Sold 184-char remark
Show marketing remark (184 chars)
Perfect property to invest on. See property under your own risk, stairs not reliable. Sold "AS IS" Excellent opportunity to flip or to make it yours in an excellent location.
-
2020-07-06status Pending 184-char remark
Show marketing remark (184 chars)
Perfect property to invest on. See property under your own risk, stairs not reliable. Sold "AS IS" Excellent opportunity to flip or to make it yours in an excellent location.
-
2020-06-27status Option Pending 184-char remark
Show marketing remark (184 chars)
Perfect property to invest on. See property under your own risk, stairs not reliable. Sold "AS IS" Excellent opportunity to flip or to make it yours in an excellent location.
-
2020-06-25$125,000 Active 184-char remark
Show marketing remark (184 chars)
Perfect property to invest on. See property under your own risk, stairs not reliable. Sold "AS IS" Excellent opportunity to flip or to make it yours in an excellent location.
-
2014-07-28soldstatus
-
2014-05-29status Pending
-
2014-05-22status Option Pending
-
2014-05-21historical
-
2014-04-29status Active
-
2014-04-26status Pending, Continue to Show
-
2014-04-15status Option Pending
-
2014-04-09status Active
-
2014-04-09status Option Pending
-
2014-04-08status Active
-
2014-03-31status Option Pending
-
2014-03-28status Active
-
2014-03-17status Option Pending
-
2014-03-10$109,950 Active
-
2014-03-10historical
-
2013-08-21status Pending
-
2013-08-12status Option Pending
-
2013-05-16price $115,000
-
2013-04-23price $118,000
-
2013-03-25$120,000 Active
-
2012-11-21historical
-
2012-10-19historical
-
2012-10-19$132,900
-
2012-06-12$132,900
-
2012-05-24historical
-
2012-03-20$135,900
-
1991-03-21soldstatus $84,500
-
1989-08-01soldstatus $66,000
ⓘ Source: listings_history table (triggers on properties + properties_extension) + one-shot
backfill from property_details.listing_events for pre-trigger history.
Tax reassessment forecast TX · Resets to sale price
- Current annual tax
- $4,098 · $342/mo
- Projected year-2 tax
- $4,098 · $342/mo
- Expected delta
- $0/yr ($0/mo · 0.0%)
ⓘ Screening estimate from a state-policy table — verify with the county assessor before closing.
Climate risk First Street
- Flood 1/10 Low FEMA zone X (unshaded) · 0% chance over 30 yrs
- Wildfire 1/10 Low
- Heat 9/10 Extreme 7 d/yr ≥111°F today · 23 d/yr by 30 yrs out
- Wind 8/10 Severe 99% chance of damaging wind over 30 yrs
- Air quality 3/10 Moderate 3 unhealthy d/yr today · 3 by 30 yrs out
Nearby sold comps map
Loading sold comps map…
Walkable amenities ~0.75 mi
Loading nearby amenities…
Taxation est. · year 1
- Rental income
- $31,222
- − Mortgage interest
- −$10,329
- − Property taxes
- −$4,098
- − Insurance
- −$922
- − Repairs & maintenance
- −$2,498
- − Management
- −$2,498
- − HOA
- −$204
- − Depreciation
- −$5,364
- Taxable income
- $5,309
- Est. tax owed @ 24.0%
- −$1,274
- After-tax cash flow
- $6,563/yr
For passive investors: Depreciation is non-cash, so a rental often shows a tax loss while cash-flowing — sheltering income. Rental losses are passive: they offset passive income freely, and up to $25,000/yr can offset ordinary (W-2) income if you actively participate and your MAGI is under $100k (phasing out to $0 by $150k); unused losses carry forward. On sale, claimed depreciation is recaptured at up to 25%, and gains may owe capital-gains tax (a 1031 exchange can defer both). Figures are a year-1 estimate at your 24.0% rate — not tax advice; consult a CPA.
Schools (NCES district)
- District
- Klein ISD
- NCES district ID
- 4825740
- Math proficiency
- 41% ▼ -12.00%
- Reading proficiency
- 48% ▼ -3.00%
- Median HH income
- $78,288
- Composite
- 40.91/100
- National rank
- #3615
- State rank
- #213 of 826 in TX
Livability — Houston
- Score
- 74/100
- State rank
- #184
- US rank
- #4771
Category grades
Schools grade is shown separately in the Schools card above.
Census & demographics
- County
- Harris County · 4,702,590 people
- City population
- 3,226,434
- Metro
- Houston-The Woodlands-Sugar Land, TX
- Population (ZIP)
- 85,190
- Household income
- $107,486
- Rent vs Own
- Severe rent burden
- 2220.0
Population outlook (Harris County) Hauer SSP2
- Today (2025)
- 5,571,493 people
- By 2030
- 6,089,821 · +9.3%
- By 2040
- 7,142,806 · +28.2%
- By 2050
- 8,185,864 · +46.9%
- By 2075
- 10,574,329 · +89.8%
- By 2100
- 12,109,958 · +117.4%
Race, ethnicity, and origin ACS 2023
- Neighborhood character
- Diverse neighborhood (Simpson 0.68)
- Race & ethnicity
- White 49% Hispanic / Latino 24% Two or more races 15% Black 11% Asian 11%
- Hispanic origin (detail)
- Mexican 13% Puerto Rican 1% Cuban 1%
- Common ancestry
- Italian 2% Lithuanian 2% Slovak 2%
- Foreign-born
- 19% · Canada, Vietnam, China
- Languages at home
- 71% English-only · Spanish 16% Other Indo-European 5% Other Asian/Pacific 1%
Political lean MEDSL · Harris
- 2024 margin
- Lean D (+5.5) · D 52.0% · R 46.4% · Other 1.6%
- 2008→2024 swing
- +3.9pp toward D · 2008: 1.6pp · 2024: 5.5pp
- All cycles
- 2024: D+5.5 2020: D+13.3 2016: D+12.4 2012: D+0.1 2008: D+1.6
Not yet ingested
- Civics
- —
Market trends
- HPI YoY
- ▼ -116.58%
- Current HPI
- 218.9608
- Rent YoY
- ▼ -1.95%
- Metro
- Houston-The Woodlands-Sugar Land, TX
- State GDP YoY
- ▲ 3.95%
- F500 in state
- 110
Industry mix (Fortune 500 HQ in TX)
| Industry | F500 HQs | Revenue |
|---|---|---|
| Energy | 16 | $1,198B |
|
||
| Technology | 5 | $198B |
|
||
| Engineering / Construction | 4 | $72B |
|
||
| Energy Services | 3 | $60B |
|
||
| Utilities | 3 | $41B |
|
||
| Healthcare | 2 | $330B |
|
||
Price history
+179.4% since first listed40 events — show timeline
- 2026-04-27 Pending — HARMLS
- 2026-04-14 Price Changed $184,399 HARMLS
- 2026-04-07 Relisted — HARMLS
- 2026-03-30 Pending — HARMLS
- 2026-03-05 Price Changed $184,999 HARMLS
- 2026-02-16 Listed $199,990 HARMLS
- 2023-01-13 Sold (Public Records) — Public Records
- 2020-07-17 Sold (Public Records) — Public Records
- 2020-07-16 Sold (MLS) — HARMLS
- 2020-07-06 Pending — HARMLS
- 2020-06-27 Pending — HARMLS
- 2020-06-25 Listed $125,000 HARMLS
- 2014-07-28 Sold (Public Records) — Public Records
- 2014-05-29 Pending — HARMLS
- 2014-05-22 Pending — HARMLS
- 2014-05-21 Listing Removed — HARMLS
- 2014-04-29 Relisted — HARMLS
- 2014-04-26 Pending — HARMLS
- 2014-04-15 Pending — HARMLS
- 2014-04-09 Relisted — HARMLS
- 2014-04-09 Pending — HARMLS
- 2014-04-08 Relisted — HARMLS
- 2014-03-31 Pending — HARMLS
- 2014-03-28 Relisted — HARMLS
- 2014-03-17 Pending — HARMLS
- 2014-03-10 Listed $109,950 HARMLS
- 2014-03-10 Listing Removed — HARMLS
- 2013-08-21 Pending — HARMLS
- 2013-08-12 Pending — HARMLS
- 2013-05-16 Price Changed $115,000 HARMLS
- 2013-04-23 Price Changed $118,000 HARMLS
- 2013-03-25 Listed $120,000 HARMLS
- 2012-11-21 Listing Removed — HARMLS
- 2012-10-19 Listing Removed — HARMLS
- 2012-10-19 Listed $132,900 HARMLS
- 2012-06-12 Listed $132,900 HARMLS
- 2012-05-24 Listing Removed — HARMLS
- 2012-03-20 Listed $135,900 HARMLS
- 1991-03-21 Sold (Public Records) $84,500 Public Records
- 1989-08-01 Sold (Public Records) $66,000 Public Records
Property tax history
+5.4%/yrLatest (2025): $4,098 · +20.7% YoY. Source: county tax records.
Cash-flow waterfall
monthlySold comps — $/sqft
last 12 mo · ≤1 miLoading sold comps…