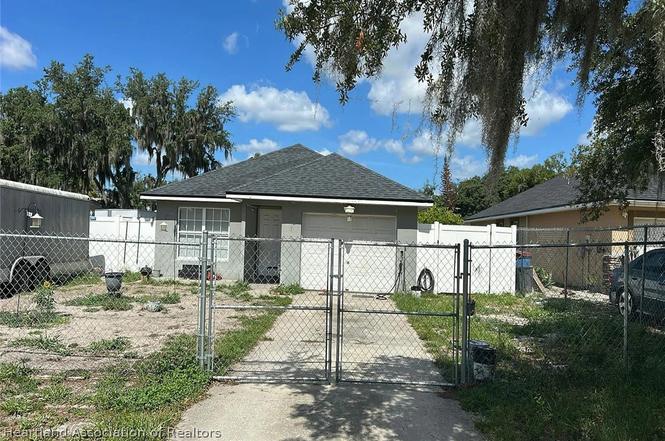
4817 Mark Way · Eagle Lake, FL
Flood risk 1/10 · Minimal
- FEMA flood zone
- X (unshaded)
- Chance of flooding over 30 yrs
- 0.0%
- Est. flood insurance / yr
- $507 – $1,088
Fire risk 5/10 · Moderate
- Est. fire insurance / yr
- $947 – $1,759
Heat risk 8/10 · Major
- Hot days now (above 107°F)
- 7 days/yr
- Hot days in 30 yrs
- 25 days/yr
Wind risk 9/10 · Severe
- Chance of severe wind over 30 yrs
- 99.0%
Air-quality risk 2/10 · Minimal
- Unhealthy air days now
- 2 days/yr
- Unhealthy air days in 30 yrs
- 2 days/yr
Risk factors via First Street. Map © Google.
Why this score? — see what drove the D+ grade
The composite is a weighted blend of 9 inputs, each scored 0–100. Each bar is that input's sub-score; the figure is the points it added to the 100-point composite (weight × sub-score).
- Cash flow +15.0/30.0
- ARV discount +7.5/15.0
- 1% rule +5.0/10.0
- DSCR +5.0/10.0
- Livability +3.9/5.0
- Schools +3.5/10.0
- Rent growth +3.2/5.0
- Condition / age +2.5/5.0
- Appreciation +0.0/10.0
$5,000
🖨 Deal sheet 📄 Offer letter ✓ Due diligence
Listing remarks MLS
Step into your dream home with this charming 3-bedroom, 2-bathroom property that qualifies for USDA 100% financing. Perfect for first-time homebuyers or savvy investors, this move-in ready gem has been freshly painted both inside and out. Boasting newer appliances and new laminate flooring throughout, this home is the epitome of comfort and style. The updated kitchen and bathrooms are just one of the many highlights of this must-see property. The new flooring, roof (2023) and air conditioning (2023, 2 ton) are just some of the many updates that make this home feel brand new. With a 1-car garage, you'll never have to worry about parking again. Located on public sewer and water, this home is a dream come true. And best of all, there's no HOA to worry about. Don't miss out on this incredible opportunity to own this fantastic property. Contact us today and schedule your viewing!
Key facts
- 6,098 sq ft lot
- Garage
- Built 2006
Property features AI
Exterior
- Parking: Garage (1 car)
- Utilities: Other water source; Other sewer
- Home design: Single-family residence; One level; Residential property; Zoned R-3
- Construction: Construction details: see remarks
- Exterior features: Front porch; Other roof
Interior
- Bedrooms: Total of 1 room
- Flooring: Other
- Bathrooms: 2 full bathrooms
- Heating & cooling: No heating; No cooling
- Interior features: Front porch; Other flooring
Neighborhood map
What this means for you Summary
Snapshot
- This is a 3-bed/2.0-bath manufactured listed at $5k.
Deal economics
- At list price, monthly cash flow is $2k ($19k/yr) — positive.
- The deal already cash-flows at list — no discount required.
- Meets the 1% rule at list price ($2k rent vs $5k).
Location & tenants
- Location reads 77/100 on livability (#196 in FL, #3,096 nationally) — a middle-class / working-renter tenant base. Strengths: crime A+, cost of living A+, housing A+; Watch: schools D+, amenities F, commute F.
- Polk (suburban): math 39% / reading 43% proficiency, ranked #62 of 73 in FL (top 85%) — families likely to look elsewhere, expect single-tenant / working-renter base with shorter leases.
- Market conditions: Rents rising (+2.7%/yr); 386 active listings in the ZIP; 20 comparable units currently listed for rent nearby; rentals at typical pace (median 14d on market — plan ~3-4 weeks tenant-placement turnaround); 10,384 units permitted in Polk County in 2024 (1,716 in 5+ unit buildings).
- This rent runs 38% of the median local income ($64k/yr) — at the standard rent-burdened threshold; future hikes will face affordability resistance.
Forward outlook
- Local home prices are declining (-3.0%/yr); year-one equity from $35 of loan paydown is wiped out by about $150 of value loss. Plan a longer hold.
- Polk County population projected at +33% by 2050 — long-run rental-demand tailwind backs the buy-and-hold thesis.
- At projected returns (-3.0% appreciation + 2.7% rent growth), your $1k cash investment doubles in ~1 year — after that, you're playing with house money.
Negotiation context
- Only 3 days on market — expect competitive offers; lowballing is unlikely to land.
- 6 sale attempts since 20y ago with the ask held roughly flat each time — persistent listings suggest the price (not the market) is what's stuck; bring a comps-based counter.
Risks & watch-outs
- Climate carrying-cost: severe wind risk, 99% chance of damaging wind over 30y; moderate wildfire risk; extreme-heat days projected 7→25/yr by 2055 (HVAC capex compounding) — expect insurance premiums to compound above CPI over the hold.
Questions for the listing agent
- Is there a deadline driving the sale (1031 exchange, divorce, estate, relocation)? That informs how much negotiation room exists.
- Schools are D-rated, which usually means shorter tenancies and higher turnover. Who's the typical renter profile here, and what's been the actual vacancy rate?
- The area grade is low — what's the realistic commute time and amenity access for the typical tenant pool here? Any planned neighborhood developments (good or bad) we should know about?
- What's the average days-on-market for RENTAL listings here right now (not sales)? A rising rental-DOM trend means longer vacancies and softer asking-rent achievability than the comps imply.
- What's the recent tenant-quality profile in this submarket — average credit score on applications, eviction rate, late-payment / NSF rate, and stable-employment percentage? A property-management company in the area should have these aggregated.
- How much new for-sale + rental construction is in the pipeline within 1–3 miles? Heavy new supply typically softens prices + rents 12–24 months out; constrained supply supports both.
Investment metrics
- 1% rule
- 40.91% ✓
- Cap rate
- 385.86%
- Cash-on-cash
- 1355.59%
- DSCR
- 61.32
- GRM
- 0.2
CMA / ARV
No comps found within radius.
Projected returns pro-forma
-3.0% appreciation · 2.72% rent growth · sell at horizon
- IRR
- —
- Equity multiple
- 71.98×
- Total profit
- $99,374
- Equity at exit
- $746
- IRR
- —
- Equity multiple
- 153.87×
- Total profit
- $214,016
- Equity at exit
- $432
Cash invested: $1,400 (down + closing). Projections, not guarantees.
Landlord ↔ Tenant lean methodology
- Overall (STATE)
- 87 Strongly Landlord-Friendly
- State Florida
- 87 Strongly Landlord-Friendly · R+3
- County
- — inherits STATE
- City
- — inherits STATE
ZIP-level market 33830
- Home prices YoY
- -19.8%
- Rents YoY
- 2.7%
- Active inventory
- 386
- Price-to-rent
- 0.2×
Monthly cashflow live
- Estimated rent
- $2,046 high interval (Pro) →
- Mortgage (P&I)
- −$26
- Tax est. 1.5%
- −$6 /mo · $75/yr
- Insurance
- −$2
- HOA
- −$0
- Vacancy / Maint / Mgmt
- −$430
- Net cashflow
- $1,582
Break-even live
UW: 25.0% down · 7.5% · 30yr · 1.5% tax · 5.0% vac · 8.0% maint · 8.0% mgmt
Financing live
Cash to close
- Down payment
- $1,250
- Closing costs
- $150
- Reserves months
- —
- Total cash needed
- —
Loan-product check · same deal, 3 products live
Conventional
25% down · 7.5% · 30yr
- Down + closing
- —
- Monthly P&I
- —
- Monthly cashflow
- —
- DSCR
- —
- Eligible?
- —
Personal DTI + credit; lowest rate.
DSCR
20% down · 8.5% · 30yr
- Down + closing
- —
- Monthly P&I
- —
- Monthly cashflow
- —
- DSCR
- —
- Eligible?
- —
No personal income docs; deal must DSCR.
Hard money
10% down · 12.0% · 12mo
- Down + closing
- —
- Monthly P&I
- —
- Monthly cashflow
- —
- DSCR
- —
- Eligible?
- —
Short-term bridge; refi at stabilization.
Rent comps 20 comps
| Address | Beds | Baths | Sqft | Rent | $/sqft | DOM | Units | Dist |
|---|---|---|---|---|---|---|---|---|
| 519 Patton Loop Bartow, FL | 3.0 | 2.0 | 1560 | $1,998 | $1.28 | 3d | 1 | 0.36mi |
| 212 Pershing St Bartow, FL | 4.0 | 2.0 | 1826 | $2,100 | $1.15 | 23d | 1 | 0.43mi |
| 1975 Wilder Way Eagle Lake, FL | 4.0 | 2.0 | 1733 | $2,100 | $1.21 | 10d | 1 | 0.57mi |
| 209 Windsor Reserve Dr Bartow, FL | 4.0 | 2.0 | 1839 | $1,826 | $0.99 | 3d | 1 | 0.68mi |
| 217 Windsor Reserve Dr Eagle Lake, FL | 4.0 | 2.0 | 1839 | $1,896 | $1.03 | 3d | 1 | 0.68mi |
| 3443 Rover Rd Eloise, FL | 4.0 | 2.0 | 1600 | $2,099 | $1.31 | 3d | 1 | 0.69mi |
| 303 Corbel Ln Bartow, FL | 3.0 | 2.0 | 1350 | $1,731 | $1.28 | 3d | 1 | 0.70mi |
| 1033 Holden Way Winter Haven, FL | 3.0 | 2.0 | 1560 | $1,950 | $1.25 | 14d | 1 | 0.71mi |
| 418 Reina Way Bartow, FL | 3.0 | 2.0 | 1350 | $1,666 | $1.23 | 21d | 1 | 0.72mi |
| 523 Crown Rose Dr Eagle Lake, FL | 4.0 | 2.0 | 1839 | $1,951 | $1.06 | 11d | 1 | 0.73mi |
| 531 Crown Rose Dr Bartow, FL | 4.0 | 2.0 | 1839 | $1,746 | $0.95 | 21d | 1 | 0.75mi |
| 2831 Pioneer Trl Eloise, FL | 3.0 | 2.0 | 1843 | $2,300 | $1.25 | 3d | 1 | 0.75mi |
| 2831 Pioneer Trl Eloise, FL | 3.0 | 2.0 | 1843 | $2,300 | $1.25 | 10d | 1 | 0.75mi |
| 588 Crown Rose Dr Bartow, FL | 3.0 | 2.0 | 1350 | $1,646 | $1.22 | 14d | 1 | 0.77mi |
| 328 Corbel Ln Eagle Lake, FL | 3.0 | 2.0 | 1589 | $1,676 | $1.05 | 21d | 1 | 0.78mi |
| 2782 Pioneer Trl Eagle Lake, FL | 3.0 | 2.0 | 1486 | $1,940 | $1.31 | 23d | 1 | 0.81mi |
| 948 Craftsman Rd Eagle Lake, FL | 3.0 | 2.0 | 1550 | $1,895 | $1.22 | 3d | 1 | 0.82mi |
| 2711 Pioneer Trl Eagle Lake, FL | 4.0 | 2.0 | 1836 | $2,050 | $1.12 | 23d | 1 | 0.87mi |
| 1469 Deepwater Cir Eagle Lake, FL | 3.0 | 2.0 | 1461 | $2,000 | $1.37 | 23d | 1 | 0.90mi |
| 1204 Deepwater Cir Eagle Lake, FL | 3.0 | 2.0 | 1444 | $1,900 | $1.32 | 14d | 1 | 0.95mi |
Listing history 4 events
-
2026-06-18days on market $5,000 Active 3 DOM
-
2026-06-17days on market $5,000 Active 2 DOM
-
2026-06-15remarks 294-char remark
-
2026-06-15$5,000 Active 1 DOM
ⓘ Source: listings_history table (triggers on properties + properties_extension) + one-shot
backfill from property_details.listing_events for pre-trigger history.
Climate risk First Street
- Flood 1/10 Low FEMA zone X (unshaded) · 0% chance over 30 yrs
- Wildfire 5/10 Major
- Heat 8/10 Severe 7 d/yr ≥107°F today · 25 d/yr by 30 yrs out
- Wind 9/10 Extreme 99% chance of damaging wind over 30 yrs
- Air quality 2/10 Low 2 unhealthy d/yr today · 2 by 30 yrs out
Nearby sold comps map
Loading sold comps map…
Walkable amenities ~0.75 mi
Loading nearby amenities…
Taxation est. · year 1
- Rental income
- $24,548
- − Mortgage interest
- −$280
- − Property taxes
- −$75
- − Insurance
- −$25
- − Repairs & maintenance
- −$1,964
- − Management
- −$1,964
- − Depreciation
- −$145
- Taxable income
- $20,095
- Est. tax owed @ 24.0%
- −$4,823
- After-tax cash flow
- $14,155/yr
For passive investors: Depreciation is non-cash, so a rental often shows a tax loss while cash-flowing — sheltering income. Rental losses are passive: they offset passive income freely, and up to $25,000/yr can offset ordinary (W-2) income if you actively participate and your MAGI is under $100k (phasing out to $0 by $150k); unused losses carry forward. On sale, claimed depreciation is recaptured at up to 25%, and gains may owe capital-gains tax (a 1031 exchange can defer both). Figures are a year-1 estimate at your 24.0% rate — not tax advice; consult a CPA.
Schools (NCES district)
- District
- Polk
- NCES district ID
- 1201590
- Math proficiency
- 39% ▼ -11.00%
- Reading proficiency
- 43% ▼ -4.00%
- Median HH income
- $43,979
- Composite
- 34.74/100
- National rank
- #5132
- State rank
- #62 of 73 in FL
Livability — Eagle Lake
- Score
- 77/100
- State rank
- #196
- US rank
- #3096
Category grades
Schools grade is shown separately in the Schools card above.
Census & demographics
- County
- Polk County · 740,051 people
- City population
- 4,397
- Metro
- Lakeland-Winter Haven, FL
- Population (ZIP)
- 33,740
- Household income
- $63,918
- Rent vs Own
- Severe rent burden
- 681.0
Population outlook (Polk County) Hauer SSP2
- Today (2025)
- 752,975 people
- By 2030
- 804,621 · +6.9%
- By 2040
- 906,117 · +20.3%
- By 2050
- 1,000,476 · +32.9%
- By 2075
- 1,197,520 · +59.0%
- By 2100
- 1,271,518 · +68.9%
Race, ethnicity, and origin ACS 2023
- Neighborhood character
- Diverse neighborhood (Simpson 0.62)
- Race & ethnicity
- White 55% Hispanic / Latino 22% Black 18% Two or more races 13% Asian 2%
- Hispanic origin (detail)
- Mexican 13% Puerto Rican 5%
- Common ancestry
- Italian 3% Slovak 1% Lithuanian 1%
- Foreign-born
- 8% · Canada
- Languages at home
- 81% English-only · Spanish 17% Other Indo-European 1% Other Asian/Pacific 1%
Political lean MEDSL · Polk
- 2024 margin
- Strong R (+20.7) · D 39.2% · R 59.9%
- 2008→2024 swing
- -14.6pp toward R · 2008: -6.1pp · 2024: -20.7pp
- All cycles
- 2024: R+20.7 2020: R+14.4 2016: R+14.1 2012: R+6.8 2008: R+6.1
Not yet ingested
- Civics
- —
Market trends
- HPI YoY
- ▼ -82.47%
- Current HPI
- 333.3392
- Rent YoY
- ▲ 2.72%
- Metro
- Lakeland-Winter Haven, FL
- State GDP YoY
- ▲ 3.28%
- F500 in state
- 36
Industry mix (Fortune 500 HQ in FL)
| Industry | F500 HQs | Revenue |
|---|---|---|
| Industrial Technology | 2 | $29B |
|
||
| Insurance | 2 | $17B |
|
||
| Retail | 1 | $60B |
|
||
| Technology Distribution | 1 | $58B |
|
||
| Homebuilding | 1 | $35B |
|
||
| Technology Manufacturing | 1 | $35B |
|
||
Price history
-97.1% since first listed19 events — show timeline
- 2026-06-15 Listed $5,000 HAOR as distributed by MLS GRID
- 2023-11-20 Sold (Public Records) $265,000 Public Records
- 2023-11-07 Sold (MLS) $265,000 Stellar MLS as Distributed by MLS Grid
- 2023-10-09 Pending — Stellar MLS as Distributed by MLS Grid
- 2023-10-03 Listed $255,000 Stellar MLS as Distributed by MLS Grid
- 2020-01-28 Listing Removed — Stellar MLS as Distributed by MLS Grid
- 2020-01-15 Price Changed $149,000 Stellar MLS as Distributed by MLS Grid
- 2019-12-22 Price Changed $154,900 Stellar MLS as Distributed by MLS Grid
- 2019-12-16 Listed $159,900 Stellar MLS as Distributed by MLS Grid
- 2013-07-30 Sold (MLS) $59,900 Stellar MLS as Distributed by MLS Grid
- 2013-05-25 Listed $59,900 Stellar MLS as Distributed by MLS Grid
- 2013-02-04 Listing Removed — Stellar MLS as Distributed by MLS Grid
- 2011-04-09 Listed $51,500 Stellar MLS as Distributed by MLS Grid
- 2006-09-11 Sold (Public Records) $132,900 Public Records
- 2006-09-04 Sold (MLS) $129,900 Stellar MLS as Distributed by MLS Grid
- 2006-03-24 Listed $129,900 Stellar MLS as Distributed by MLS Grid
- 2005-07-08 Sold (Public Records) $14,000 Public Records
- 1998-08-31 Sold (Public Records) $129,400 Public Records
- 1988-12-01 Sold (Public Records) $175,000 Public Records
Property tax history
+27.6%/yrLatest (2025): $2,835 · -15.5% YoY. Source: county tax records.
Cash-flow waterfall
monthlySold comps — $/sqft
last 12 mo · ≤1 miLoading sold comps…