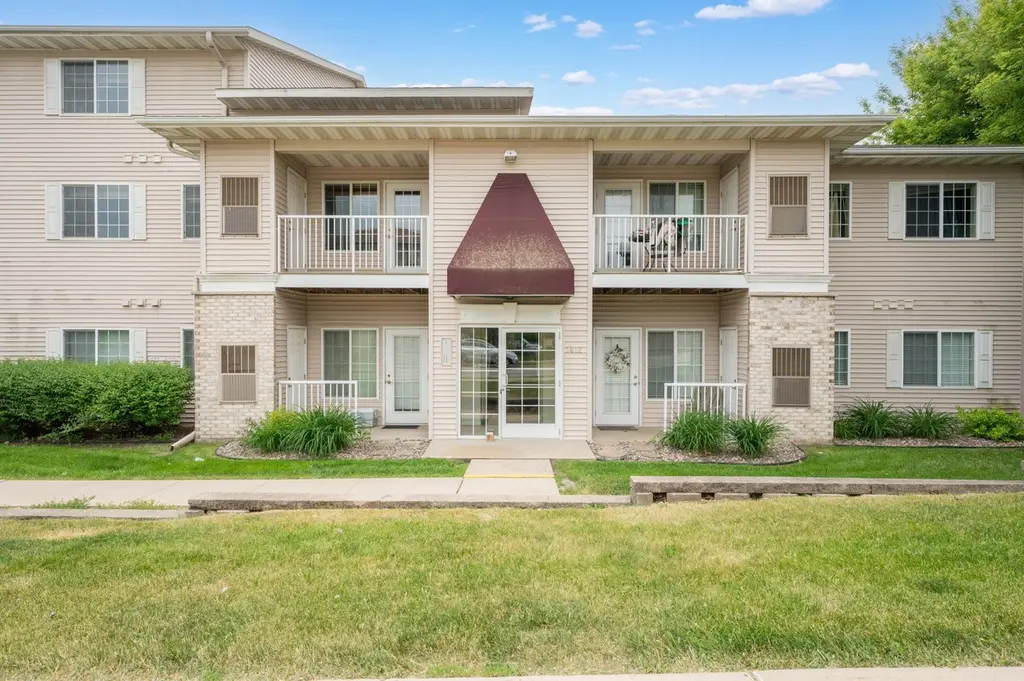
3812 9th St NW Unit C · Rochester, MN
Flood risk 5/10 · Moderate
- FEMA flood zone
- X (unshaded)
- Chance of flooding over 30 yrs
- 0.24%
- Est. flood insurance / yr
- $473 – $860
Fire risk 1/10 · Minimal
- Est. fire insurance / yr
- $888 – $1,650
Heat risk 2/10 · Minimal
- Hot days now (above 98°F)
- 7 days/yr
- Hot days in 30 yrs
- 15 days/yr
Wind risk 2/10 · Minimal
- Chance of severe wind over 30 yrs
- —
Air-quality risk 2/10 · Minimal
- Unhealthy air days now
- 1 days/yr
- Unhealthy air days in 30 yrs
- 1 days/yr
Risk factors via First Street. Map © Google.
Why this score? — see what drove the F grade
The composite is a weighted blend of 9 inputs, each scored 0–100. Each bar is that input's sub-score; the figure is the points it added to the 100-point composite (weight × sub-score).
- ARV discount +7.5/15.0
- Cash flow +4.6/30.0
- Livability +4.6/5.0
- Schools +4.1/10.0
- Rent growth +3.0/5.0
- Condition / age +2.5/5.0
- 1% rule +2.0/10.0
- DSCR +0.0/10.0
- Appreciation +0.0/10.0
$214,900
🖨 Deal sheet 📄 Offer letter ✓ Due diligence
Listing remarks
Welcome to this inviting 2-bedroom, 2-bath townhome offering a bright and open layout with vaulted ceilings and comfortable living spaces throughout. Located on the second floor, this home features a private balcony with relaxing views, creating the perfect spot to enjoy your morning coffee or unwind at the end of the day. Each bedroom has its own bathroom, offering excellent privacy and convenience for homeowners, guests, or roommates. The vaulted ceilings add a spacious feel to the main living area, while the thoughtful floor plan makes everyday living easy and functional. Enjoy low-maintenance townhome living in a convenient northwest Rochester location close to shopping, dining, parks,
Key facts
- Excellent privacy
- Private balcony
- Convenient location
Tags
Property features AI
Finance
- HOA & community: Wedgewood Pointe Condominiums HOA; Monthly association fee of $300 covering hazard insurance, lawn care, grounds maintenance, professional management, sewer, snow removal, and water
Exterior
- Parking: Asphalt parking; 1-car garage
- Utilities: City water (connected); City sewer (connected); Natural gas
- Home design: Attached residential property; Two levels
- Construction: Block foundation; Asphalt roof
- Exterior features: Vinyl exterior; Deck
Interior
- Kitchen: Kitchen center island; Dishwasher; Disposal; Microwave; Range; Refrigerator
- Bedrooms: 2 bedrooms (one on main level, one on upper level)
- Flooring: Tile floors; Natural woodwork (trim/finishings)
- Bathrooms: 2 full bathrooms (one on main level, one on upper level)
- Heating & cooling: Forced air heating; Central air conditioning
- Interior features: Natural woodwork; Tile floors; Informal dining area; Walk-in closet; Kitchen with center island
- Laundry & utility: In-unit laundry (washer and dryer)
Neighborhood map
What this means for you Summary
Snapshot
- This is a 2-bed/1.0-bath condo listed at $215k.
Deal economics
- At list price, monthly cash flow is $-542 ($-7k/yr) — negative.
- To cash-flow at today's rent, offer at most $119k (44.5% below list).
- To meet the 1% rule (rent ≥ 1% of price), the offer needs to be $150k (30.3% below list).
- Recommended offer: $119k (44.5% below list) — sets the bar for cash-flow.
Location & tenants
- Location reads 92/100 on livability (#1 in MN, #27 nationally) — a professional / high-income tenant draw. Strengths: amenities A+, commute A+, employment A+.
- Rochester Public School District (urban): math 40% / reading 51% proficiency, ranked #152 of 301 in MN (top 50%) — families likely to look elsewhere, expect single-tenant / working-renter base with shorter leases.
- Zoned schools: John Marshall Senior High (math 37% / reading 58%, grade D, #162 of 471 statewide, top 35%, 1,573 students, 43% FRL).
- Market conditions: Rents rising (+2.2%/yr); 509 active listings in the ZIP; 2 comparable units currently listed for rent nearby; solid renter incomes; 1,267 units permitted in Olmsted County in 2024 (915 in 5+ unit buildings).
Forward outlook
- Local home prices are declining (-3.0%/yr); year-one equity from $1k of loan paydown is wiped out by about $6k of value loss. Plan a longer hold.
- Olmsted County population projected at +16% by 2050 — long-run rental-demand tailwind backs the buy-and-hold thesis.
Negotiation context
- Only 14 days on market — expect competitive offers; lowballing is unlikely to land.
- 4 sale attempts since 23y ago with the ask held roughly flat each time — persistent listings suggest the price (not the market) is what's stuck; bring a comps-based counter.
- Current owner paid $118k; list at $215k implies a 82% gain — meaningful room to come down on a strong offer.
Risks & watch-outs
- Watch-outs: HOA is 20% of rent.
- Climate carrying-cost: moderate flood risk — expect insurance premiums to compound above CPI over the hold.
Questions for the listing agent
- What do current leases actually rent for vs. the listed asking? Can we see a recent rent roll and the last 12 months of T-12 income?
- What does the HOA fee cover, when was the last increase, and are there any pending special assessments or reserve-fund shortfalls?
- Any open or pending special assessments — roof, HVAC, plumbing, elevator, façade? What's the per-unit balance and payoff schedule, and is the seller paying it off at close or rolling it to the buyer?
- Is there a deadline driving the sale (1031 exchange, divorce, estate, relocation)? That informs how much negotiation room exists.
- Schools are A-rated — typically a magnet for longer-tenancy family renters. What's the average tenant stay here, and is there a school-zone premium baked into asking?
- The area grade is low — what's the realistic commute time and amenity access for the typical tenant pool here? Any planned neighborhood developments (good or bad) we should know about?
- What's the average days-on-market for RENTAL listings here right now (not sales)? A rising rental-DOM trend means longer vacancies and softer asking-rent achievability than the comps imply.
- What's the recent tenant-quality profile in this submarket — average credit score on applications, eviction rate, late-payment / NSF rate, and stable-employment percentage? A property-management company in the area should have these aggregated.
- How much new apartment / multifamily construction is in the pipeline within 1–3 miles? Heavy new supply (>2% of stock underway) typically softens rents 12–24 months out; light construction supports rent growth.
Investment metrics
- 1% rule
- 0.70% ✗
- Cap rate
- 3.27%
- Cash-on-cash
- -10.81%
- DSCR
- 0.52
- GRM
- 11.9
CMA / ARV
No comps found within radius.
Projected returns pro-forma
-3.0% appreciation · 2.18% rent growth · sell at horizon
- IRR
- -36.9%
- Equity multiple
- -0.17×
- Total profit
- $-70,390
- Equity at exit
- $32,042
- IRR
- -59.0%
- Equity multiple
- -0.83×
- Total profit
- $-109,991
- Equity at exit
- $18,581
Cash invested: $60,172 (down + closing). Projections, not guarantees.
Landlord ↔ Tenant lean methodology
- Overall (STATE)
- 46 Balanced
- State Minnesota
- 46 Balanced · D+2
- County
- — inherits STATE
- City
- — inherits STATE
ZIP-level market 55901
- Home prices YoY
- -33.2%
- Rents YoY
- 2.2%
- Active inventory
- 509
- Price-to-rent
- 11.9×
Monthly cashflow live
- Estimated rent
- $1,499 medium interval (Pro) →
- Mortgage (P&I)
- −$1,127
- Tax from tax record
- −$209 /mo · $2,512/yr
- Insurance
- −$90
- HOA
- −$300
- Vacancy / Maint / Mgmt
- −$315
- Net cashflow
- $-542
Break-even live
UW: 25.0% down · 7.5% · 30yr · 1.5% tax · 5.0% vac · 8.0% maint · 8.0% mgmt
Financing live
Cash to close
- Down payment
- $53,725
- Closing costs
- $6,447
- Reserves months
- —
- Total cash needed
- —
Loan-product check · same deal, 3 products live
Conventional
25% down · 7.5% · 30yr
- Down + closing
- —
- Monthly P&I
- —
- Monthly cashflow
- —
- DSCR
- —
- Eligible?
- —
Personal DTI + credit; lowest rate.
DSCR
20% down · 8.5% · 30yr
- Down + closing
- —
- Monthly P&I
- —
- Monthly cashflow
- —
- DSCR
- —
- Eligible?
- —
No personal income docs; deal must DSCR.
Hard money
10% down · 12.0% · 12mo
- Down + closing
- —
- Monthly P&I
- —
- Monthly cashflow
- —
- DSCR
- —
- Eligible?
- —
Short-term bridge; refi at stabilization.
Rent comps 2 comps
| Address | Beds | Baths | Sqft | Rent | $/sqft | DOM | Units | Dist |
|---|---|---|---|---|---|---|---|---|
| 1990 Ashland Dr NW Rochester, MN | 1.0–3.0 | 1.0–2.0 | 920 | $1,410 | $1.53 | 13d | 3 | 0.69mi |
| 2426 30th Ave NW Unit C Rochester, MN | 2.0 | 1.0 | 900 | $1,350 | $1.50 | 43d | 1 | 1.38mi |
HOA detail condo
- Monthly dues
- $300 · $3,600/yr
- Assessments
- None detected in remarks — confirm with the listing agent.
Listing history 12 events
-
2026-06-19days on market $214,900 Active 14 DOM
-
2026-06-18days on market $214,900 Active 13 DOM
-
2026-06-17days on market $214,900 Active 12 DOM
-
2026-06-16days on market $214,900 Active 11 DOM
-
2026-06-15days on market $214,900 Active 10 DOM
-
2026-06-14days on market $214,900 Active 8 DOM
-
2026-06-13days on market $214,900 Active 7 DOM
-
2026-06-10days on market $214,900 Active 5 DOM
-
2026-06-09days on market $214,900 Active 4 DOM
-
2026-06-08days on market $214,900 Active 3 DOM
-
2026-06-07remarks 699-char remark
-
2026-06-07$214,900 Active 2 DOM
ⓘ Source: listings_history table (triggers on properties + properties_extension) + one-shot
backfill from property_details.listing_events for pre-trigger history.
Tax reassessment forecast MN · Partial reset (capped growth)
- Current annual tax
- $2,512 · $209/mo
- Projected year-2 tax
- $2,512 · $209/mo
- Expected delta
- $0/yr ($0/mo · 0.0%)
ⓘ Screening estimate from a state-policy table — verify with the county assessor before closing.
Climate risk First Street
- Flood 5/10 Major FEMA zone X (unshaded) · 24% chance over 30 yrs
- Wildfire 1/10 Low
- Heat 2/10 Low 7 d/yr ≥98°F today · 15 d/yr by 30 yrs out
- Wind 2/10 Low
- Air quality 2/10 Low 1 unhealthy d/yr today · 1 by 30 yrs out
Nearby sold comps map
Loading sold comps map…
Walkable amenities ~0.75 mi
Loading nearby amenities…
Taxation est. · year 1
- Rental income
- $17,984
- − Mortgage interest
- −$12,038
- − Property taxes
- −$2,512
- − Insurance
- −$1,074
- − Repairs & maintenance
- −$1,439
- − Management
- −$1,439
- − HOA
- −$3,600
- − Depreciation
- −$6,252
- Taxable loss
- −$10,369
- Est. tax savings @ 24.0%
- +$2,489
- After-tax cash flow
- $-4,014/yr
For passive investors: Depreciation is non-cash, so a rental often shows a tax loss while cash-flowing — sheltering income. Rental losses are passive: they offset passive income freely, and up to $25,000/yr can offset ordinary (W-2) income if you actively participate and your MAGI is under $100k (phasing out to $0 by $150k); unused losses carry forward. On sale, claimed depreciation is recaptured at up to 25%, and gains may owe capital-gains tax (a 1031 exchange can defer both). Figures are a year-1 estimate at your 24.0% rate — not tax advice; consult a CPA.
Schools (NCES district)
- District
- Rochester Public School District
- NCES district ID
- 2731800
- Math proficiency
- 40% ▼ -10.00%
- Reading proficiency
- 51% ▼ -4.00%
- Median HH income
- $66,540
- Composite
- 40.6/100
- National rank
- #3695
- State rank
- #152 of 301 in MN
Livability — Rochester
- Score
- 92/100
- State rank
- #1
- US rank
- #27
Category grades
Schools grade is shown separately in the Schools card above.
Census & demographics
- Census place
- Rochester, MN
- County
- Olmsted County · 135,035 people
- City population
- 135,035
- Metro
- Rochester, MN
- Population (ZIP)
- 58,495
- Household income
- $94,607
- Rent vs Own
- Severe rent burden
- 1651.0
Population outlook (Olmsted County) Hauer SSP2
- Today (2025)
- 165,999 people
- By 2030
- 172,425 · +3.9%
- By 2040
- 183,785 · +10.7%
- By 2050
- 192,981 · +16.3%
- By 2075
- 215,284 · +29.7%
- By 2100
- 224,887 · +35.5%
Race, ethnicity, and origin ACS 2023
- Neighborhood character
- Predominantly White (71%)
- Race & ethnicity
- White 71% Black 12% Asian 8% Two or more races 6% Hispanic / Latino 5%
- Hispanic origin (detail)
- Mexican 3%
- Common ancestry
- Portuguese 11% Romanian 3% Iranian 2%
- Foreign-born
- 15% · Canada, Vietnam, China
- Languages at home
- 81% English-only · Spanish 3% Other Asian/Pacific 3% Arabic 2%
Political lean MEDSL · Olmsted
- 2024 margin
- D (+10.7) · D 54.3% · R 43.6% · Other 2.1%
- 2008→2024 swing
- +7.4pp toward D · 2008: 3.3pp · 2024: 10.7pp
- All cycles
- 2024: D+10.7 2020: D+10.7 2016: D+0.8 2012: D+3.2 2008: D+3.3
Not yet ingested
- Civics
- —
Market trends
- HPI YoY
- ▼ -126.08%
- Current HPI
- 253.7999
- Rent YoY
- ▲ 2.18%
- Metro
- Rochester, MN
- State GDP YoY
- ▲ 2.41%
- F500 in state
- 34
Industry mix (Fortune 500 HQ in MN)
| Industry | F500 HQs | Revenue |
|---|---|---|
| Healthcare | 2 | $407B |
|
||
| Retail | 2 | $150B |
|
||
| Consumer Goods | 2 | $32B |
|
||
| Industrial Machinery | 2 | $6B |
|
||
| Agriculture | 1 | $40B |
|
||
| Healthcare / Medical Devices | 1 | $32B |
|
||
Price history
+82.4% since first listed10 events — show timeline
- 2026-06-05 Listed $214,900 NORTHSTARMLS as Distributed by MLS Grid
- 2018-12-09 Listing Removed — NORTHSTARMLS as Distributed by MLS Grid
- 2012-01-18 Listed $124,900 NORTHSTARMLS as Distributed by MLS Grid
- 2010-02-16 Listing Removed — NORTHSTARMLS as Distributed by MLS Grid
- 2009-10-23 Listed $124,900 NORTHSTARMLS as Distributed by MLS Grid
- 2007-04-03 Sold (Public Records) $118,000 Public Records
- 2003-07-03 Sold (Public Records) $111,000 Public Records
- 2003-07-02 Sold (MLS) $111,000 NORTHSTARMLS as Distributed by MLS Grid
- 2003-06-13 Listing Removed — NORTHSTARMLS as Distributed by MLS Grid
- 2003-06-02 Listed $117,800 NORTHSTARMLS as Distributed by MLS Grid
Property tax history
+4.4%/yrLatest (2025): $2,512 · +7.5% YoY. Source: county tax records.
Cash-flow waterfall
monthlySold comps — $/sqft
last 12 mo · ≤1 miLoading sold comps…