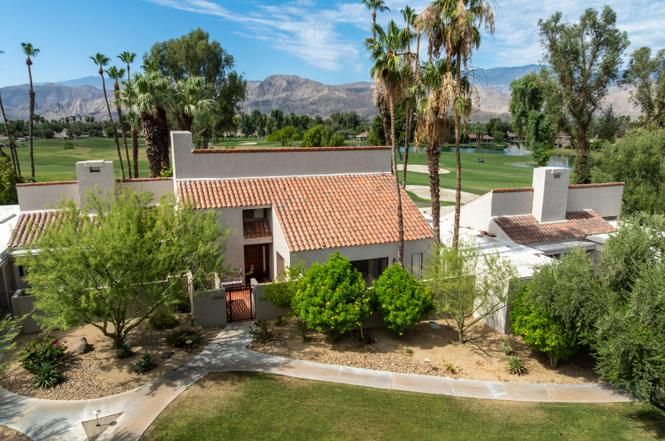
34945 Mission Hills Dr · Rancho Mirage, CA
Flood risk 1/10 · Minimal
- FEMA flood zone
- X (unshaded)
- Chance of flooding over 30 yrs
- 0.0%
- Est. flood insurance / yr
- $507 – $1,088
Fire risk 3/10 · Minor
- Est. fire insurance / yr
- $659 – $1,223
Heat risk 9/10 · Severe
- Hot days now (above 113°F)
- 4 days/yr
- Hot days in 30 yrs
- 11 days/yr
Wind risk 1/10 · Minimal
- Chance of severe wind over 30 yrs
- —
Air-quality risk 4/10 · Minor
- Unhealthy air days now
- 5 days/yr
- Unhealthy air days in 30 yrs
- 7 days/yr
Risk factors via First Street. Map © Google.
Why this score? — see what drove the D grade
The composite is a weighted blend of 9 inputs, each scored 0–100. Each bar is that input's sub-score; the figure is the points it added to the 100-point composite (weight × sub-score).
- Cash flow +14.7/30.0
- ARV discount +7.5/15.0
- 1% rule +5.2/10.0
- DSCR +4.5/10.0
- Rent growth +3.4/5.0
- Schools +2.7/10.0
- Livability +2.6/5.0
- Condition / age +2.5/5.0
- Appreciation +0.0/10.0
$589,000
🖨 Deal sheet (PDF) 📄 Offer letter ✓ Due diligence
Listing remarks MLS
Wonderfully maintained, gorgeous Southern Mountain & Water Views on the 2nd Fairway of the Tournament Course at Mission Hills Country Club. Super 2-story home with new A/C & Heating Systems, new Roof w/ EnergySaving 2- layer lining, new Dishwasher, new Alarm System and the list goes on & on. Fabulous location!!! Retro 70's decor.
Key facts
- Remodeled kitchen
- Sunken living room
- Golf course views
Tags
Property features AI
Finance
- Other: CC&R and homeowners association disclosures; Short-term rentals not allowed; Will not consider lease; Listing terms: conventional or cash
- Financial info: Land is lease type with annual land lease amount; Land lease amount annual: $9,600
- HOA & community: Monthly HOA fee of $1,073; HOA covers building & grounds, trash, and cable TV; Association provides controlled access, management, grounds maintenance, and guest parking; Association pet rules apply
Exterior
- Parking: Detached 2-car garage; Garage door opener; Total 2 parking spaces
- Security: Controlled access; 24-hour security; Gated community
- Utilities: Private water; Septic sewer
- Home design: Condominium, attached; Two-story; Updated/remodeled
- Construction: Stucco exterior; Tile roof; Year built (source: assessor)
- Exterior features: Located on a golf course; Golf and mountain views; Drip and sprinkler irrigation; Community pool and spa (in-ground); Community amenities include pickleball courts; 24-hour security; Gated community; Sprinkler system
Interior
- Bedrooms: Main floor bedroom
- Flooring: Carpet; Tile
- Bathrooms: 2 full bathrooms; 1 three-quarter bathroom
- Heating & cooling: Central heating; Central air conditioning
- Interior features: Sunken living room; Vaulted ceilings; Turnkey (furnished)
- Laundry & utility: Laundry in an individual room
Neighborhood map
What this means for you Summary
Snapshot
- This is a 3-bed/2.5-bath condo listed at $589k.
Deal economics
- At list price, monthly cash flow is $147 ($2k/yr) — positive.
- The deal already cash-flows at list — no discount required.
- Meets the 1% rule at list price ($6k rent vs $589k).
- Cap rate 6.6% vs local median 3.0% in Rancho Mirage — top-decile yield for the area; either an underpriced asset or a hidden risk that comps aren't pricing in. Stress-test before assuming the spread holds.
Location & tenants
- Location reads 51/100 on livability (#1,065 in CA) — a working-class tenant base; expect higher turnover. Strengths: employment A+; Watch: amenities F, commute F, cost of living F.
- Palm Springs Unified (suburban): math 21% / reading 42% proficiency, ranked #328 of 517 in CA (top 63%) — families likely to look elsewhere, expect single-tenant / working-renter base with shorter leases; 73% free/reduced lunch — lower-income household profile, screen leases tightly.
- Zoned schools: Rancho Mirage Elementary (309 students, 86% FRL); Nellie N. Coffman Middle (953 students, 98% FRL); Rancho Mirage High (math 15% / reading 38%, grade F, #804 of 1,170 statewide, top 69%, 1,491 students, 97% FRL) — zoned schools average 94% FRL vs 73% district-wide (20 pts higher); higher-poverty schools than district average — tighter screening recommended.
- Market conditions: Rents rising (+3.7%/yr); 532 active listings in the ZIP; 40 comparable units currently listed for rent nearby; rentals lingering (median 46d on market — plan ~5-8 weeks vacancy on turnover, expect pricing pressure); 68% of comp listings sitting > 30 days — soft ceiling on asking rent; solid renter incomes; 9,195 units permitted in Riverside County in 2024 (1,512 in 5+ unit buildings).
- At $6,021/mo this rent would consume 67% of the median local household income ($107k/yr) (locally 498% of renters already pay >50% of income on rent) — very limited rent-growth headroom before tenants either downsize or default.
Forward outlook
- Local home prices are declining (-3.0%/yr); year-one equity from $4k of loan paydown is wiped out by about $18k of value loss. Plan a longer hold.
- Riverside County population projected at +22% by 2050 — long-run rental-demand tailwind backs the buy-and-hold thesis.
Negotiation context
- Only 5 days on market — expect competitive offers; lowballing is unlikely to land.
- 2 sale attempts since 11y ago with the ask held roughly flat each time — persistent listings suggest the price (not the market) is what's stuck; bring a comps-based counter.
- Current owner paid $270k; list at $589k implies a 118% gain — meaningful room to come down on a strong offer.
Risks & watch-outs
- Climate carrying-cost: extreme-heat days projected 4→11/yr by 2055 (HVAC capex compounding) — expect insurance premiums to compound above CPI over the hold.
Questions for the listing agent
- Built in 1971 — when were the roof, HVAC, electrical panel, plumbing, and water heater last replaced?
- What does the HOA fee cover, when was the last increase, and are there any pending special assessments or reserve-fund shortfalls?
- Any open or pending special assessments — roof, HVAC, plumbing, elevator, façade? What's the per-unit balance and payoff schedule, and is the seller paying it off at close or rolling it to the buyer?
- Is there a deadline driving the sale (1031 exchange, divorce, estate, relocation)? That informs how much negotiation room exists.
- The area grade is low — what's the realistic commute time and amenity access for the typical tenant pool here? Any planned neighborhood developments (good or bad) we should know about?
- What's the average days-on-market for RENTAL listings here right now (not sales)? A rising rental-DOM trend means longer vacancies and softer asking-rent achievability than the comps imply.
- What's the recent tenant-quality profile in this submarket — average credit score on applications, eviction rate, late-payment / NSF rate, and stable-employment percentage? A property-management company in the area should have these aggregated.
- How much new apartment / multifamily construction is in the pipeline within 1–3 miles? Heavy new supply (>2% of stock underway) typically softens rents 12–24 months out; light construction supports rent growth.
Investment metrics
- 1% rule
- 1.02% ✓
- Cap rate
- 6.59%
- Cash-on-cash
- 1.07%
- DSCR
- 1.05
- GRM
- 8.2
CMA / ARV
No comps found within radius.
Projected returns pro-forma
-3.0% appreciation · 3.72% rent growth · sell at horizon
- IRR
- -13.6%
- Equity multiple
- 0.51×
- Total profit
- $-81,258
- Equity at exit
- $87,822
- IRR
- -3.4%
- Equity multiple
- 0.77×
- Total profit
- $-38,685
- Equity at exit
- $50,926
Cash invested: $164,920 (down + closing). Projections, not guarantees.
Landlord ↔ Tenant lean methodology
- Overall (STATE)
- 18 Strongly Tenant-Friendly
- State California
- 18 Strongly Tenant-Friendly · D+13
- County
- — inherits STATE
- City
- — inherits STATE
ZIP-level market 92270
- Rents YoY
- 3.7%
- Active inventory
- 532
- Price-to-rent
- 8.2×
Monthly cashflow live
- Estimated rent
- $6,021 high interval (Pro) →
- Mortgage (P&I)
- −$3,089
- Tax from tax record
- −$202 /mo · $2,430/yr
- Insurance
- −$245
- HOA
- −$1,073
- Vacancy / Maint / Mgmt
- −$1,264
- Net cashflow
- $147
Break-even live
Sensitivity live
| Price | -10% $481 | -5% $314 | +0% $147 | +5% $-20 | +10% $-186 |
|---|---|---|---|---|---|
| Rent | -10% $-329 | -5% $-91 | +0% $147 | +5% $385 | +10% $623 |
| Rate | -1.0pp $444 | -0.5pp $297 | base $147 | +0.5pp $-6 | +1.0pp $-161 |
UW: 25.0% down · 7.5% · 30yr · 1.5% tax · 5.0% vac · 8.0% maint · 8.0% mgmt
Financing live
Cash to close
- Down payment
- $147,250
- Closing costs
- $17,670
- Reserves months
- —
- Total cash needed
- —
Loan-product check · same deal, 3 products live
Conventional
25% down · 7.5% · 30yr
- Down + closing
- —
- Monthly P&I
- —
- Monthly cashflow
- —
- DSCR
- —
- Eligible?
- —
Personal DTI + credit; lowest rate.
DSCR
20% down · 8.5% · 30yr
- Down + closing
- —
- Monthly P&I
- —
- Monthly cashflow
- —
- DSCR
- —
- Eligible?
- —
No personal income docs; deal must DSCR.
Hard money
10% down · 12.0% · 12mo
- Down + closing
- —
- Monthly P&I
- —
- Monthly cashflow
- —
- DSCR
- —
- Eligible?
- —
Short-term bridge; refi at stabilization.
Rent comps 40 comps
| Address | Beds | Baths | Sqft | Rent | $/sqft | DOM | Units | Dist |
|---|---|---|---|---|---|---|---|---|
| 35018 Mission Hills Dr Rancho Mirage, CA | 3.0 | 3.0 | 3066 | $7,500 | $2.45 | 18d | 1 | 0.18mi |
| 35018 Mission Hills Dr Rancho Mirage, CA | 3.0 | 3.0 | 3066 | $7,500 | $2.45 | 45d | 1 | 0.18mi |
| 522 Desert West Dr Rancho Mirage, CA | 2.0 | 2.0 | 1984 | $4,500 | $2.27 | 45d | 1 | 0.23mi |
| 645 Hospitality Dr Rancho Mirage, CA | 3.0 | 3.0 | 2727 | $4,300 | $1.58 | 45d | 1 | 0.30mi |
| 714 Inverness Dr Rancho Mirage, CA | 3.0 | 3.0 | 2227 | $3,500 | $1.57 | 45d | 1 | 0.31mi |
| 507 Desert West Dr Rancho Mirage, CA | 3.0 | 2.0 | 2265 | $8,500 | $3.75 | 45d | 1 | 0.32mi |
| 35082 Mission Hills Dr Rancho Mirage, CA | 2.0 | 2.5 | 1624 | $3,250 | $2.00 | 14d | 1 | 0.35mi |
| 35090 Mission Hills Dr Rancho Mirage, CA | 2.0 | 2.0 | 1596 | $3,950 | $2.47 | 26d | 1 | 0.37mi |
| 624 Hospitality Dr Rancho Mirage, CA | 2.0 | 2.0 | 2000 | $3,295 | $1.65 | 45d | 1 | 0.40mi |
| 913 Inverness Dr Rancho Mirage, CA | 3.0 | 3.0 | 2690 | $6,800 | $2.53 | 45d | 1 | 0.42mi |
| 13 Vista Mirage Way Rancho Mirage, CA | 3.0 | 2.0 | 2071 | $3,700 | $1.79 | 46d | 1 | 0.58mi |
| 9 Via Santanella Rancho Mirage, CA | 3.0 | 4.0 | 3108 | $11,999 | $3.86 | 45d | 1 | 0.61mi |
| 37 Shoreline Dr Rancho Mirage, CA | 3.0 | 3.0 | 1928 | $3,650 | $1.89 | 45d | 1 | 0.62mi |
| 20 Lincoln Pl Rancho Mirage, CA | 3.0 | 3.5 | 2700 | $3,995 | $1.48 | 45d | 1 | 0.67mi |
| 829 Inverness Dr Rancho Mirage, CA | 4.0 | 3.0 | 2527 | $11,000 | $4.35 | 14d | 1 | 0.68mi |
| 464 Sunningdale Dr Rancho Mirage, CA | 3.0 | 3.0 | 1751 | $6,000 | $3.43 | 45d | 1 | 0.68mi |
| 59 Shoreline Dr Rancho Mirage, CA | 3.0 | 3.5 | 2235 | $3,995 | $1.79 | 45d | 1 | 0.69mi |
| 41 Lincoln Pl Rancho Mirage, CA | 3.0 | 3.0 | 2272 | $4,900 | $2.16 | 45d | 1 | 0.70mi |
| 9 Loch Ness Lake Ct Rancho Mirage, CA | 4.0 | 4.5 | 2373 | $5,000 | $2.11 | 45d | 1 | 0.72mi |
| 99 Shoreline Dr Rancho Mirage, CA | 3.0 | 3.0 | 2102 | $4,000 | $1.90 | 45d | 1 | 0.77mi |
| 69 San Marino Cir Rancho Mirage, CA | 3.0 | 2.5 | 2601 | $3,795 | $1.46 | 23d | 1 | 0.85mi |
| 136 Royal Saint Georges Way Rancho Mirage, CA | 3.0 | 3.0 | 3349 | $13,000 | $3.88 | 22d | 1 | 0.92mi |
| 70895 Ironwood Dr Rancho Mirage, CA | 4.0 | 2.5 | 2575 | $7,995 | $3.10 | 7d | 1 | 0.93mi |
| 278 Loch Lomond Rd Rancho Mirage, CA | 4.0 | 4.0 | 2471 | $12,000 | $4.86 | 45d | 1 | 1.00mi |
| 36726 Jasmine Ln Rancho Mirage, CA | 4.0 | 3.0 | 2539 | $14,000 | $5.51 | 45d | 1 | 1.06mi |
| 22 Calle Escala Rancho Mirage, CA | 3.0 | 2.5 | 2116 | $3,800 | $1.80 | 12d | 1 | 1.07mi |
| 267 Loch Lomond Rd Rancho Mirage, CA | 4.0 | 5.0 | 3038 | $13,000 | $4.28 | 45d | 1 | 1.08mi |
| 253 Loch Lomond Rd Rancho Mirage, CA | 3.0 | 4.0 | 2452 | $11,900 | $4.85 | 45d | 1 | 1.08mi |
| 24 Via Las Flores Rancho Mirage, CA | 2.0 | 2.0 | 2331 | $6,500 | $2.79 | 45d | 1 | 1.10mi |
| 96 Via Bella Rancho Mirage, CA | 3.0 | 3.5 | 3006 | $13,000 | $4.32 | 45d | 1 | 1.13mi |
| 70451 Cobb Rd Rancho Mirage, CA | 3.0 | 2.0 | 2148 | $3,750 | $1.75 | 45d | 1 | 1.13mi |
| 38 Burgundy Rancho Mirage, CA | 3.0 | 3.0 | 2726 | $4,500 | $1.65 | 20d | 1 | 1.15mi |
| 42 Colonial Dr Rancho Mirage, CA | 3.0 | 3.0 | 2005 | $3,600 | $1.80 | 5d | 1 | 1.20mi |
| 42 Colonial Dr Rancho Mirage, CA | 3.0 | 3.0 | 2005 | $3,600 | $1.80 | 23d | 1 | 1.20mi |
| 22 San Leandro Ct Rancho Mirage, CA | 3.0 | 3.5 | 2563 | $5,500 | $2.15 | 45d | 1 | 1.20mi |
| 39 Barolo Rancho Mirage, CA | 2.0 | 2.5 | 2509 | $10,000 | $3.99 | 45d | 1 | 1.22mi |
| 70181 Chappel Rd Rancho Mirage, CA | 4.0 | 3.0 | 2000 | $5,900 | $2.95 | 45d | 1 | 1.22mi |
| 250 S Paseo Laredo Cathedral City, CA | 2.0 | 2.0 | 1600 | $1,800 | $1.12 | 14d | 1 | 1.24mi |
| 5 Chandra Ln Rancho Mirage, CA | 3.0 | 2.0 | 2015 | $4,000 | $1.99 | 45d | 1 | 1.26mi |
| 37641 Peacock Cir Rancho Mirage, CA | 3.0 | 3.0 | 2395 | $6,500 | $2.71 | 26d | 1 | 1.29mi |
HOA detail condo
- Monthly dues
- $1,073 · $12,876/yr
- Likely covers
- water
- Assessments
- None detected in remarks — confirm with the listing agent.
Listing history 4 events
-
2026-06-21days on market $589,000 Active 5 DOM
-
2026-06-18days on market $589,000 Active 2 DOM
-
2026-06-17remarks 695-char remark
-
2026-06-17$589,000 Active 1 DOM
ⓘ Source: listings_history table (triggers on properties + properties_extension) + one-shot
backfill from property_details.listing_events for pre-trigger history.
Tax reassessment forecast CA · Resets to sale price
- Current annual tax
- $2,430 · $202/mo
- Projected year-2 tax
- $4,476 · $373/mo
- Expected delta
- +$2,047/yr (+$171/mo · 84.2%)
ⓘ Screening estimate from a state-policy table — verify with the county assessor before closing.
Climate risk First Street
- Flood 1/10 Low FEMA zone X (unshaded) · 0% chance over 30 yrs
- Wildfire 3/10 Moderate
- Heat 9/10 Extreme 4 d/yr ≥113°F today · 11 d/yr by 30 yrs out
- Wind 1/10 Low
- Air quality 4/10 Moderate 5 unhealthy d/yr today · 7 by 30 yrs out
Nearby sold comps map
Loading sold comps map…
Walkable amenities ~0.75 mi
Loading nearby amenities…
Taxation est. · year 1
- Rental income
- $72,255
- − Mortgage interest
- −$32,993
- − Property taxes
- −$2,430
- − Insurance
- −$2,945
- − Repairs & maintenance
- −$5,780
- − Management
- −$5,780
- − HOA
- −$12,876
- − Depreciation
- −$17,135
- Taxable loss
- −$7,684
- Est. tax savings @ 24.0%
- +$1,844
- After-tax cash flow
- $3,610/yr
For passive investors: Depreciation is non-cash, so a rental often shows a tax loss while cash-flowing — sheltering income. Rental losses are passive: they offset passive income freely, and up to $25,000/yr can offset ordinary (W-2) income if you actively participate and your MAGI is under $100k (phasing out to $0 by $150k); unused losses carry forward. On sale, claimed depreciation is recaptured at up to 25%, and gains may owe capital-gains tax (a 1031 exchange can defer both). Figures are a year-1 estimate at your 24.0% rate — not tax advice; consult a CPA.
Schools (NCES district)
- District
- Palm Springs Unified
- NCES district ID
- 0629550
- Math proficiency
- 21% ▼ -7.00%
- Reading proficiency
- 42% ▬ 0.00%
- Median HH income
- $43,638
- Composite
- 26.76/100
- National rank
- #7131
- State rank
- #328 of 517 in CA
Livability — Rancho Mirage
- Score
- 51/100
- State rank
- #1065
- US rank
- #25255
Category grades
Schools grade is shown separately in the Schools card above.
Census & demographics
- Census place
- Rancho Mirage, CA
- County
- Riverside County · 2,287,001 people
- City population
- 17,563
- Metro
- Riverside-San Bernardino-Ontario, CA
- Population (ZIP)
- 17,563
- Household income
- $107,364
- Rent vs Own
- Severe rent burden
- 498.0
Population outlook (Riverside County) Hauer SSP2
- Today (2025)
- 2,664,475 people
- By 2030
- 2,802,692 · +5.2%
- By 2040
- 3,050,904 · +14.5%
- By 2050
- 3,256,783 · +22.2%
- By 2075
- 3,655,058 · +37.2%
- By 2100
- 3,766,594 · +41.4%
Race, ethnicity, and origin ACS 2023
- Neighborhood character
- Predominantly White (77%)
- Race & ethnicity
- White 77% Hispanic / Latino 15% Two or more races 6% Asian 4% Black 2%
- Hispanic origin (detail)
- Mexican 12%
- Common ancestry
- Slovak 4% Romanian 3% Lithuanian 3%
- Foreign-born
- 17% · Canada, South Korea, China
- Languages at home
- 81% English-only · Spanish 11% Other Indo-European 3% French/Haitian/Cajun 1%
Political lean MEDSL · Riverside
- 2024 margin
- Toss-up / Even · D 48.0% · R 49.3% · Other 2.6%
- 2008→2024 swing
- -3.6pp toward R · 2008: 2.3pp · 2024: -1.3pp
- All cycles
- 2024: R+1.3 2020: D+8.0 2016: D+4.3 2012: R+0.4 2008: D+2.3
Not yet ingested
- Civics
- —
Market trends
- HPI YoY
- ▼ -210.99%
- Current HPI
- 282.2957
- Rent YoY
- ▲ 3.72%
- Metro
- Riverside-San Bernardino-Ontario, CA
- State GDP YoY
- ▲ 3.21%
- F500 in state
- 116
Industry mix (Fortune 500 HQ in CA)
| Industry | F500 HQs | Revenue |
|---|---|---|
| Technology | 27 | $1,492B |
|
||
| Financial Services | 3 | $174B |
|
||
| Retail | 3 | $44B |
|
||
| Insurance | 3 | $26B |
|
||
| Media / Entertainment | 2 | $115B |
|
||
| Pharmaceuticals / Biotech | 2 | $62B |
|
||
Price history
+111.1% since first listed5 events — show timeline
- 2026-06-14 Listed $589,000 GPSMLS
- 2015-09-30 Sold (MLS) $270,000 GPSMLS
- 2015-09-14 Pending — GPSMLS
- 2015-08-25 Contingent — GPSMLS
- 2015-04-21 Listed $279,000 GPSMLS
Property tax history
+0.0%/yrLatest (2025): $2,430 · -1.6% YoY. Source: county tax records.
Cash-flow waterfall
monthlySold comps — $/sqft
last 12 mo · ≤1 miLoading sold comps…