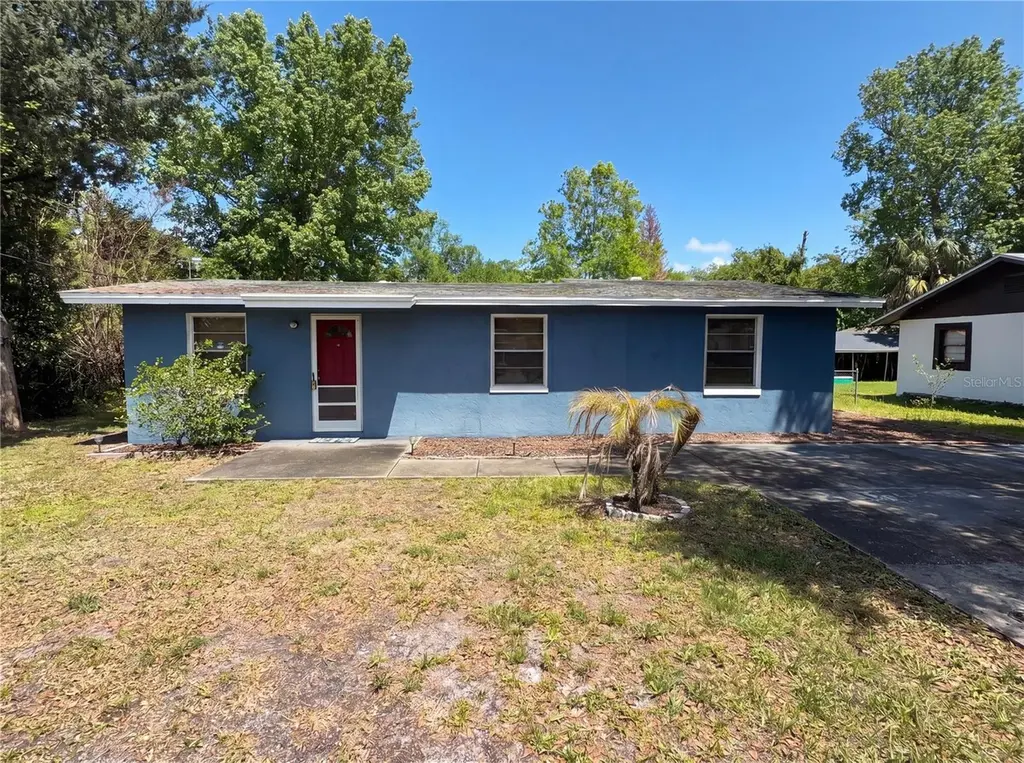
1385 Bender Ave · Holly Hill, FL
Flood risk 6/10 · Moderate
- FEMA flood zone
- X (shaded)
- Chance of flooding over 30 yrs
- 0.68%
- Est. flood insurance / yr
- $507 – $1,088
Fire risk 1/10 · Minimal
- Est. fire insurance / yr
- $947 – $1,759
Heat risk 10/10 · Severe
- Hot days now (above 104°F)
- 7 days/yr
- Hot days in 30 yrs
- 20 days/yr
Wind risk 10/10 · Severe
- Chance of severe wind over 30 yrs
- 99.0%
Air-quality risk 2/10 · Minimal
- Unhealthy air days now
- 1 days/yr
- Unhealthy air days in 30 yrs
- 1 days/yr
Risk factors via First Street. Map © Google.
Why this score? — see what drove the D- grade
The composite is a weighted blend of 9 inputs, each scored 0–100. Each bar is that input's sub-score; the figure is the points it added to the 100-point composite (weight × sub-score).
- Cash flow +11.9/30.0
- ARV discount +7.5/15.0
- Schools +3.9/10.0
- Livability +3.6/5.0
- DSCR +3.5/10.0
- 1% rule +3.4/10.0
- Rent growth +2.8/5.0
- Condition / age +2.5/5.0
- Appreciation +0.0/10.0
$157,000
🖨 Deal sheet 📄 Offer letter ✓ Due diligence
Listing remarks
Explore 1385 Bender Ave, a residence arranged for everyday practicality and comfortable use. The kitchen includes an accent backsplash, providing a subtle design element. An exterior patio extends to a fully fenced in backyard, complemented by a useful storage shed for additional utility. This home blends functional design with delightful outdoor spaces. Included 100-Day Home Warranty with buyer activation
Key facts
- Storage shed
- Exterior patio
- Accent backsplash
Tags
Property features AI
Finance
- Other: Property type: Residential, single family; Living area approximately 1,016 sq ft
- Financial info: Lease restrictions apply
- HOA & community: No association amenities listed; Not in a subdivision
Exterior
- Parking: Driveway
- Security: Owned security system
- Utilities: Public water; Septic tank; Electricity available
- Home design: Single family residence; One story; Faces southwest
- Construction: Stucco construction; Shingle roof; Slab foundation; Built on property of less than 1/4 acre
- Exterior features: Other exterior features
Interior
- Kitchen: Dishwasher; Microwave; Electric water heater
- Bedrooms: 2 bedrooms
- Flooring: Carpet; Vinyl
- Bathrooms: 1 full bathroom
- Heating & cooling: Central heating; Heat pump; Central air conditioning
- Interior features: L-shaped dining area; Stone counters; Security system (owned)
- Laundry & utility: No in-home laundry listed
Neighborhood map
What this means for you Summary
Snapshot
- This is a 1-bed/1.0-bath single-family listed at $157k.
Deal economics
- At list price, monthly cash flow is $-40 ($-482/yr) — negative.
- To cash-flow at today's rent, offer at most $150k (4.5% below list).
- To meet the 1% rule (rent ≥ 1% of price), the offer needs to be $131k (16.5% below list).
- Recommended offer: $131k (16.5% below list) — sets the bar for 1% rule.
Location & tenants
- Location reads 72/100 on livability (#325 in FL) — a middle-class / working-renter tenant base. Strengths: cost of living A+, housing A+, health & safety A+; Watch: schools F, amenities F, commute F.
- Volusia (suburban): math 44% / reading 49% proficiency, ranked #47 of 73 in FL (top 64%) — families likely to look elsewhere, expect single-tenant / working-renter base with shorter leases.
- Market conditions: Rents rising (+1.0%/yr); 332 active listings in the ZIP; 33 comparable units currently listed for rent nearby; rentals at typical pace (median 24d on market — plan ~3-4 weeks tenant-placement turnaround); 3,402 units permitted in Volusia County in 2024 (681 in 5+ unit buildings).
Forward outlook
- Local home prices are declining (-3.0%/yr); year-one equity from $1k of loan paydown is wiped out by about $5k of value loss. Plan a longer hold.
- Volusia County population projected at +19% by 2050 — long-run rental-demand tailwind backs the buy-and-hold thesis.
Negotiation context
- It's been on market 52 days — a 3% lower offer ($152k) is reasonable based on typical stale-listing flexibility.
- Current owner paid $119k; 32% above their basis — modest negotiation headroom, anchor on the comps not their cost.
Risks & watch-outs
- Watch-outs: built in 1952 — expect roof / HVAC / electrical / plumbing capex.
- Climate carrying-cost: major flood risk; severe wind risk, 99% chance of damaging wind over 30y; extreme-heat days projected 7→20/yr by 2055 (HVAC capex compounding) — expect insurance premiums to compound above CPI over the hold.
Questions for the listing agent
- What do current leases actually rent for vs. the listed asking? Can we see a recent rent roll and the last 12 months of T-12 income?
- It's been on market 52 days. Have you received any prior offers? Is the seller open to a 16% concession, seller financing, or rate buy-down credit?
- Built in 1952 — when were the roof, HVAC, electrical panel, plumbing, and water heater last replaced?
- Is there a deadline driving the sale (1031 exchange, divorce, estate, relocation)? That informs how much negotiation room exists.
- Schools are F-rated, which usually means shorter tenancies and higher turnover. Who's the typical renter profile here, and what's been the actual vacancy rate?
- The area grade is low — what's the realistic commute time and amenity access for the typical tenant pool here? Any planned neighborhood developments (good or bad) we should know about?
- What's the average days-on-market for RENTAL listings here right now (not sales)? A rising rental-DOM trend means longer vacancies and softer asking-rent achievability than the comps imply.
- What's the recent tenant-quality profile in this submarket — average credit score on applications, eviction rate, late-payment / NSF rate, and stable-employment percentage? A property-management company in the area should have these aggregated.
- How much new for-sale + rental construction is in the pipeline within 1–3 miles? Heavy new supply typically softens prices + rents 12–24 months out; constrained supply supports both.
Investment metrics
- 1% rule
- 0.84% ✗
- Cap rate
- 5.99%
- Cash-on-cash
- -1.10%
- DSCR
- 0.95
- GRM
- 10.0
CMA / ARV
No comps found within radius.
Projected returns pro-forma
-3.0% appreciation · 1.01% rent growth · sell at horizon
- IRR
- -20.3%
- Equity multiple
- 0.30×
- Total profit
- $-30,558
- Equity at exit
- $23,409
- IRR
- -18.5%
- Equity multiple
- 0.09×
- Total profit
- $-39,996
- Equity at exit
- $13,574
Cash invested: $43,960 (down + closing). Projections, not guarantees.
Landlord ↔ Tenant lean methodology
- Overall (STATE)
- 87 Strongly Landlord-Friendly
- State Florida
- 87 Strongly Landlord-Friendly · R+3
- County
- — inherits STATE
- City
- — inherits STATE
ZIP-level market 32117
- Home prices YoY
- -8.2%
- Rents YoY
- 1.0%
- Active inventory
- 332
- Price-to-rent
- 10.0×
Monthly cashflow live
- Estimated rent
- $1,312 high interval (Pro) →
- Mortgage (P&I)
- −$823
- Tax from tax record
- −$188 /mo · $2,251/yr
- Insurance
- −$65
- HOA
- −$0
- Vacancy / Maint / Mgmt
- −$275
- Net cashflow
- $-40
Break-even live
UW: 25.0% down · 7.5% · 30yr · 1.5% tax · 5.0% vac · 8.0% maint · 8.0% mgmt
Financing live
Cash to close
- Down payment
- $39,250
- Closing costs
- $4,710
- Reserves months
- —
- Total cash needed
- —
Loan-product check · same deal, 3 products live
Conventional
25% down · 7.5% · 30yr
- Down + closing
- —
- Monthly P&I
- —
- Monthly cashflow
- —
- DSCR
- —
- Eligible?
- —
Personal DTI + credit; lowest rate.
DSCR
20% down · 8.5% · 30yr
- Down + closing
- —
- Monthly P&I
- —
- Monthly cashflow
- —
- DSCR
- —
- Eligible?
- —
No personal income docs; deal must DSCR.
Hard money
10% down · 12.0% · 12mo
- Down + closing
- —
- Monthly P&I
- —
- Monthly cashflow
- —
- DSCR
- —
- Eligible?
- —
Short-term bridge; refi at stabilization.
Rent comps 33 comps
| Address | Beds | Baths | Sqft | Rent | $/sqft | DOM | Units | Dist |
|---|---|---|---|---|---|---|---|---|
| 946 15th St Daytona Beach, FL | 2.0 | 2.0 | 1010 | $1,500 | $1.49 | 23d | 1 | 0.45mi |
| 1540 Espanola Ave Unit 9 Daytona Beach, FL | 1.0 | 1.0 | 600 | $900 | $1.50 | 23d | 1 | 0.46mi |
| 1563 Hancock Ln Daytona Beach, FL | 2.0 | 2.0 | 912 | $1,475 | $1.62 | 11d | 1 | 0.51mi |
| 900 LPGA Blvd Daytona Beach, FL | 1.0–2.0 | 1.0–2.0 | 885 | $899 | $1.02 | 14d | 14 | 0.59mi |
| 1355 Hiawatha Ave Daytona Beach, FL | 2.0 | 1.0 | 780 | $1,675 | $2.15 | 14d | 1 | 0.62mi |
| 1559 Hammock Dr Unit B Holly Hill, FL | 2.0 | 1.5 | 1100 | $1,375 | $1.25 | 14d | 1 | 0.72mi |
| 1521 Moravia Ave Daytona Beach, FL | 2.0 | 2.0 | 700 | $2,000 | $2.86 | 19d | 1 | 0.75mi |
| 840 Center Ave Apt 75 Holly Hill, FL | 2.0 | 1.0 | 900 | $1,250 | $1.39 | 23d | 1 | 0.89mi |
| 851 State Ave Daytona Beach, FL | 2.0 | 1.0 | 682 | $1,495 | $2.19 | 23d | 1 | 0.94mi |
| 660 8th St Daytona Beach, FL | 2.0 | 1.0 | 900 | $1,375 | $1.53 | 23d | 1 | 0.94mi |
| 1707 Evergreen St Ormond Beach, FL | 2.0 | 1.0 | 868 | $1,750 | $2.02 | 23d | 1 | 0.95mi |
| 820 State Ave Unit 2 Daytona Beach, FL | 2.0 | 1.0 | 690 | $1,250 | $1.81 | 23d | 1 | 1.00mi |
| 820 State Ave Apt 1 Daytona Beach, FL | 2.0 | 2.0 | 841 | $1,470 | $1.75 | 23d | 1 | 1.00mi |
| 820 State Ave Unit 3 Daytona Beach, FL | 2.0 | 1.0 | 841 | $1,370 | $1.63 | 23d | 1 | 1.00mi |
| 921 Daytona Ave Unit A Daytona Beach, FL | 2.0 | 1.0 | 1100 | $1,775 | $1.61 | 23d | 1 | 1.00mi |
| 2711 N Halifax Ave Daytona Beach, FL | 1.0–2.0 | 1.0 | 785 | $1,400 | $1.78 | 23d | 2 | 1.39mi |
| 2711 N Halifax Ave Daytona Beach, FL | 1.0–2.0 | 1.0 | 785 | $1,295 | $1.65 | 14d | 3 | 1.39mi |
| 100 Windflower LN Daytona Beach, FL | 1.0–3.0 | 1.0–2.0 | 1021 | $1,511 | $1.48 | 11d | 63 | 1.42mi |
| 101 Claysburg LN Holly Hill, FL | 1.0–3.0 | 1.0–2.0 | 1163 | $1,843 | $1.58 | 14d | 25 | 1.42mi |
| 3009 N Halifax Ave #1 Daytona Beach, FL | 2.0 | 1.5 | 816 | $1,650 | $2.02 | 23d | 1 | 1.43mi |
| 3009 N Halifax Ave #2 Daytona Beach, FL | 1.0 | 1.0 | 612 | $1,250 | $2.04 | 23d | 1 | 1.43mi |
| 1290 9th St #106 Daytona Beach, FL | 1.0 | 1.0 | 608 | $1,195 | $1.97 | 14d | 1 | 1.44mi |
| 1290 9th St Daytona Beach, FL | 1.0 | 1.0 | 608 | $1,060 | $1.74 | 23d | 3 | 1.44mi |
| 1229 Kennedy Rd Daytona Beach, FL | 2.0 | 1.0 | 800 | $950 | $1.19 | 14d | 1 | 1.44mi |
| 1229 Kennedy Rd #43 Daytona Beach, FL | 1.0 | 1.0 | 625 | $900 | $1.44 | 23d | 1 | 1.44mi |
| 1225 Kennedy Rd Daytona Beach, FL | 2.0 | 1.0 | 800 | $825 | $1.03 | 11d | 1 | 1.47mi |
| 1221 Kennedy Rd Unit 48 Daytona Beach, FL | 1.0 | 1.0 | 800 | $775 | $0.97 | 14d | 1 | 1.48mi |
| 1221 Kennedy Rd Unit 43 Daytona Beach, FL | 1.0 | 1.0 | 625 | $775 | $1.24 | 11d | 1 | 1.48mi |
| 100 Navigator DR Daytona Beach, FL | 1.0–3.0 | 1.0–2.0 | 1029 | $1,108 | $1.08 | 11d | 25 | 1.49mi |
| 1216 Kennedy Rd Unit 4 Daytona Beach, FL | 2.0 | 1.0 | 900 | $975 | $1.08 | 14d | 1 | 1.49mi |
| 1216 Kennedy Rd Unit 10 Daytona Beach, FL | 2.0 | 1.0 | 900 | $975 | $1.08 | 23d | 1 | 1.49mi |
| 1217 Kennedy Rd Unit 56 Daytona Beach, FL | 2.0 | 1.0 | 800 | $1,000 | $1.25 | 23d | 1 | 1.50mi |
| 1217 Kennedy Rd Unit 44 Daytona Beach, FL | 1.0 | 1.0 | 800 | $775 | $0.97 | 11d | 1 | 1.50mi |
Listing history 20 events
-
2026-06-18days on market $157,000 Active 52 DOM
-
2026-06-17days on market $157,000 Active 51 DOM
-
2026-06-16days on market $157,000 Active 50 DOM
-
2026-06-15days on market $157,000 Active 49 DOM
-
2026-06-14days on market $157,000 Active 47 DOM
-
2026-06-10days on market $157,000 Active 44 DOM
-
2026-06-09days on market $157,000 Active 43 DOM
-
2026-06-08days on market $157,000 Active 42 DOM
-
2026-06-07days on market $157,000 Active 41 DOM
-
2026-06-05pricedays on market $157,000 Active 38 DOM
-
2026-06-03days on market $160,000 Active 37 DOM
-
2026-06-03days on market $160,000 Active 36 DOM
-
2026-06-01days on market $160,000 Active 35 DOM
-
2026-05-31days on market $160,000 Active 34 DOM
-
2026-05-31days on market $160,000 Active 33 DOM
-
2026-05-14price $160,000 409-char remark
-
2026-04-27$165,000 Active 409-char remark
-
2026-04-07soldstatus $118,900
-
1978-12-01soldstatus $19,400
-
1974-04-01soldstatus $13,400
ⓘ Source: listings_history table (triggers on properties + properties_extension) + one-shot
backfill from property_details.listing_events for pre-trigger history.
Tax reassessment forecast FL · Resets to sale price
- Current annual tax
- $2,251 · $188/mo
- Projected year-2 tax
- $2,251 · $188/mo
- Expected delta
- $0/yr ($0/mo · 0.0%)
ⓘ Screening estimate from a state-policy table — verify with the county assessor before closing.
Climate risk First Street
- Flood 6/10 Major FEMA zone X (shaded) · 68% chance over 30 yrs
- Wildfire 1/10 Low
- Heat 10/10 Extreme 7 d/yr ≥104°F today · 20 d/yr by 30 yrs out
- Wind 10/10 Extreme 99% chance of damaging wind over 30 yrs
- Air quality 2/10 Low 1 unhealthy d/yr today · 1 by 30 yrs out
Nearby sold comps map
Loading sold comps map…
Walkable amenities ~0.75 mi
Loading nearby amenities…
Taxation est. · year 1
- Rental income
- $15,740
- − Mortgage interest
- −$8,794
- − Property taxes
- −$2,251
- − Insurance
- −$785
- − Repairs & maintenance
- −$1,259
- − Management
- −$1,259
- − Depreciation
- −$4,567
- Taxable loss
- −$3,176
- Est. tax savings @ 24.0%
- +$762
- After-tax cash flow
- $281/yr
For passive investors: Depreciation is non-cash, so a rental often shows a tax loss while cash-flowing — sheltering income. Rental losses are passive: they offset passive income freely, and up to $25,000/yr can offset ordinary (W-2) income if you actively participate and your MAGI is under $100k (phasing out to $0 by $150k); unused losses carry forward. On sale, claimed depreciation is recaptured at up to 25%, and gains may owe capital-gains tax (a 1031 exchange can defer both). Figures are a year-1 estimate at your 24.0% rate — not tax advice; consult a CPA.
Schools (NCES district)
- District
- Volusia
- NCES district ID
- 1201920
- Math proficiency
- 44% ▼ -9.00%
- Reading proficiency
- 49% ▼ -3.00%
- Median HH income
- $42,946
- Composite
- 39.2/100
- National rank
- #4019
- State rank
- #47 of 73 in FL
Livability — Holly Hill
- Score
- 72/100
- State rank
- #325
- US rank
- #5737
Category grades
Schools grade is shown separately in the Schools card above.
Census & demographics
- Census place
- Holly Hill, FL
- County
- Volusia County · 556,871 people
- Metro
- Deltona-Daytona Beach-Ormond Beach, FL
- Population (ZIP)
- 30,955
- Household income
- $56,419
- Rent vs Own
- Severe rent burden
- 1781.0
Population outlook (Volusia County) Hauer SSP2
- Today (2025)
- 572,749 people
- By 2030
- 598,695 · +4.5%
- By 2040
- 644,880 · +12.6%
- By 2050
- 681,451 · +19.0%
- By 2075
- 759,957 · +32.7%
- By 2100
- 778,902 · +36.0%
Race, ethnicity, and origin ACS 2023
- Neighborhood character
- Diverse neighborhood (Simpson 0.63)
- Race & ethnicity
- White 53% Black 27% Hispanic / Latino 10% Two or more races 9% Asian 3%
- Hispanic origin (detail)
- Mexican 2% Puerto Rican 3%
- Common ancestry
- Romanian 2% Lithuanian 2% Slovak 1%
- Foreign-born
- 8% · Canada, Vietnam, Jamaica
- Languages at home
- 86% English-only · Spanish 8% Vietnamese 1% Other Indo-European 1%
Political lean MEDSL · Volusia
- 2024 margin
- Strong R (+21.8) · D 38.7% · R 60.5%
- 2008→2024 swing
- -27.4pp toward R · 2008: 5.7pp · 2024: -21.8pp
- All cycles
- 2024: R+21.8 2020: R+14.1 2016: R+13.1 2012: R+1.2 2008: D+5.7
Not yet ingested
- Civics
- —
Market trends
- HPI YoY
- ▼ -96.62%
- Current HPI
- 1084.54
- Rent YoY
- ▲ 1.01%
- Metro
- Deltona-Daytona Beach-Ormond Beach, FL
- State GDP YoY
- ▲ 3.28%
- F500 in state
- 36
Industry mix (Fortune 500 HQ in FL)
| Industry | F500 HQs | Revenue |
|---|---|---|
| Industrial Technology | 2 | $29B |
|
||
| Insurance | 2 | $17B |
|
||
| Retail | 1 | $60B |
|
||
| Technology Distribution | 1 | $58B |
|
||
| Homebuilding | 1 | $35B |
|
||
| Technology Manufacturing | 1 | $35B |
|
||
Price history
+1071.6% since first listed6 events — show timeline
- 2026-06-04 Price Changed $157,000 Stellar MLS as Distributed by MLS Grid
- 2026-05-14 Price Changed $160,000 Stellar MLS as Distributed by MLS Grid
- 2026-04-27 Listed $165,000 Stellar MLS as Distributed by MLS Grid
- 2026-04-07 Sold (Public Records) $118,900 Public Records
- 1978-12-01 Sold (Public Records) $19,400 Public Records
- 1974-04-01 Sold (Public Records) $13,400 Public Records
Property tax history
+36.7%/yrLatest (2025): $2,251 · +2.2% YoY. Source: county tax records.
Cash-flow waterfall
monthlySold comps — $/sqft
last 12 mo · ≤1 miLoading sold comps…