 Fourplex
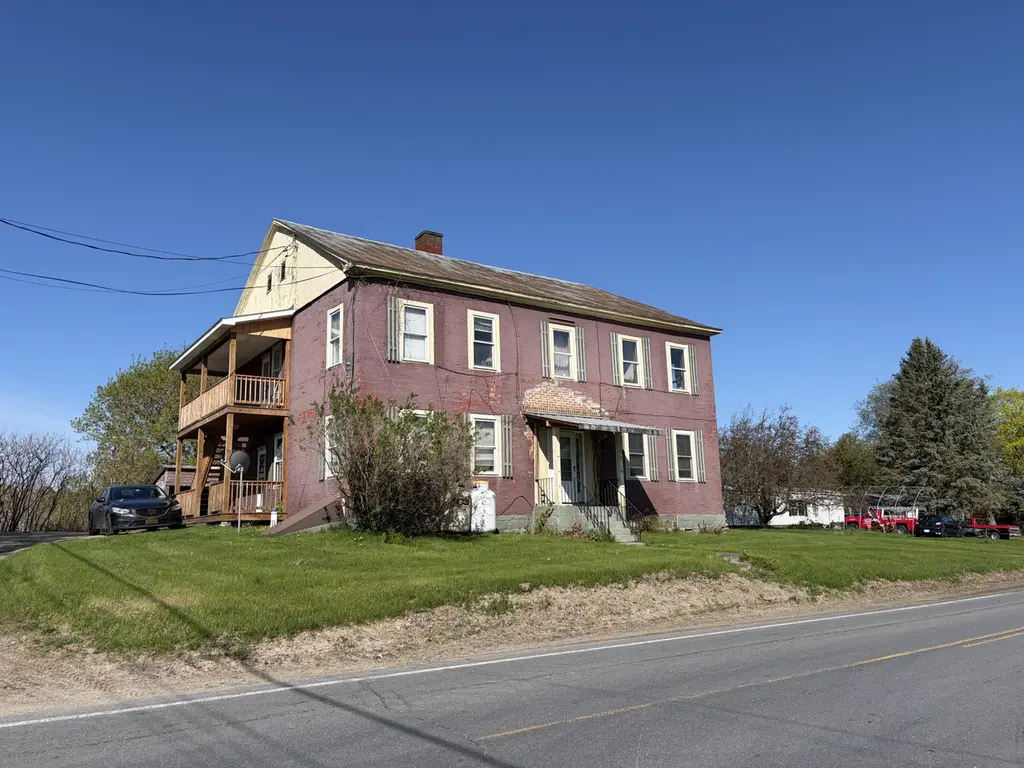
53 Stratton Hill Rd · West Chazy, NY
Flood risk 1/10 · Minimal
- FEMA flood zone
- X (unshaded)
- Chance of flooding over 30 yrs
- 0.0%
- Est. flood insurance / yr
- $473 – $860
Fire risk 1/10 · Minimal
- Est. fire insurance / yr
- $691 – $1,283
Heat risk 3/10 · Minor
- Hot days now (above 93°F)
- 7 days/yr
- Hot days in 30 yrs
- 15 days/yr
Wind risk 2/10 · Minimal
- Chance of severe wind over 30 yrs
- 2.0%
Air-quality risk 2/10 · Minimal
- Unhealthy air days now
- 1 days/yr
- Unhealthy air days in 30 yrs
- 1 days/yr
Risk factors via First Street. Map © Google.
Why this score? — see what drove the B+ grade
The composite is a weighted blend of 9 inputs, each scored 0–100. Each bar is that input's sub-score; the figure is the points it added to the 100-point composite (weight × sub-score).
- Cash flow +30.0/30.0
- 1% rule +10.0/10.0
- DSCR +10.0/10.0
- Appreciation +7.6/10.0
- ARV discount +7.5/15.0
- Schools +6.0/10.0
- Livability +3.0/5.0
- Rent growth +2.5/5.0
- Condition / age +2.5/5.0
$259,000
🖨 Deal sheet 📄 Offer letter ✓ Due diligence
Multi-family units
County records classify this as Multi-Family (5+ Unit). Listing-text estimate: 4 units. estimate disagrees with records
5+ unit building — per-unit beds/baths from public records are typically unavailable; the breakdown below (if shown) is an estimate from the listing text.
Listing remarks
Fully rented 4-plex makes a positive income with potential for much more. 3 apartments have individual oil furnaces, one has propane monitor and electric heat. Tenants pay heat and electricity and hot water. New exterior porches and staircases. 4 new hot water tanks. One new furnace, 2 others are 2019. Owner has never raised rents on existing tenants. One owner past 20 years. 4 garage stalls. Each apartment has exterior and interior individual entrances. Common area with coin-op laundry. Seller is NY State licensed Realtor and listing agent.
Key facts
- New hot water tanks
- Propane monitor
- New exterior porches
Tags
Property features AI
Exterior
- Parking: Has a garage with 4 garage spaces; Off-street parking and parking lot available; Has open parking
- Utilities: Private well water; Septic tank sewer; Electricity connected (circuit breakers and fuses); Cable available and connected
- Home design: Residential income property (quadruplex); Two levels
- Construction: Brick construction; Stone foundation; Built as a quadruplex
- Exterior features: Metal roof; Paved road access; Garage(s) on property; Lot dimensions approximately 154 x 208
Interior
- Flooring: Carpet; Vinyl
- Heating & cooling: Electric heating; Forced air; Oil heating
- Interior features: High-speed internet available; Aluminum and wood window frames
- Laundry & utility: Common area laundry
Neighborhood map
What this means for you Summary
Snapshot
- This is a 4 × 2-bed/1-bath units multifamily listed at $259k.
Deal economics
- At list price, monthly cash flow is $2k ($24k/yr) — positive. Per door: $506/mo.
- The deal already cash-flows at list — no discount required.
- Meets the 1% rule at list price ($5k rent vs $259k).
- Recommended offer: $251k (3.0% below list) — sets the bar for market timing.
Location & tenants
- Location reads 59/100 on livability (#1,017 in NY) — a working-class tenant base; expect higher turnover. Strengths: housing A+, cost of living A-; Watch: employment D+, schools D, crime F.
- Chazy Union Free School District (rural): math 72% / reading 65% proficiency, ranked #175 of 755 in NY (top 23%) — acceptable for families but not a draw, mixed tenant base, ~2y average lease.
- Market conditions: 23 active listings in the ZIP; 192 units permitted in Clinton County in 2024 (64 in 5+ unit buildings).
Forward outlook
- In year one you build about $15k of equity ($2k loan paydown + $13k appreciation (5.1% local appreciation)).
- Clinton County population projected at -16% by 2050 — secular population decline; favor cash flow + early exit over multi-decade hold.
- At projected returns (5.1% appreciation + 3.0% rent growth), your $73k cash investment doubles in ~2 years — after that, you're playing with house money.
- By year 3, paydown + projected appreciation supports a ~$37k cash-out refi (75% LTV) — recoverable capital for the next deal without selling this one.
Negotiation context
- It's been on market 37 days — a 3% lower offer ($251k) is reasonable based on typical stale-listing flexibility.
- Current owner paid $136k; list at $259k implies a 90% gain — meaningful room to come down on a strong offer.
Risks & watch-outs
- Watch-outs: built in 1801 — expect roof / HVAC / electrical / plumbing capex.
Questions for the listing agent
- It's been on market 37 days. Have you received any prior offers? Is the seller open to a 3% concession, seller financing, or rate buy-down credit?
- Can we see the unit-by-unit rent roll, current vacancy, and any below-market leases? What's the average tenancy length?
- What capital expenditures (roof, boiler, parking lot, exteriors) have been made in the last 5 years, and what's planned in the next 2?
- Built in 1801 — when were the roof, HVAC, electrical panel, plumbing, and water heater last replaced?
- Is there a deadline driving the sale (1031 exchange, divorce, estate, relocation)? That informs how much negotiation room exists.
- Schools are D-rated, which usually means shorter tenancies and higher turnover. Who's the typical renter profile here, and what's been the actual vacancy rate?
- Crime grade is F in this area — have there been break-ins, vandalism, or insurance claims at this property in the last 3 years? What carrier currently insures it and at what premium?
- What's the average days-on-market for RENTAL listings here right now (not sales)? A rising rental-DOM trend means longer vacancies and softer asking-rent achievability than the comps imply.
- What's the recent tenant-quality profile in this submarket — average credit score on applications, eviction rate, late-payment / NSF rate, and stable-employment percentage? A property-management company in the area should have these aggregated.
- How much new apartment / multifamily construction is in the pipeline within 1–3 miles? Heavy new supply (>2% of stock underway) typically softens rents 12–24 months out; light construction supports rent growth.
Investment metrics
- 1% rule
- 1.85% ✓
- Cap rate
- 15.68%
- Cash-on-cash
- 33.52%
- DSCR
- 2.49
- GRM
- 4.5
CMA / ARV
No comps found within radius.
Projected returns pro-forma
5.12% appreciation · 3.0% rent growth · sell at horizon
- IRR
- 42.6%
- Equity multiple
- 3.63×
- Total profit
- $190,545
- Equity at exit
- $148,646
- IRR
- 40.5%
- Equity multiple
- 7.40×
- Total profit
- $463,805
- Equity at exit
- $258,106
Cash invested: $72,520 (down + closing). Projections, not guarantees.
Landlord ↔ Tenant lean methodology
- Overall (STATE)
- 15 Strongly Tenant-Friendly
- State New York
- 15 Strongly Tenant-Friendly · D+10
- County
- — inherits STATE
- City
- — inherits STATE
ZIP-level market 12992
- Home prices YoY
- 1.9%
- Active inventory
- 23
- Price-to-rent
- 18.0×
Monthly cashflow live
- Estimated rent
- $4,795 medium interval (Pro) →
- Mortgage (P&I)
- −$1,358
- Tax from tax record
- −$296 /mo · $3,552/yr
- Insurance
- −$108
- HOA
- −$0
- Vacancy / Maint / Mgmt
- −$1,007
- Net cashflow
- $2,026
Break-even live
4-unit breakdown (identical units grouped — click to expand)
| Units | Beds | Baths | Est. rent |
|---|---|---|---|
| 4× units | 2 | 1 | $4,796 |
| #1 | 2 | 1 | $1,199 |
| #2 | 2 | 1 | $1,199 |
| #3 | 2 | 1 | $1,199 |
| #4 | 2 | 1 | $1,199 |
| Total (4 units) | $4,795 | ||
UW: 25.0% down · 7.5% · 30yr · 1.5% tax · 5.0% vac · 8.0% maint · 8.0% mgmt
Financing live
Cash to close
- Down payment
- $64,750
- Closing costs
- $7,770
- Reserves months
- —
- Total cash needed
- —
Loan-product check · same deal, 3 products live
Conventional
25% down · 7.5% · 30yr
- Down + closing
- —
- Monthly P&I
- —
- Monthly cashflow
- —
- DSCR
- —
- Eligible?
- —
Personal DTI + credit; lowest rate.
DSCR
20% down · 8.5% · 30yr
- Down + closing
- —
- Monthly P&I
- —
- Monthly cashflow
- —
- DSCR
- —
- Eligible?
- —
No personal income docs; deal must DSCR.
Hard money
10% down · 12.0% · 12mo
- Down + closing
- —
- Monthly P&I
- —
- Monthly cashflow
- —
- DSCR
- —
- Eligible?
- —
Short-term bridge; refi at stabilization.
Listing history 16 events
-
2026-06-18days on market $259,000 Active 37 DOM
-
2026-06-17days on market $259,000 Active 36 DOM
-
2026-06-16days on market $259,000 Active 35 DOM
-
2026-06-15days on market $259,000 Active 34 DOM
-
2026-06-13days on market $259,000 Active 32 DOM
-
2026-06-12days on market $259,000 Active 31 DOM
-
2026-06-09days on market $259,000 Active 28 DOM
-
2026-06-08days on market $259,000 Active 27 DOM
-
2026-06-07days on market $259,000 Active 26 DOM
-
2026-06-05days on market $259,000 Active 24 DOM
-
2026-06-04days on market $259,000 Active 22 DOM
-
2026-06-02days on market $259,000 Active 21 DOM
-
2026-06-01days on market $259,000 Active 20 DOM
-
2026-05-31days on market $259,000 Active 19 DOM
-
2026-05-12$259,000 Active 548-char remark
-
2005-10-07soldstatus $136,000
ⓘ Source: listings_history table (triggers on properties + properties_extension) + one-shot
backfill from property_details.listing_events for pre-trigger history.
Tax reassessment forecast NY · Partial reset (capped growth)
- Current annual tax
- $3,552 · $296/mo
- Projected year-2 tax
- $3,964 · $330/mo
- Expected delta
- +$413/yr (+$34/mo · 11.6%)
ⓘ Screening estimate from a state-policy table — verify with the county assessor before closing.
Climate risk First Street
- Flood 1/10 Low FEMA zone X (unshaded) · 0% chance over 30 yrs
- Wildfire 1/10 Low
- Heat 3/10 Moderate 7 d/yr ≥93°F today · 15 d/yr by 30 yrs out
- Wind 2/10 Low 2% chance of damaging wind over 30 yrs
- Air quality 2/10 Low 1 unhealthy d/yr today · 1 by 30 yrs out
Nearby sold comps map
Loading sold comps map…
Walkable amenities ~0.75 mi
Loading nearby amenities…
Taxation est. · year 1
- Rental income
- $57,540
- − Mortgage interest
- −$14,508
- − Property taxes
- −$3,552
- − Insurance
- −$1,295
- − Repairs & maintenance
- −$4,603
- − Management
- −$4,603
- − Depreciation
- −$7,535
- Taxable income
- $21,444
- Est. tax owed @ 24.0%
- −$5,147
- After-tax cash flow
- $19,164/yr
For passive investors: Depreciation is non-cash, so a rental often shows a tax loss while cash-flowing — sheltering income. Rental losses are passive: they offset passive income freely, and up to $25,000/yr can offset ordinary (W-2) income if you actively participate and your MAGI is under $100k (phasing out to $0 by $150k); unused losses carry forward. On sale, claimed depreciation is recaptured at up to 25%, and gains may owe capital-gains tax (a 1031 exchange can defer both). Figures are a year-1 estimate at your 24.0% rate — not tax advice; consult a CPA.
Schools (NCES district)
- District
- Chazy Union Free School District
- NCES district ID
- 3607170
- Math proficiency
- 72% ▲ 2.00%
- Reading proficiency
- 65% ▬ 0.00%
- Median HH income
- $59,672
- Composite
- 60.32/100
- National rank
- #1727
- State rank
- #175 of 755 in NY
Livability — West Chazy
- Score
- 59/100
- State rank
- #1017
- US rank
- #19865
Category grades
Schools grade is shown separately in the Schools card above.
Census & demographics
- City population
- 4,129
- Population (ZIP)
- 4,129
Population outlook (Clinton County) Hauer SSP2
- Today (2025)
- 78,791 people
- By 2030
- 76,848 · -2.5%
- By 2040
- 71,579 · -9.2%
- By 2050
- 66,471 · -15.6%
- By 2075
- 57,361 · -27.2%
- By 2100
- 47,232 · -40.1%
Race, ethnicity, and origin ACS 2023
- Neighborhood character
- Predominantly White (94%)
- Race & ethnicity
- White 94% Hispanic / Latino 4% Two or more races 1%
- Common ancestry
- Lithuanian 12% Iranian 2% Slovak 2%
- Foreign-born
- 3% · Canada, South Korea
- Languages at home
- 97% English-only · French/Haitian/Cajun 1% Spanish 1% German/W. Germanic 1%
Political lean MEDSL · Clinton
- 2024 margin
- Toss-up / Even · D 48.9% · R 51.1%
- 2008→2024 swing
- -25.1pp toward R · 2008: 22.9pp · 2024: -2.2pp
- All cycles
- 2024: R+2.2 2020: D+5.2 2016: D+0.9 2012: D+25.6 2008: D+22.9
Not yet ingested
- Civics
- —
Market trends
- HPI YoY
- ▲ 5.12%
- Current HPI
- 271.1612
- Rent YoY
- —
- Metro
- —
- State GDP YoY
- ▲ 2.60%
- F500 in state
- 92
Industry mix (Fortune 500 HQ in NY)
| Industry | F500 HQs | Revenue |
|---|---|---|
| Financial Services | 10 | $950B |
|
||
| Consumer Goods | 9 | $162B |
|
||
| Insurance | 4 | $225B |
|
||
| Telecommunications | 2 | $144B |
|
||
| Pharmaceuticals | 2 | $112B |
|
||
| Media / Entertainment | 2 | $69B |
|
||
Price history
+90.4% since first listed2 events — show timeline
- 2026-05-12 Listed $259,000 ACVMLS
- 2005-10-07 Sold (Public Records) $136,000 Public Records
Property tax history
+0.4%/yrLatest (2025): $3,552 · -2.3% YoY. Source: county tax records.
Cash-flow waterfall
monthlySold comps — $/sqft
last 12 mo · ≤1 miLoading sold comps…