161 S Myrtle St · Fellsmere, FL
Flood risk 1/10 · Minimal
- FEMA flood zone
- A
- Chance of flooding over 30 yrs
- 0.0%
- Est. flood insurance / yr
- $1,009 – $1,996
Fire risk 4/10 · Minor
- Est. fire insurance / yr
- $947 – $1,759
Heat risk 9/10 · Severe
- Hot days now (above 108°F)
- 7 days/yr
- Hot days in 30 yrs
- 23 days/yr
Wind risk 10/10 · Severe
- Chance of severe wind over 30 yrs
- 99.0%
Air-quality risk 1/10 · Minimal
- Unhealthy air days now
- 0 days/yr
- Unhealthy air days in 30 yrs
- 0 days/yr
Risk factors via First Street. Map © Google.
Why this score? — see what drove the B- grade
The composite is a weighted blend of 9 inputs, each scored 0–100. Each bar is that input's sub-score; the figure is the points it added to the 100-point composite (weight × sub-score).
- Cash flow +24.9/30.0
- DSCR +8.1/10.0
- Appreciation +7.6/10.0
- ARV discount +7.5/15.0
- 1% rule +5.2/10.0
- Schools +4.2/10.0
- Livability +4.0/5.0
- Rent growth +2.5/5.0
- Condition / age +2.5/5.0
$200,000
🖨 Deal sheet (PDF) 📄 Offer letter ✓ Due diligence
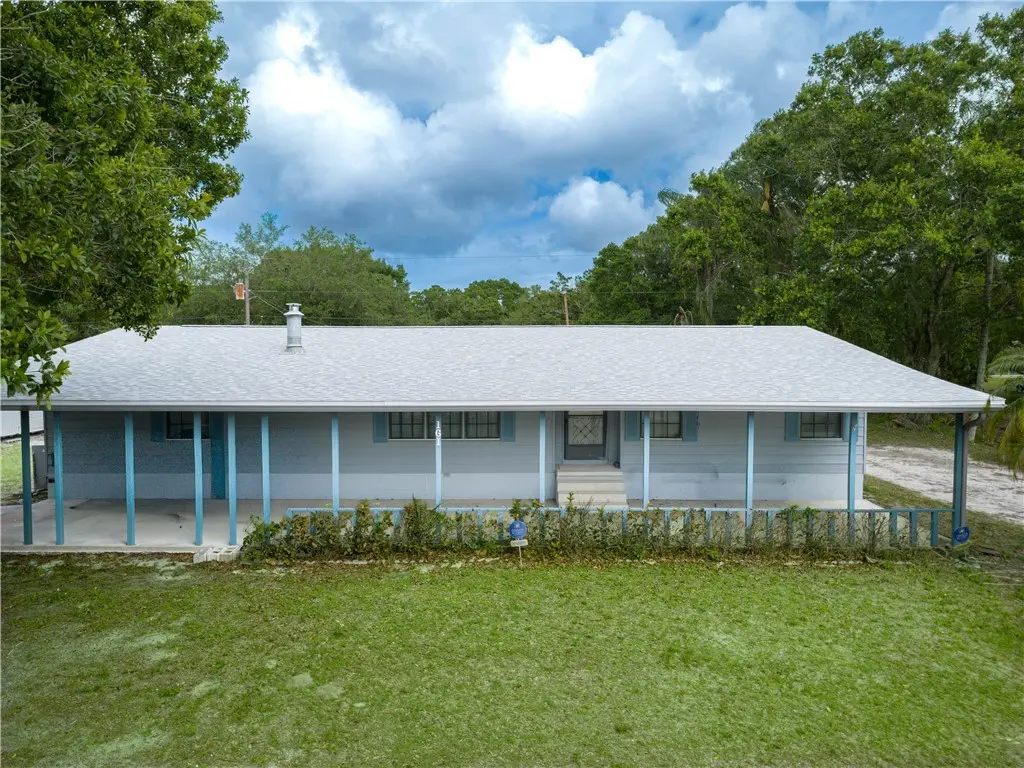
Listing remarks
Welcome to your slice of peaceful Florida living in Fellsmere. Situated on nearly half an acre, this charming 3-bedroom, 2-bath offers over 1,600 sqft of comfort and possibility. Enjoy a 2023 roof, S/S kitchen appliances, an extra refrigerator and a spacious Florida room perfect for relaxing or entertaining. With front and back porches, a storage shed, and fully furnished, it’s move-in ready. The expansive lot invites you to dream bigger garden, expand, or simply enjoy the open space.
Key facts
- Expansive lot
- Extra refrigerator
- Storage shed
Tags
Neighborhood map
What this means for you Summary
Snapshot
- This is a 2-bed/2.0-bath manufactured listed at $200k.
Deal economics
- At list price, monthly cash flow is $306 ($4k/yr) — positive.
- The deal already cash-flows at list — no discount required.
- Meets the 1% rule at list price ($2k rent vs $200k).
- Cap rate 8.9% vs local median 3.3% in Fellsmere — top-decile yield for the area; either an underpriced asset or a hidden risk that comps aren't pricing in. Stress-test before assuming the spread holds.
Location & tenants
- Location reads 79/100 on livability (#136 in FL, #2,043 nationally) — a middle-class / working-renter tenant base. Strengths: crime A+, commute A+, cost of living A+; Watch: amenities F, employment F.
- Indian River (other): math 48% / reading 52% proficiency, ranked #35 of 73 in FL (top 48%) — acceptable for families but not a draw, mixed tenant base, ~2y average lease.
- Zoned schools: Fellsmere Elementary School (math 44% / reading 42%, grade F, #1,366 of 2,144 statewide, top 64%, 594 students, 100% FRL); Sebastian River Middle School (math 46% / reading 44%, grade D, #310 of 571 statewide, top 56%, 862 students, 65% FRL); Sebastian River High School (math 29% / reading 45%, grade F, #340 of 667 statewide, top 52%, 1,843 students, 52% FRL) — zoned schools average 72% FRL vs 53% district-wide (19 pts higher); higher-poverty schools than district average — tighter screening recommended.
- Market conditions: 58 active listings in the ZIP; 564 units permitted in Indian River County in 2024 (281 in 5+ unit buildings).
Forward outlook
- In year one you build about $12k of equity ($1k loan paydown + $10k appreciation (5.2% local appreciation)).
- Indian River County population projected at +18% by 2050 — long-run rental-demand tailwind backs the buy-and-hold thesis.
- At projected returns (5.2% appreciation + 3.0% rent growth), your $56k cash investment doubles in ~4 years — after that, you're playing with house money.
- By year 4, paydown + projected appreciation supports a ~$40k cash-out refi (75% LTV) — recoverable capital for the next deal without selling this one.
Negotiation context
- Only 4 days on market — expect competitive offers; lowballing is unlikely to land.
Risks & watch-outs
- Watch-outs: flood insurance adds $125/mo.
- Climate carrying-cost: in FEMA flood zone A (mandatory federal flood insurance); severe wind risk, 99% chance of damaging wind over 30y; extreme-heat days projected 7→23/yr by 2055 (HVAC capex compounding) — expect insurance premiums to compound above CPI over the hold.
Questions for the listing agent
- What's the actual annual flood-insurance premium (NFIP or private), and is the property in a SFHA with mandatory coverage?
- Is there a deadline driving the sale (1031 exchange, divorce, estate, relocation)? That informs how much negotiation room exists.
- Schools are F-rated, which usually means shorter tenancies and higher turnover. Who's the typical renter profile here, and what's been the actual vacancy rate?
- What's the average days-on-market for RENTAL listings here right now (not sales)? A rising rental-DOM trend means longer vacancies and softer asking-rent achievability than the comps imply.
- What's the recent tenant-quality profile in this submarket — average credit score on applications, eviction rate, late-payment / NSF rate, and stable-employment percentage? A property-management company in the area should have these aggregated.
- How much new for-sale + rental construction is in the pipeline within 1–3 miles? Heavy new supply typically softens prices + rents 12–24 months out; constrained supply supports both.
Investment metrics
- 1% rule
- 1.02% ✓
- Cap rate
- 8.88%
- Cash-on-cash
- 9.24%
- DSCR
- 1.41
- GRM
- 8.2
CMA / ARV
No comps found within radius.
Projected returns pro-forma
5.19% appreciation · 3.0% rent growth · sell at horizon
- IRR
- 18.9%
- Equity multiple
- 2.21×
- Total profit
- $67,710
- Equity at exit
- $115,601
- IRR
- 18.8%
- Equity multiple
- 4.34×
- Total profit
- $186,863
- Equity at exit
- $201,410
Cash invested: $56,000 (down + closing). Projections, not guarantees.
Landlord ↔ Tenant lean methodology
- Overall (STATE)
- 87 Strongly Landlord-Friendly
- State Florida
- 87 Strongly Landlord-Friendly · R+3
- County
- — inherits STATE
- City
- — inherits STATE
ZIP-level market 32948
- Home prices YoY
- 1.6%
- Active inventory
- 58
- Price-to-rent
- 8.2×
Monthly cashflow live
- Estimated rent
- $2,042 medium interval (Pro) →
- Mortgage (P&I)
- −$1,049
- Tax from tax record
- −$50 /mo · $598/yr
- Insurance
- −$83
- Flood insurance flood zone
- −$125 /mo · $1,502/yr
- HOA
- −$0
- Vacancy / Maint / Mgmt
- −$429
- Net cashflow
- $306
Break-even live
Sensitivity live
| Price | -10% $419 | -5% $363 | +0% $306 | +5% $250 | +10% $193 |
|---|---|---|---|---|---|
| Rent | -10% $145 | -5% $225 | +0% $306 | +5% $387 | +10% $467 |
| Rate | -1.0pp $407 | -0.5pp $357 | base $306 | +0.5pp $254 | +1.0pp $202 |
UW: 25.0% down · 7.5% · 30yr · 1.5% tax · 5.0% vac · 8.0% maint · 8.0% mgmt
Financing live
Cash to close
- Down payment
- $50,000
- Closing costs
- $6,000
- Reserves months
- —
- Total cash needed
- —
Loan-product check · same deal, 3 products live
Conventional
25% down · 7.5% · 30yr
- Down + closing
- —
- Monthly P&I
- —
- Monthly cashflow
- —
- DSCR
- —
- Eligible?
- —
Personal DTI + credit; lowest rate.
DSCR
20% down · 8.5% · 30yr
- Down + closing
- —
- Monthly P&I
- —
- Monthly cashflow
- —
- DSCR
- —
- Eligible?
- —
No personal income docs; deal must DSCR.
Hard money
10% down · 12.0% · 12mo
- Down + closing
- —
- Monthly P&I
- —
- Monthly cashflow
- —
- DSCR
- —
- Eligible?
- —
Short-term bridge; refi at stabilization.
Listing history 3 events
-
2026-04-20status Pending
-
2026-04-17historical Active Under Contract
-
2026-04-15$200,000 Active
ⓘ Source: listings_history table (triggers on properties + properties_extension) + one-shot
backfill from property_details.listing_events for pre-trigger history.
Tax reassessment forecast FL · Resets to sale price
- Current annual tax
- $598 · $50/mo
- Projected year-2 tax
- $1,660 · $138/mo
- Expected delta
- +$1,062/yr (+$88/mo · 177.6%)
ⓘ Screening estimate from a state-policy table — verify with the county assessor before closing.
Climate risk First Street
- Flood 1/10 Low FEMA zone A · 0% chance over 30 yrs
- Wildfire 4/10 Moderate
- Heat 9/10 Extreme 7 d/yr ≥108°F today · 23 d/yr by 30 yrs out
- Wind 10/10 Extreme 99% chance of damaging wind over 30 yrs
- Air quality 1/10 Low 0 unhealthy d/yr today · 0 by 30 yrs out
Nearby sold comps map
Loading sold comps map…
Walkable amenities ~0.75 mi
Loading nearby amenities…
Taxation est. · year 1
- Rental income
- $24,507
- − Mortgage interest
- −$11,203
- − Property taxes
- −$598
- − Insurance
- −$2,502
- − Repairs & maintenance
- −$1,961
- − Management
- −$1,961
- − Depreciation
- −$5,818
- Taxable income
- $464
- Est. tax owed @ 24.0%
- −$111
- After-tax cash flow
- $3,563/yr
For passive investors: Depreciation is non-cash, so a rental often shows a tax loss while cash-flowing — sheltering income. Rental losses are passive: they offset passive income freely, and up to $25,000/yr can offset ordinary (W-2) income if you actively participate and your MAGI is under $100k (phasing out to $0 by $150k); unused losses carry forward. On sale, claimed depreciation is recaptured at up to 25%, and gains may owe capital-gains tax (a 1031 exchange can defer both). Figures are a year-1 estimate at your 24.0% rate — not tax advice; consult a CPA.
Schools (NCES district)
- District
- Indian River
- NCES district ID
- 1200930
- Math proficiency
- 48% ▼ -9.00%
- Reading proficiency
- 52% ▼ -3.00%
- Median HH income
- $46,597
- Composite
- 42.45/100
- National rank
- #3218
- State rank
- #35 of 73 in FL
Livability — Fellsmere
- Score
- 79/100
- State rank
- #136
- US rank
- #2043
Category grades
Schools grade is shown separately in the Schools card above.
Census & demographics
- Census place
- Fellsmere, FL
- Population (ZIP)
- 6,802
Population outlook (Indian River County) Hauer SSP2
- Today (2025)
- 165,104 people
- By 2030
- 172,869 · +4.7%
- By 2040
- 185,640 · +12.4%
- By 2050
- 194,465 · +17.8%
- By 2075
- 211,115 · +27.9%
- By 2100
- 211,781 · +28.3%
Race, ethnicity, and origin ACS 2023
- Neighborhood character
- Majority Hispanic (64%)
- Race & ethnicity
- Hispanic / Latino 64% White 29% Two or more races 22% Black 7%
- Hispanic origin (detail)
- Mexican 58%
- Common ancestry
- German 1% Lithuanian 1% Portuguese 1%
- Foreign-born
- 27% · Canada
- Languages at home
- 41% English-only · Spanish 57% French/Haitian/Cajun 2%
Political lean MEDSL · Indian River
- 2024 margin
- Strong R (+27.4) · D 36.0% · R 63.4%
- 2008→2024 swing
- -12.5pp toward R · 2008: -14.8pp · 2024: -27.4pp
- All cycles
- 2024: R+27.4 2020: R+21.6 2016: R+24.5 2012: R+22.3 2008: R+14.8
Not yet ingested
- Civics
- —
Market trends
- HPI YoY
- ▲ 5.19%
- Current HPI
- 340.7468
- Rent YoY
- —
- Metro
- —
- State GDP YoY
- ▲ 3.28%
- F500 in state
- 36
Industry mix (Fortune 500 HQ in FL)
| Industry | F500 HQs | Revenue |
|---|---|---|
| Industrial Technology | 2 | $29B |
|
||
| Insurance | 2 | $17B |
|
||
| Retail | 1 | $60B |
|
||
| Technology Distribution | 1 | $58B |
|
||
| Homebuilding | 1 | $35B |
|
||
| Technology Manufacturing | 1 | $35B |
|
||
Price history
3 events — show timeline
- 2026-04-20 Pending — RAIRCMLS
- 2026-04-17 Contingent — RAIRCMLS
- 2026-04-15 Listed $200,000 RAIRCMLS
Property tax history
+5.9%/yrLatest (2025): $598 · +10.3% YoY. Source: county tax records.
Cash-flow waterfall
monthlySold comps — $/sqft
last 12 mo · ≤1 miLoading sold comps…