1042 Marsh Harrier Dr Unit Cc3-4-7 · Ravenel, SC
Flood risk No data
- FEMA flood zone
- —
- Chance of flooding over 30 yrs
- —
- Est. flood insurance / yr
- —
Fire risk No data
- Est. fire insurance / yr
- —
Heat risk No data
- Hot days now (above threshold)
- —
- Hot days in 30 yrs
- —
Wind risk No data
- Chance of severe wind over 30 yrs
- —
Air-quality risk No data
- Unhealthy air days now
- —
- Unhealthy air days in 30 yrs
- —
Risk factors via First Street. Map © Google.
Why this score? — see what drove the D+ grade
The composite is a weighted blend of 9 inputs, each scored 0–100. Each bar is that input's sub-score; the figure is the points it added to the 100-point composite (weight × sub-score).
- ARV discount +14.4/15.0
- Cash flow +11.8/30.0
- Schools +4.1/10.0
- 1% rule +3.6/10.0
- DSCR +3.5/10.0
- Livability +3.1/5.0
- Rent growth +2.5/5.0
- Condition / age +2.5/5.0
- Appreciation +0.0/10.0
$411,500
🖨 Deal sheet (PDF) 📄 Offer letter ✓ Due diligence
Listing remarks
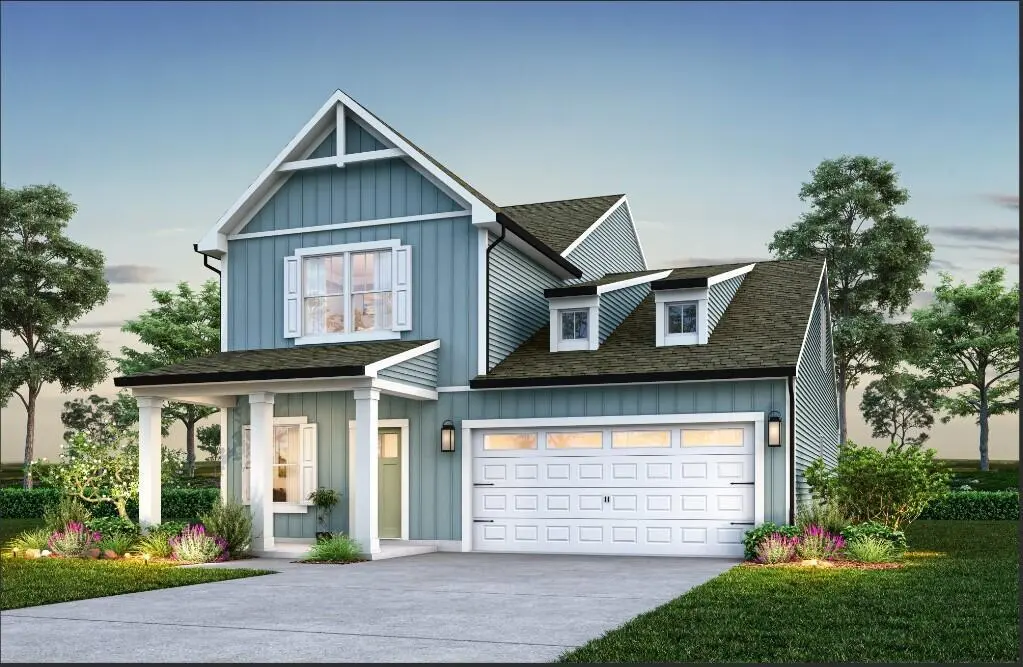
Discover the perfect blend of charm and modern living in this beautiful 4-bedroom, 2.5-bath home with 2,914 square feet of thoughtfully designed space. The open-concept layout welcomes you with hard surface flooring on the first floor, open kitchen, and primary bedroom with large walk-in closet on the first floor. Upstairs you will find 3 bedrooms with walk-in closets, open loft, and finished room over the garage. Talk about storage. Nestled in Homecoming, a quiet master plan community in the highly sought-after DD2 school district, this home combines style, comfort, and location -- everything you've been searching for in one perfect package.
Key facts
- Large walk-in closet
- Open-concept layout
- 6,969 sq ft lot
Tags
Neighborhood map
What this means for you Summary
Snapshot
- This is a 4-bed/2.5-bath single-family listed at $412k.
Deal economics
- At list price, monthly cash flow is $-115 ($-1k/yr) — negative.
- To cash-flow at today's rent, offer at most $395k (4.1% below list).
- To meet the 1% rule (rent ≥ 1% of price), the offer needs to be $355k (13.8% below list).
- Recommended offer: $355k (13.8% below list) — sets the bar for 1% rule.
- Cap rate 6.0% vs local median 1.3% in Ravenel — top-decile yield for the area; either an underpriced asset or a hidden risk that comps aren't pricing in. Stress-test before assuming the spread holds.
Location & tenants
- Location reads 62/100 on livability (#187 in SC) — a middle-class / working-renter tenant base. Strengths: crime A+, housing A+, cost of living A-; Watch: amenities F, commute F, health & safety F.
- Dorchester 02 (suburban): math 40% / reading 55% proficiency, ranked #12 of 80 in SC (top 15%) — families likely to look elsewhere, expect single-tenant / working-renter base with shorter leases.
- Zoned schools: Beech Hill Elementary (math 67% / reading 72%, grade A-, #38 of 597 statewide, top 7%, 1,101 students, 34% FRL); Gregg Middle (math 28% / reading 45%, grade F, #98 of 229 statewide, top 43%, 850 students, 76% FRL); Ashley Ridge High (math 73% / reading 93%, grade A, #18 of 196 statewide, top 9%, 2,542 students, 50% FRL) — zoned schools average 53% FRL vs 36% district-wide (17 pts higher); higher-poverty schools than district average — tighter screening recommended.
- Zoned-school proficiency averages 63% at this address vs 48% district-wide (+16 pts) — the actual schools serving this property are materially stronger than the Dorchester 02 average implies; a family-tenant draw the district grade alone would hide.
- Market conditions: 196 active listings in the ZIP; 2 comparable units currently listed for rent nearby; 1,199 units permitted in Dorchester County in 2024 (0 in 5+ unit buildings).
Forward outlook
- Local home prices are declining (-3.0%/yr); year-one equity from $3k of loan paydown is wiped out by about $12k of value loss. Plan a longer hold.
- Dorchester County population projected at +43% by 2050 — long-run rental-demand tailwind backs the buy-and-hold thesis.
Negotiation context
- It's been on market 94 days — a 9% lower offer ($374k) is reasonable based on typical stale-listing flexibility.
- 2 sale attempts; this cycle's ask has dropped $48k (10%) from the opening price — seller is motivated, your offer sets the floor, not the list.
Questions for the listing agent
- What do current leases actually rent for vs. the listed asking? Can we see a recent rent roll and the last 12 months of T-12 income?
- It's been on market 94 days. Have you received any prior offers? Is the seller open to a 14% concession, seller financing, or rate buy-down credit?
- What does the HOA fee cover, when was the last increase, and are there any pending special assessments or reserve-fund shortfalls?
- Why hasn't it sold? Are there any deal-killer items the seller is aware of (foundation, flood, title, zoning, code violations)?
- Is there a deadline driving the sale (1031 exchange, divorce, estate, relocation)? That informs how much negotiation room exists.
- Schools are F-rated, which usually means shorter tenancies and higher turnover. Who's the typical renter profile here, and what's been the actual vacancy rate?
- The area grade is low — what's the realistic commute time and amenity access for the typical tenant pool here? Any planned neighborhood developments (good or bad) we should know about?
- What's the average days-on-market for RENTAL listings here right now (not sales)? A rising rental-DOM trend means longer vacancies and softer asking-rent achievability than the comps imply.
- What's the recent tenant-quality profile in this submarket — average credit score on applications, eviction rate, late-payment / NSF rate, and stable-employment percentage? A property-management company in the area should have these aggregated.
- How much new for-sale + rental construction is in the pipeline within 1–3 miles? Heavy new supply typically softens prices + rents 12–24 months out; constrained supply supports both.
Investment metrics
- 1% rule
- 0.86% ✗
- Cap rate
- 5.96%
- Cash-on-cash
- -1.20%
- DSCR
- 0.95
- GRM
- 9.7
CMA / ARV
- ARV (on-the-fly)
- $486,638
- Comps found
- 12
Show comp detail 12 sales within ~0.75 mi
| Address | Dist | Beds/Ba | Sqft | Sold | Price | $/sf | Match |
|---|---|---|---|---|---|---|---|
| 1042 Marsh Harrier Dr Unit Cc3-4-7 | 0.00mi | 4/2.5 | 2,914 (0%) | 1mo | $410,000 | $141 | 99 |
| 1046 House Finch Ave Unit Cc3-22-21 | 0.13mi | 5/3.0 (+1) | 2,817 (-3%) | 0mo | $469,900 | $167 | 81 |
| 1042 House Finch Ave Unit Cc3-22-19 | 0.13mi | 5/3.0 (+1) | 2,817 (-3%) | 2mo | $479,900 | $170 | 80 |
| 1017 Field Sparrow Dr | 0.17mi | 4/3.5 | 2,685 (-8%) | 1mo | $520,000 | $194 | 74 |
| 1030 House Finch Ave Unit Cc3-22-14 | 0.11mi | 4/3.5 | 3,229 (+11%) | 1mo | $470,000 | $146 | 72 |
| 1039 Field Sparrow Dr Unit Cc3-23-4 | 0.15mi | 4/2.5 | 2,484 (-15%) | 1mo | $425,580 | $171 | 68 |
| 1012 House Finch Ave Unit Cc3-22-6 | 0.11mi | 4/3.5 | 3,228 (+11%) | 7mo | $545,000 | $169 | 67 |
| 1016 Swamp Harrier Ave | 0.55mi | 4/2.5 | 2,783 (-4%) | 1mo | $383,900 | $138 | 66 |
| 1011 Field Sparrow Dr Unit Cc3-2-7 | 0.17mi | 4/3.5 | 3,229 (+11%) | 9mo | $465,000 | $144 | 63 |
| 1012 Swamp Harrier Ave | 0.56mi | 5/2.5 (+1) | 2,824 (-3%) | 6mo | $450,000 | $159 | 59 |
| 1032 Magnolia Warbler Way | 0.65mi | 3/2.5 (-1) | 2,521 (-14%) | 0mo | $450,000 | $179 | 42 |
| 1068 Magnolia Warbler Way | 0.60mi | 3/2.5 (-1) | 2,500 (-14%) | 3mo | $405,000 | $162 | 41 |
Match score weights: distance 35% · size 25% · config 20% · recency 20%. Top-matched comps best support the ARV.
Projected returns pro-forma
-3.0% appreciation · 3.0% rent growth · sell at horizon
- IRR
- -18.2%
- Equity multiple
- 0.36×
- Total profit
- $-73,927
- Equity at exit
- $61,356
- IRR
- -10.5%
- Equity multiple
- 0.36×
- Total profit
- $-73,428
- Equity at exit
- $35,579
Cash invested: $115,220 (down + closing). Projections, not guarantees.
Landlord ↔ Tenant lean methodology
- Overall (STATE)
- 90 Strongly Landlord-Friendly
- State South Carolina
- 90 Strongly Landlord-Friendly · R+6
- County
- — inherits STATE
- City
- — inherits STATE
ZIP-level market 29470
- Home prices YoY
- -22.9%
- Active inventory
- 196
- Price-to-rent
- 9.7×
Monthly cashflow live
- Estimated rent
- $3,549 medium interval (Pro) →
- Mortgage (P&I)
- −$2,158
- Tax est. 1.5%
- −$514 /mo · $6,172/yr
- Insurance
- −$171
- HOA
- −$75
- Vacancy / Maint / Mgmt
- −$745
- Net cashflow
- $-115
Break-even live
Sensitivity live
| Price | -10% $169 | -5% $27 | +0% $-115 | +5% $-258 | +10% $-400 |
|---|---|---|---|---|---|
| Rent | -10% $-396 | -5% $-256 | +0% $-115 | +5% $25 | +10% $165 |
| Rate | -1.0pp $92 | -0.5pp $-11 | base $-115 | +0.5pp $-222 | +1.0pp $-330 |
UW: 25.0% down · 7.5% · 30yr · 1.5% tax · 5.0% vac · 8.0% maint · 8.0% mgmt
Financing live
Cash to close
- Down payment
- $102,875
- Closing costs
- $12,345
- Reserves months
- —
- Total cash needed
- —
Loan-product check · same deal, 3 products live
Conventional
25% down · 7.5% · 30yr
- Down + closing
- —
- Monthly P&I
- —
- Monthly cashflow
- —
- DSCR
- —
- Eligible?
- —
Personal DTI + credit; lowest rate.
DSCR
20% down · 8.5% · 30yr
- Down + closing
- —
- Monthly P&I
- —
- Monthly cashflow
- —
- DSCR
- —
- Eligible?
- —
No personal income docs; deal must DSCR.
Hard money
10% down · 12.0% · 12mo
- Down + closing
- —
- Monthly P&I
- —
- Monthly cashflow
- —
- DSCR
- —
- Eligible?
- —
Short-term bridge; refi at stabilization.
Rent comps 2 comps
| Address | Beds | Baths | Sqft | Rent | $/sqft | DOM | Units | Dist |
|---|---|---|---|---|---|---|---|---|
| 1088 Magnolia Warbler Way Ravenel, SC | 4.0 | 3.5 | 2671 | $2,999 | $1.12 | 4d | 1 | 0.54mi |
| 245 Summer Tanager Dr Ravenel, SC | 4.0 | 4.0 | 3735 | $4,230 | $1.13 | 4d | 1 | 0.56mi |
HOA detail
- Monthly dues
- $75 · $900/yr
Listing history 9 events
-
2026-04-13status Pending
-
2026-04-08status Active
-
2026-03-04status Pending
-
2026-03-03price $411,500
-
2026-02-09price $426,500
-
2026-02-05price $434,000
-
2026-01-22price $441,500
-
2026-01-05price $451,500
-
2025-12-05$459,000 Active
ⓘ Source: listings_history table (triggers on properties + properties_extension) + one-shot
backfill from property_details.listing_events for pre-trigger history.
Nearby sold comps map
Loading sold comps map…
Walkable amenities ~0.75 mi
Loading nearby amenities…
Taxation est. · year 1
- Rental income
- $42,584
- − Mortgage interest
- −$23,050
- − Property taxes
- −$6,172
- − Insurance
- −$2,058
- − Repairs & maintenance
- −$3,407
- − Management
- −$3,407
- − HOA
- −$900
- − Depreciation
- −$11,971
- Taxable loss
- −$8,381
- Est. tax savings @ 24.0%
- +$2,011
- After-tax cash flow
- $627/yr
For passive investors: Depreciation is non-cash, so a rental often shows a tax loss while cash-flowing — sheltering income. Rental losses are passive: they offset passive income freely, and up to $25,000/yr can offset ordinary (W-2) income if you actively participate and your MAGI is under $100k (phasing out to $0 by $150k); unused losses carry forward. On sale, claimed depreciation is recaptured at up to 25%, and gains may owe capital-gains tax (a 1031 exchange can defer both). Figures are a year-1 estimate at your 24.0% rate — not tax advice; consult a CPA.
Schools (NCES district)
- District
- Dorchester 02
- NCES district ID
- 4502010
- Math proficiency
- 40% ▼ -13.00%
- Reading proficiency
- 55% ▼ -4.00%
- Median HH income
- $57,937
- Composite
- 41.41/100
- National rank
- #3475
- State rank
- #12 of 80 in SC
Livability — Ravenel
- Score
- 62/100
- State rank
- #187
- US rank
- #16410
Category grades
Schools grade is shown separately in the Schools card above.
Census & demographics
- Population (ZIP)
- 5,869
Population outlook (Dorchester County) Hauer SSP2
- Today (2025)
- 186,982 people
- By 2030
- 203,967 · +9.1%
- By 2040
- 237,160 · +26.8%
- By 2050
- 267,479 · +43.1%
- By 2075
- 333,025 · +78.1%
- By 2100
- 366,560 · +96.0%
Race, ethnicity, and origin ACS 2023
- Neighborhood character
- Diverse neighborhood (Simpson 0.58)
- Race & ethnicity
- White 46% Black 45% Hispanic / Latino 5% Two or more races 5%
- Hispanic origin (detail)
- Mexican 3%
- Common ancestry
- Romanian 6% Serbian 1% Lithuanian 1%
- Foreign-born
- 7% · Canada
- Languages at home
- 90% English-only · Spanish 4% Russian/Polish/Slavic 3% Other Indo-European 2%
Political lean MEDSL · Dorchester
- 2024 margin
- R (+14.6) · D 41.8% · R 56.4% · Other 1.9%
- 2008→2024 swing
- +0.9pp no change · 2008: -15.5pp · 2024: -14.6pp
- All cycles
- 2024: R+14.6 2020: R+10.5 2016: R+17.5 2012: R+16.0 2008: R+15.5
Not yet ingested
- Civics
- —
Market trends
- HPI YoY
- ▼ -106.06%
- Current HPI
- 356.2356
- Rent YoY
- —
- Metro
- —
- State GDP YoY
- ▲ 4.51%
- F500 in state
- 2
Industry mix (Fortune 500 HQ in SC)
| Industry | F500 HQs | Revenue |
|---|---|---|
| Packaging | 1 | $7B |
|
||
Price history
-10.3% since first listed9 events — show timeline
- 2026-04-13 Pending — Charleston Trident MLS
- 2026-04-08 Relisted — Charleston Trident MLS
- 2026-03-04 Pending — Charleston Trident MLS
- 2026-03-03 Price Changed $411,500 Charleston Trident MLS
- 2026-02-09 Price Changed $426,500 Charleston Trident MLS
- 2026-02-05 Price Changed $434,000 Charleston Trident MLS
- 2026-01-22 Price Changed $441,500 Charleston Trident MLS
- 2026-01-05 Price Changed $451,500 Charleston Trident MLS
- 2025-12-05 Listed $459,000 Charleston Trident MLS
Cash-flow waterfall
monthlySold comps — $/sqft
last 12 mo · ≤1 miLoading sold comps…