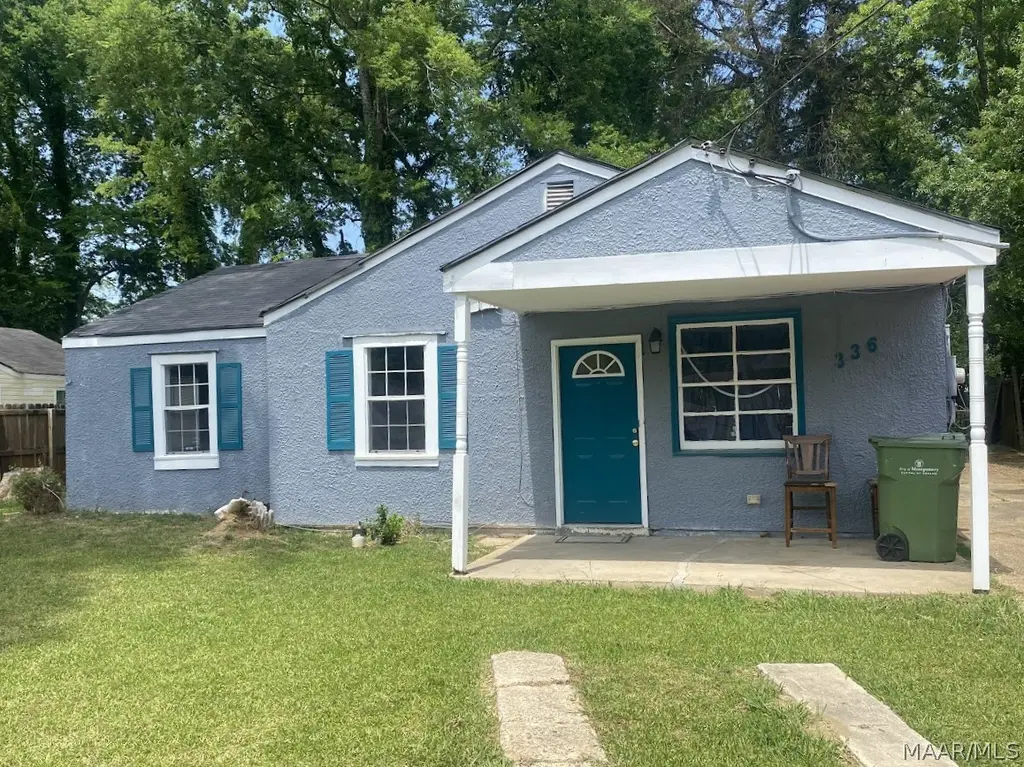
336 Azalea Dr · Montgomery, AL
Flood risk 1/10 · Minimal
- FEMA flood zone
- X (unshaded)
- Chance of flooding over 30 yrs
- 0.0%
- Est. flood insurance / yr
- $507 – $1,088
Fire risk 3/10 · Minor
- Est. fire insurance / yr
- $916 – $1,700
Heat risk 7/10 · Major
- Hot days now (above 108°F)
- 7 days/yr
- Hot days in 30 yrs
- 20 days/yr
Wind risk 8/10 · Major
- Chance of severe wind over 30 yrs
- 80.0%
Air-quality risk 2/10 · Minimal
- Unhealthy air days now
- 1 days/yr
- Unhealthy air days in 30 yrs
- 1 days/yr
Risk factors via First Street. Map © Google.
Why this score? — see what drove the C grade
The composite is a weighted blend of 9 inputs, each scored 0–100. Each bar is that input's sub-score; the figure is the points it added to the 100-point composite (weight × sub-score).
- Cash flow +30.0/30.0
- 1% rule +10.0/10.0
- DSCR +10.0/10.0
- Livability +3.2/5.0
- Rent growth +2.5/5.0
- Condition / age +2.5/5.0
- Schools +1.7/10.0
- ARV discount +0.0/15.0
- Appreciation +0.0/10.0
$49,900
🖨 Deal sheet 📄 Offer letter ✓ Due diligence
Listing remarks
Savvy Investor Special! This 3-bedroom, 1-bath property is a smart opportunity with key updates already in place and strong rental potential. Featuring a newer interior HVAC unit, new LVP flooring, an updated rent-ready kitchen, bathroom and fresh-looking interior paint, this home is positioned for a smooth investment. Whether you are starting your portfolio or adding another income-producing property, this one offers the chance to build equity, create steady rental income, and maximize value with minimal finishing touches. Please schedule your showing today! This is an equitable interest listing where seller is selling only an option contract or assigning an interest in a contract, such as
Key facts
- New lvp flooring
- Updated bathroom
- 7,405 sq ft lot
Tags
Property features AI
Exterior
- Parking: Parking pad (2 spaces)
- Utilities: Cable available; Electricity available; High-speed internet available; Public water; Public sewer
- Home design: Single-story home
- Construction: Stucco exterior; Slab foundation; Built per public records
- Exterior features: City lot; Mature trees
Interior
- Flooring: Laminate
- Bathrooms: 1 full bathroom
- Heating & cooling: Central heating (electric); Central air conditioning (electric)
- Interior features: Laminate flooring
- Laundry & utility: Electric water heater
Neighborhood map
What this means for you Summary
Snapshot
- This is a 3-bed/1.0-bath single-family listed at $50k.
Deal economics
- At list price, monthly cash flow is $628 ($8k/yr) — positive.
- The deal already cash-flows at list — no discount required.
- Meets the 1% rule at list price ($1k rent vs $50k).
- Recommended offer: $48k (3.0% below list) — sets the bar for market timing.
- Cap rate 21.4% vs local median 6.0% in Montgomery — top-decile yield for the area; either an underpriced asset or a hidden risk that comps aren't pricing in. Stress-test before assuming the spread holds.
Location & tenants
- Location reads 65/100 on livability (#138 in AL) — a middle-class / working-renter tenant base. Strengths: cost of living A+, housing A+; Watch: schools C-, employment D, crime F.
- Montgomery County (urban): math 9% / reading 31% proficiency, ranked #106 of 129 in AL (top 82%) — low school quality limits family demand, transient renter base, plan for 1-2y turnover; 70% free/reduced lunch — lower-income household profile, screen leases tightly.
- Market conditions: 79 active listings in the ZIP; 31 comparable units currently listed for rent nearby; rentals lingering (median 44d on market — plan ~5-8 weeks vacancy on turnover, expect pricing pressure); 58% of comp listings sitting > 30 days — soft ceiling on asking rent; lower-income renter base — watch delinquency; 460 units permitted in Montgomery County in 2024 (37 in 5+ unit buildings).
- This rent runs 34% of the median local income ($41k/yr) — at the standard rent-burdened threshold; future hikes will face affordability resistance.
Forward outlook
- Local home prices are declining (-3.0%/yr); year-one equity from $345 of loan paydown is wiped out by about $1k of value loss. Plan a longer hold.
- Montgomery County population projected to shrink 8% by 2050 — rents likely to lag national; underwrite the cash flow, not the appreciation.
- At projected returns (-3.0% appreciation + 3.0% rent growth), your $14k cash investment doubles in ~3 years — after that, you're playing with house money.
Negotiation context
- It's been on market 37 days — a 3% lower offer ($48k) is reasonable based on typical stale-listing flexibility.
Risks & watch-outs
- Watch-outs: built in 1950 — expect roof / HVAC / electrical / plumbing capex.
- Climate carrying-cost: severe wind risk, 80% chance of damaging wind over 30y; extreme-heat days projected 7→20/yr by 2055 (HVAC capex compounding) — expect insurance premiums to compound above CPI over the hold.
Questions for the listing agent
- It's been on market 37 days. Have you received any prior offers? Is the seller open to a 3% concession, seller financing, or rate buy-down credit?
- Built in 1950 — when were the roof, HVAC, electrical panel, plumbing, and water heater last replaced?
- Is there a deadline driving the sale (1031 exchange, divorce, estate, relocation)? That informs how much negotiation room exists.
- Crime grade is F in this area — have there been break-ins, vandalism, or insurance claims at this property in the last 3 years? What carrier currently insures it and at what premium?
- What's the average days-on-market for RENTAL listings here right now (not sales)? A rising rental-DOM trend means longer vacancies and softer asking-rent achievability than the comps imply.
- What's the recent tenant-quality profile in this submarket — average credit score on applications, eviction rate, late-payment / NSF rate, and stable-employment percentage? A property-management company in the area should have these aggregated.
- How much new for-sale + rental construction is in the pipeline within 1–3 miles? Heavy new supply typically softens prices + rents 12–24 months out; constrained supply supports both.
Investment metrics
- 1% rule
- 2.36% ✓
- Cap rate
- 21.41%
- Cash-on-cash
- 53.98%
- DSCR
- 3.40
- GRM
- 3.5
CMA / ARV
- ARV (median comp)
- $39,138
- List price
- $49,900
- Delta
- 27.50%
- Verdict
- OVERPRICED
- Comps
- 20 within 1.0 mi
Show comp detail 12 sales within ~0.75 mi
| Address | Dist | Beds/Ba | Sqft | Sold | Price | $/sf | Match |
|---|---|---|---|---|---|---|---|
| 4053 Rosa L Parks Ave | 0.09mi | 3/1.0 | 1,053 (-7%) | 1mo | $83,000 | $79 | 83 |
| 4204 Rosa L Parks Ave | 0.26mi | 3/1.0 | 1,158 (+2%) | 2mo | $22,500 | $19 | 83 |
| 76 W Clover Ln | 0.32mi | 3/1.0 | 1,118 (-2%) | 2mo | $21,000 | $19 | 80 |
| 501 Japonica St | 0.13mi | 3/1.0 | 1,053 (-7%) | 3mo | $62,500 | $59 | 79 |
| 3831 Oak St | 0.49mi | 3/1.0 | 1,152 (+1%) | 4mo | $14,900 | $13 | 71 |
| 330 National St | 0.42mi | 2/1.0 (-1) | 1,150 (+1%) | 6mo | $50,000 | $43 | 69 |
| 223 Canna Dr | 0.24mi | 2/1.0 (-1) | 1,045 (-8%) | 2mo | $19,500 | $19 | 68 |
| 17 Davis Dr | 0.60mi | 3/1.0 | 1,063 (-6%) | 7mo | $10,000 | $9 | 55 |
| 3804 Southmont Dr | 0.58mi | 3/1.0 | 1,025 (-10%) | 2mo | $40,000 | $39 | 55 |
| 160 Beckview Dr | 0.67mi | 3/2.0 | 1,092 (-4%) | 5mo | $52,000 | $48 | 54 |
| 4054 Ardmore Dr | 0.47mi | 3/1.0 | 1,014 (-11%) | 8mo | $80,000 | $79 | 54 |
| 3594 S Perry St | 0.54mi | 3/2.0 | 1,265 (+11%) | 8mo | $40,000 | $32 | 45 |
Match score weights: distance 35% · size 25% · config 20% · recency 20%. Top-matched comps best support the ARV.
Projected returns pro-forma
-3.0% appreciation · 3.0% rent growth · sell at horizon
- IRR
- 52.1%
- Equity multiple
- 3.29×
- Total profit
- $31,934
- Equity at exit
- $7,440
- IRR
- 57.4%
- Equity multiple
- 6.68×
- Total profit
- $79,317
- Equity at exit
- $4,314
Cash invested: $13,972 (down + closing). Projections, not guarantees.
Landlord ↔ Tenant lean methodology
- Overall (STATE)
- 90 Strongly Landlord-Friendly
- State Alabama
- 90 Strongly Landlord-Friendly · R+15
- County
- — inherits STATE
- City
- — inherits STATE
ZIP-level market 36105
- Home prices YoY
- -32.6%
- Active inventory
- 79
- Price-to-rent
- 3.5×
Monthly cashflow live
- Estimated rent
- $1,178 high interval (Pro) →
- Mortgage (P&I)
- −$262
- Tax from tax record
- −$20 /mo · $239/yr
- Insurance
- −$21
- HOA
- −$0
- Vacancy / Maint / Mgmt
- −$247
- Net cashflow
- $628
Break-even live
UW: 25.0% down · 7.5% · 30yr · 1.5% tax · 5.0% vac · 8.0% maint · 8.0% mgmt
Financing live
Cash to close
- Down payment
- $12,475
- Closing costs
- $1,497
- Reserves months
- —
- Total cash needed
- —
Loan-product check · same deal, 3 products live
Conventional
25% down · 7.5% · 30yr
- Down + closing
- —
- Monthly P&I
- —
- Monthly cashflow
- —
- DSCR
- —
- Eligible?
- —
Personal DTI + credit; lowest rate.
DSCR
20% down · 8.5% · 30yr
- Down + closing
- —
- Monthly P&I
- —
- Monthly cashflow
- —
- DSCR
- —
- Eligible?
- —
No personal income docs; deal must DSCR.
Hard money
10% down · 12.0% · 12mo
- Down + closing
- —
- Monthly P&I
- —
- Monthly cashflow
- —
- DSCR
- —
- Eligible?
- —
Short-term bridge; refi at stabilization.
Rent comps 31 comps
| Address | Beds | Baths | Sqft | Rent | $/sqft | DOM | Units | Dist |
|---|---|---|---|---|---|---|---|---|
| 4148 Edgar D Nixon Ave Montgomery, AL | 4.0 | 1.0 | 1208 | $1,200 | $0.99 | 43d | 1 | 0.12mi |
| 370 Collinwood Ave Montgomery, AL | 3.0 | 1.0 | 1080 | $1,000 | $0.93 | 21d | 1 | 0.26mi |
| 4037 Oak St Montgomery, AL | 3.0 | 2.0 | 1314 | $1,450 | $1.10 | 43d | 1 | 0.38mi |
| 763 Belvedere Dr Montgomery, AL | 3.0 | 1.0 | 1044 | $1,000 | $0.96 | 43d | 1 | 0.41mi |
| 3577 Whiting Ave Montgomery, AL | 3.0 | 1.0 | 1269 | $1,150 | $0.91 | 43d | 1 | 0.62mi |
| 3608 Wilmington Rd Montgomery, AL | 3.0 | 1.0 | 1160 | $950 | $0.82 | 43d | 1 | 0.81mi |
| 718 W Edgemont Ave Unit A Montgomery, AL | 3.0 | 1.0 | 875 | $875 | $1.00 | 43d | 1 | 0.85mi |
| 718 W Edgemont Ave Unit B Montgomery, AL | 2.0 | 1.0 | 875 | $800 | $0.91 | 21d | 1 | 0.85mi |
| 4724 S Court St Montgomery, AL | 2.0 | 1.0 | 800 | $485 | $0.61 | 13d | 1 | 0.89mi |
| 548 Winston Dr Montgomery, AL | 2.0 | 2.5 | 1396 | $1,000 | $0.72 | 43d | 1 | 0.96mi |
| 253 John Morris Ave Montgomery, AL | 3.0 | 1.0 | 912 | $950 | $1.04 | 21d | 1 | 0.96mi |
| 3394 Southmont Dr Unit 2 Montgomery, AL | 2.0 | 1.0 | 810 | $1,475 | $1.82 | 43d | 1 | 0.97mi |
| 3394 Southmont Dr Unit 3 Montgomery, AL | 2.0 | 1.0 | 810 | $1,050 | $1.30 | 43d | 1 | 0.97mi |
| 3515 Norman Bridge Rd Unit A Montgomery, AL | 2.0 | 1.0 | 1150 | $1,150 | $1.00 | 43d | 1 | 0.99mi |
| 3220 Doris Cir Montgomery, AL | 3.0 | 1.0 | 1139 | $1,100 | $0.97 | 43d | 1 | 1.04mi |
| 3751 Wesley Dr Apt A Montgomery, AL | 2.0 | 1.0 | 1034 | $550 | $0.53 | 43d | 1 | 1.06mi |
| 3735 Wesley Dr Montgomery, AL | 3.0 | 1.0 | 1000 | $1,200 | $1.20 | 21d | 1 | 1.09mi |
| 3733 Wesley Dr Montgomery, AL | 3.0 | 1.0 | 1000 | $1,200 | $1.20 | 21d | 1 | 1.09mi |
| 3737 Wesley Dr Montgomery, AL | 3.0 | 2.0 | 1050 | $1,280 | $1.22 | 43d | 1 | 1.10mi |
| 3709 Wesley Dr Montgomery, AL | 3.0 | 1.0 | 1000 | $1,200 | $1.20 | 21d | 1 | 1.10mi |
| 3723 Wesley Dr Montgomery, AL | 3.0 | 1.0 | 1000 | $1,200 | $1.20 | 21d | 1 | 1.10mi |
| 3701 Wesley Dr Unit 3733 Montgomery, AL | 3.0 | 1.0 | 1000 | $1,280 | $1.28 | 43d | 1 | 1.12mi |
| 3701 Wesley Dr Unit 3737 Montgomery, AL | 3.0 | 2.0 | 1050 | $1,280 | $1.22 | 43d | 1 | 1.12mi |
| 3701 Wesley Dr Unit 3723 Montgomery, AL | 3.0 | 1.0 | 1000 | $1,200 | $1.20 | 21d | 1 | 1.12mi |
| 3338 S Hull St Montgomery, AL | 2.0 | 2.0 | 1311 | $1,150 | $0.88 | 21d | 1 | 1.12mi |
| 3735 Bridlewood Dr Montgomery, AL | 3.0 | 1.0 | 1386 | $895 | $0.65 | 43d | 1 | 1.16mi |
| 3649 Princeton Rd Montgomery, AL | 3.0 | 1.0 | 1266 | $1,200 | $0.95 | 21d | 1 | 1.22mi |
| 3445 Le Bron Rd Montgomery, AL | 4.0 | 1.0 | 1100 | $1,050 | $0.95 | 21d | 1 | 1.25mi |
| 3357 Lexington Rd Montgomery, AL | 2.0 | 1.0 | 1200 | $1,175 | $0.98 | 13d | 1 | 1.27mi |
| 105 Arlington Rd Unit B Montgomery, AL | 2.0 | 1.0 | 1100 | $925 | $0.84 | 43d | 1 | 1.30mi |
| 3369 Montezuma Rd Montgomery, AL | 3.0 | 1.0 | 1281 | $1,150 | $0.90 | 43d | 1 | 1.39mi |
Listing history 16 events
-
2026-06-18days on market $49,900 Active 37 DOM
-
2026-06-17days on market $49,900 Active 36 DOM
-
2026-06-16days on market $49,900 Active 35 DOM
-
2026-06-15days on market $49,900 Active 34 DOM
-
2026-06-14days on market $49,900 Active 32 DOM
-
2026-06-13pricedays on market $49,900 Active 31 DOM
-
2026-06-10days on market $51,900 Active 29 DOM
-
2026-06-09days on market $51,900 Active 28 DOM
-
2026-06-08days on market $51,900 Active 27 DOM
-
2026-06-07days on market $51,900 Active 26 DOM
-
2026-06-03days on market $51,900 Active 22 DOM
-
2026-06-02days on market $51,900 Active 21 DOM
-
2026-06-01days on market $51,900 Active 20 DOM
-
2026-05-31days on market $51,900 Active 19 DOM
-
2026-05-30days on market $51,900 Active 18 DOM
-
2026-05-12$54,900 Active 900-char remark
ⓘ Source: listings_history table (triggers on properties + properties_extension) + one-shot
backfill from property_details.listing_events for pre-trigger history.
Tax reassessment forecast AL · Resets to sale price
- Current annual tax
- $239 · $20/mo
- Projected year-2 tax
- $239 · $20/mo
- Expected delta
- $0/yr ($0/mo · 0.0%)
ⓘ Screening estimate from a state-policy table — verify with the county assessor before closing.
Climate risk First Street
- Flood 1/10 Low FEMA zone X (unshaded) · 0% chance over 30 yrs
- Wildfire 3/10 Moderate
- Heat 7/10 Severe 7 d/yr ≥108°F today · 20 d/yr by 30 yrs out
- Wind 8/10 Severe 80% chance of damaging wind over 30 yrs
- Air quality 2/10 Low 1 unhealthy d/yr today · 1 by 30 yrs out
Nearby sold comps map
Loading sold comps map…
Walkable amenities ~0.75 mi
Loading nearby amenities…
Taxation est. · year 1
- Rental income
- $14,139
- − Mortgage interest
- −$2,795
- − Property taxes
- −$239
- − Insurance
- −$250
- − Repairs & maintenance
- −$1,131
- − Management
- −$1,131
- − Depreciation
- −$1,452
- Taxable income
- $7,142
- Est. tax owed @ 24.0%
- −$1,714
- After-tax cash flow
- $5,828/yr
For passive investors: Depreciation is non-cash, so a rental often shows a tax loss while cash-flowing — sheltering income. Rental losses are passive: they offset passive income freely, and up to $25,000/yr can offset ordinary (W-2) income if you actively participate and your MAGI is under $100k (phasing out to $0 by $150k); unused losses carry forward. On sale, claimed depreciation is recaptured at up to 25%, and gains may owe capital-gains tax (a 1031 exchange can defer both). Figures are a year-1 estimate at your 24.0% rate — not tax advice; consult a CPA.
Schools (NCES district)
- District
- Montgomery County
- NCES district ID
- 0102430
- Math proficiency
- 9% ▼ -21.00%
- Reading proficiency
- 31% ▼ -1.00%
- Median HH income
- $43,902
- Composite
- 17.24/100
- National rank
- #9093
- State rank
- #106 of 129 in AL
Livability — Montgomery
- Score
- 65/100
- State rank
- #138
- US rank
- #13416
Category grades
Schools grade is shown separately in the Schools card above.
Census & demographics
- Census place
- Montgomery, AL
- County
- Montgomery County · 190,016 people
- City population
- 175,913
- Metro
- Montgomery, AL
- Population (ZIP)
- 9,207
- Household income
- $41,486
- Rent vs Own
- Severe rent burden
- 679.0
Population outlook (Montgomery County) Hauer SSP2
- Today (2025)
- 224,008 people
- By 2030
- 221,460 · -1.1%
- By 2040
- 214,179 · -4.4%
- By 2050
- 204,912 · -8.5%
- By 2075
- 177,821 · -20.6%
- By 2100
- 145,134 · -35.2%
Race, ethnicity, and origin ACS 2023
- Neighborhood character
- Predominantly Black (83%)
- Race & ethnicity
- Black 83% White 12% Hispanic / Latino 4% Two or more races 3%
- Common ancestry
- Italian 1%
- Foreign-born
- 3% · Canada, South Korea
- Languages at home
- 95% English-only · Spanish 4%
Political lean MEDSL · Montgomery
- 2024 margin
- Solid D (+30.7) · D 64.8% · R 34.1% · Other 1.1%
- 2008→2024 swing
- +11.5pp toward D · 2008: 19.2pp · 2024: 30.7pp
- All cycles
- 2024: D+30.7 2020: D+31.5 2016: D+26.2 2012: D+24.3 2008: D+19.2
Not yet ingested
- Civics
- —
Market trends
- HPI YoY
- ▼ -31.17%
- Current HPI
- 64.4673
- Rent YoY
- —
- Metro
- Montgomery, AL
- State GDP YoY
- ▲ 2.94%
- F500 in state
- 4
Industry mix (Fortune 500 HQ in AL)
| Industry | F500 HQs | Revenue |
|---|---|---|
| Financial Services | 1 | $8B |
|
||
| Healthcare | 1 | $5B |
|
||
Price history
-9.1% since first listed3 events — show timeline
- 2026-06-12 Price Changed $49,900 MAAR
- 2026-05-28 Price Changed $51,900 MAAR
- 2026-05-12 Listed $54,900 MAAR
Property tax history
+0.8%/yrLatest (2025): $239 · +7.0% YoY. Source: county tax records.
Cash-flow waterfall
monthlySold comps — $/sqft
last 12 mo · ≤1 miLoading sold comps…