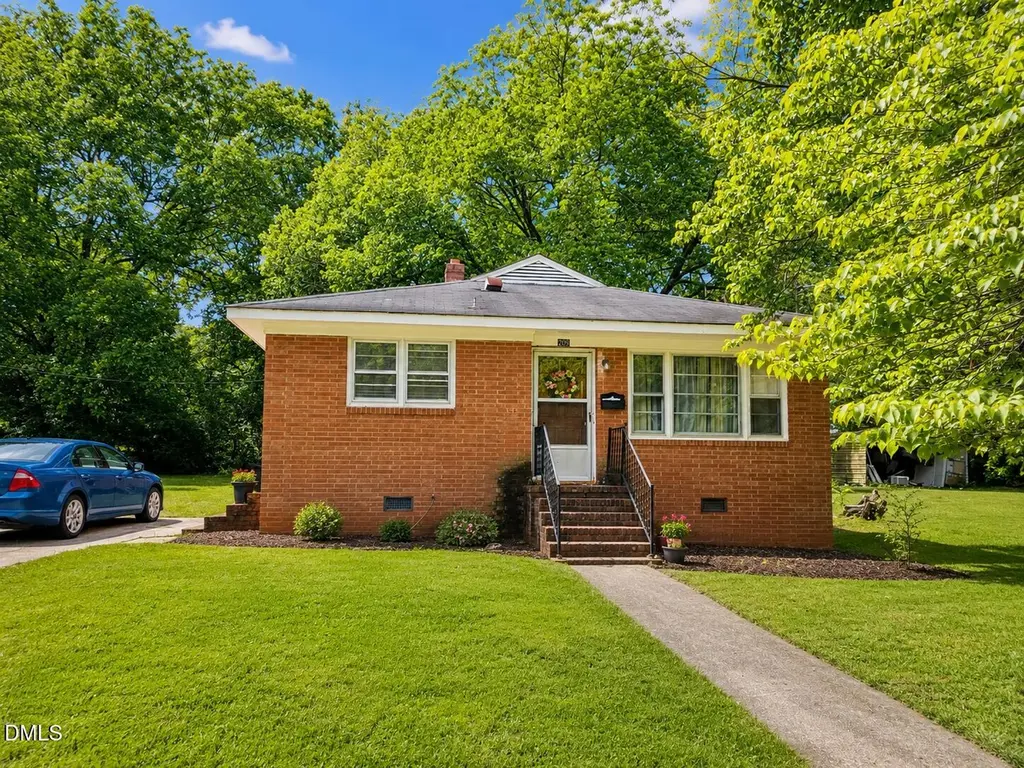
209 Lee St · Oxford, NC
Flood risk 1/10 · Minimal
- FEMA flood zone
- X (unshaded)
- Chance of flooding over 30 yrs
- 0.0%
- Est. flood insurance / yr
- $507 – $1,088
Fire risk 1/10 · Minimal
- Est. fire insurance / yr
- $906 – $1,684
Heat risk 6/10 · Moderate
- Hot days now (above 104°F)
- 7 days/yr
- Hot days in 30 yrs
- 17 days/yr
Wind risk 6/10 · Moderate
- Chance of severe wind over 30 yrs
- 27.0%
Air-quality risk 1/10 · Minimal
- Unhealthy air days now
- 0 days/yr
- Unhealthy air days in 30 yrs
- 0 days/yr
Risk factors via First Street. Map © Google.
Why this score? — see what drove the C+ grade
The composite is a weighted blend of 9 inputs, each scored 0–100. Each bar is that input's sub-score; the figure is the points it added to the 100-point composite (weight × sub-score).
- Cash flow +24.7/30.0
- ARV discount +15.0/15.0
- DSCR +8.0/10.0
- 1% rule +5.7/10.0
- Livability +2.9/5.0
- Schools +2.8/10.0
- Rent growth +2.5/5.0
- Condition / age +2.5/5.0
- Appreciation +0.0/10.0
$120,000
🖨 Deal sheet 📄 Offer letter ✓ Due diligence
Listing remarks
Charming brick home conveniently located in Oxford featuring 3 bedrooms and 1 bathroom. This property offers a functional layout, spacious yard, and great potential for a first-time homebuyer, investor, or someone looking to add their personal touch. Conveniently located near downtown Oxford, shopping, dining, and major roadways. Sold as-is.
Key facts
- 0.27 acre lot
- Built 1950
- Listed 6 days
Property features AI
Finance
- Other: Lot approximately 0.27 acres
- HOA & community: No association
Exterior
- Parking: Driveway
- Utilities: Public water; Public sewer; Electricity connected; Natural gas connected; Sewer connected; Cable available
- Home design: One-story house; Fixer condition
- Construction: Brick construction; Shingle roof; Combination foundation; Built as a house
- Exterior features: City street frontage; Public maintained road
Interior
- Kitchen: Eat-in kitchen
- Bedrooms: 3 bedrooms (all on the main level)
- Flooring: Carpet; Laminate
- Bathrooms: 1 full bathroom
- Heating & cooling: Natural gas heating; Window unit(s) for cooling
- Interior features: Bathtub/shower combination; Eat-in kitchen; Has basement (crawl space)
- Laundry & utility: Washer hookup; Electric dryer hookup; Laundry located in kitchen
Neighborhood map
What this means for you Summary
Snapshot
- This is a 3-bed/1.0-bath single-family listed at $120k.
Deal economics
- At list price, monthly cash flow is $251 ($3k/yr) — positive.
- The deal already cash-flows at list — no discount required.
- Meets the 1% rule at list price ($1k rent vs $120k).
- Cap rate 8.8% vs local median 2.7% in Oxford — top-decile yield for the area; either an underpriced asset or a hidden risk that comps aren't pricing in. Stress-test before assuming the spread holds.
Location & tenants
- Location reads 57/100 on livability (#610 in NC) — a working-class tenant base; expect higher turnover. Strengths: cost of living A+, health & safety A+, housing A-; Watch: crime F, amenities F, commute F.
- Granville County Schools (rural): math 28% / reading 36% proficiency, ranked #137 of 178 in NC (top 77%) — families likely to look elsewhere, expect single-tenant / working-renter base with shorter leases.
- Zoned schools: Northern Granville Middle (math 17% / reading 28%, grade F, #410 of 475 statewide, top 87%, 525 students, 82% FRL) — zoned schools average 82% FRL vs 50% district-wide (32 pts higher); higher-poverty schools than district average — tighter screening recommended.
- Market conditions: 257 active listings in the ZIP; 2 comparable units currently listed for rent nearby; 428 units permitted in Granville County in 2024 (120 in 5+ unit buildings).
Forward outlook
- Local home prices are declining (-3.0%/yr); year-one equity from $830 of loan paydown is wiped out by about $4k of value loss. Plan a longer hold.
Negotiation context
- Only 6 days on market — expect competitive offers; lowballing is unlikely to land.
Risks & watch-outs
- Watch-outs: built in 1950 — expect roof / HVAC / electrical / plumbing capex.
- Climate carrying-cost: major wind risk, 27% chance of damaging wind over 30y; extreme-heat days projected 7→17/yr by 2055 (HVAC capex compounding) — expect insurance premiums to compound above CPI over the hold.
Questions for the listing agent
- Built in 1950 — when were the roof, HVAC, electrical panel, plumbing, and water heater last replaced?
- Is there a deadline driving the sale (1031 exchange, divorce, estate, relocation)? That informs how much negotiation room exists.
- Schools are F-rated, which usually means shorter tenancies and higher turnover. Who's the typical renter profile here, and what's been the actual vacancy rate?
- Crime grade is F in this area — have there been break-ins, vandalism, or insurance claims at this property in the last 3 years? What carrier currently insures it and at what premium?
- What's the average days-on-market for RENTAL listings here right now (not sales)? A rising rental-DOM trend means longer vacancies and softer asking-rent achievability than the comps imply.
- What's the recent tenant-quality profile in this submarket — average credit score on applications, eviction rate, late-payment / NSF rate, and stable-employment percentage? A property-management company in the area should have these aggregated.
- How much new for-sale + rental construction is in the pipeline within 1–3 miles? Heavy new supply typically softens prices + rents 12–24 months out; constrained supply supports both.
Investment metrics
- 1% rule
- 1.07% ✓
- Cap rate
- 8.80%
- Cash-on-cash
- 8.96%
- DSCR
- 1.40
- GRM
- 7.8
CMA / ARV
- ARV (on-the-fly)
- $212,856
- Comps found
- 10
Show comp detail 10 sales within ~0.75 mi
| Address | Dist | Beds/Ba | Sqft | Sold | Price | $/sf | Match |
|---|---|---|---|---|---|---|---|
| 308 Lanier St | 0.11mi | 3/1.0 | 1,105 (+2%) | 1mo | $210,000 | $190 | 91 |
| 511 Broad St | 0.38mi | 3/2.0 | 1,224 (+13%) | 5mo | $267,500 | $219 | 53 |
| 120 Clement Ave | 0.40mi | 3/2.0 | 1,210 (+11%) | 7mo | $249,900 | $207 | 52 |
| 124 W College St | 0.64mi | 3/1.0 | 1,002 (-8%) | 15mo | $221,450 | $221 | 45 |
| 217 Clement Ave | 0.48mi | 3/2.0 | 1,000 (-8%) | 20mo | $184,000 | $184 | 43 |
| 415 Cherry St | 0.67mi | 3/1.0 | 978 (-10%) | 15mo | $50,000 | $51 | 40 |
| 202 Delacroix St | 0.73mi | 2/1.0 (-1) | 1,016 (-6%) | 14mo | $230,000 | $226 | 38 |
| 306 Coleman St | 0.56mi | 3/2.0 | 1,245 (+15%) | 10mo | $220,000 | $177 | 38 |
| 815 Goshen St | 0.71mi | 3/2.0 | 1,198 (+10%) | 10mo | $235,000 | $196 | 37 |
| 215 E Quailridge Rd | 0.72mi | 3/2.0 | 1,240 (+14%) | 21mo | $240,000 | $194 | 21 |
Match score weights: distance 35% · size 25% · config 20% · recency 20%. Top-matched comps best support the ARV.
Projected returns pro-forma
-3.0% appreciation · 3.0% rent growth · sell at horizon
- IRR
- -2.8%
- Equity multiple
- 0.90×
- Total profit
- $-3,488
- Equity at exit
- $17,892
- IRR
- 6.9%
- Equity multiple
- 1.52×
- Total profit
- $17,454
- Equity at exit
- $10,375
Cash invested: $33,600 (down + closing). Projections, not guarantees.
Landlord ↔ Tenant lean methodology
- Overall (STATE)
- 85 Strongly Landlord-Friendly
- State North Carolina
- 85 Strongly Landlord-Friendly · R+3
- County
- — inherits STATE
- City
- — inherits STATE
ZIP-level market 27565
- Active inventory
- 257
- Price-to-rent
- 7.8×
Monthly cashflow live
- Estimated rent
- $1,286 medium interval (Pro) →
- Mortgage (P&I)
- −$629
- Tax from tax record
- −$86 /mo · $1,028/yr
- Insurance
- −$50
- HOA
- −$0
- Vacancy / Maint / Mgmt
- −$270
- Net cashflow
- $251
Break-even live
UW: 25.0% down · 7.5% · 30yr · 1.5% tax · 5.0% vac · 8.0% maint · 8.0% mgmt
Financing live
Cash to close
- Down payment
- $30,000
- Closing costs
- $3,600
- Reserves months
- —
- Total cash needed
- —
Loan-product check · same deal, 3 products live
Conventional
25% down · 7.5% · 30yr
- Down + closing
- —
- Monthly P&I
- —
- Monthly cashflow
- —
- DSCR
- —
- Eligible?
- —
Personal DTI + credit; lowest rate.
DSCR
20% down · 8.5% · 30yr
- Down + closing
- —
- Monthly P&I
- —
- Monthly cashflow
- —
- DSCR
- —
- Eligible?
- —
No personal income docs; deal must DSCR.
Hard money
10% down · 12.0% · 12mo
- Down + closing
- —
- Monthly P&I
- —
- Monthly cashflow
- —
- DSCR
- —
- Eligible?
- —
Short-term bridge; refi at stabilization.
Rent comps 2 comps
| Address | Beds | Baths | Sqft | Rent | $/sqft | DOM | Units | Dist |
|---|---|---|---|---|---|---|---|---|
| 218 College St Unit A Oxford, NC | 2.0 | 1.0 | 900 | $1,350 | $1.50 | 23d | 1 | 0.26mi |
| 228 Wilmington Ave Unit 230 Oxford, NC | 2.0 | 1.5 | 992 | $995 | $1.00 | 23d | 1 | 1.29mi |
Listing history 7 events
-
2026-06-08statusdays on market $120,000 Pending 6 DOM
-
2026-06-07days on market $120,000 Active 5 DOM
-
2026-06-05days on market $120,000 Active 2 DOM
-
2026-06-02statusdays on market $120,000 Active 1 DOM
-
2026-06-01days on market $120,000 Coming Soon 6 DOM
-
2026-05-31days on market $120,000 Coming Soon 5 DOM
-
2026-05-26historical $120,000
ⓘ Source: listings_history table (triggers on properties + properties_extension) + one-shot
backfill from property_details.listing_events for pre-trigger history.
Tax reassessment forecast NC · Resets to sale price
- Current annual tax
- $1,028 · $86/mo
- Projected year-2 tax
- $1,028 · $86/mo
- Expected delta
- $0/yr ($0/mo · 0.0%)
ⓘ Screening estimate from a state-policy table — verify with the county assessor before closing.
Climate risk First Street
- Flood 1/10 Low FEMA zone X (unshaded) · 0% chance over 30 yrs
- Wildfire 1/10 Low
- Heat 6/10 Major 7 d/yr ≥104°F today · 17 d/yr by 30 yrs out
- Wind 6/10 Major 27% chance of damaging wind over 30 yrs
- Air quality 1/10 Low 0 unhealthy d/yr today · 0 by 30 yrs out
Nearby sold comps map
Loading sold comps map…
Walkable amenities ~0.75 mi
Loading nearby amenities…
Taxation est. · year 1
- Rental income
- $15,429
- − Mortgage interest
- −$6,722
- − Property taxes
- −$1,028
- − Insurance
- −$600
- − Repairs & maintenance
- −$1,234
- − Management
- −$1,234
- − Depreciation
- −$3,491
- Taxable income
- $1,120
- Est. tax owed @ 24.0%
- −$269
- After-tax cash flow
- $2,741/yr
For passive investors: Depreciation is non-cash, so a rental often shows a tax loss while cash-flowing — sheltering income. Rental losses are passive: they offset passive income freely, and up to $25,000/yr can offset ordinary (W-2) income if you actively participate and your MAGI is under $100k (phasing out to $0 by $150k); unused losses carry forward. On sale, claimed depreciation is recaptured at up to 25%, and gains may owe capital-gains tax (a 1031 exchange can defer both). Figures are a year-1 estimate at your 24.0% rate — not tax advice; consult a CPA.
Schools (NCES district)
- District
- Granville County Schools
- NCES district ID
- 3701800
- Math proficiency
- 28% ▼ -1.00%
- Reading proficiency
- 36% ▬ 0.00%
- Median HH income
- $49,713
- Composite
- 27.81/100
- National rank
- #6887
- State rank
- #137 of 178 in NC
Livability — Oxford
- Score
- 57/100
- State rank
- #610
- US rank
- #22195
Category grades
Schools grade is shown separately in the Schools card above.
Census & demographics
- Census place
- Oxford, NC
- Population (ZIP)
- 23,658
Population outlook (Granville County) Hauer SSP2
- Today (2025)
- 60,753 people
- By 2030
- 61,381 · +1.0%
- By 2040
- 61,861 · +1.8%
- By 2050
- 61,261 · +0.8%
- By 2075
- 59,948 · -1.3%
- By 2100
- 55,273 · -9.0%
Race, ethnicity, and origin ACS 2023
- Neighborhood character
- Diverse neighborhood (Simpson 0.59)
- Race & ethnicity
- White 50% Black 39% Two or more races 6% Hispanic / Latino 6%
- Hispanic origin (detail)
- Mexican 3%
- Common ancestry
- Slovak 1% Serbian 1% Italian 1%
- Foreign-born
- 3% · Canada
- Languages at home
- 95% English-only · Spanish 4%
Political lean MEDSL · Granville
- 2024 margin
- Lean R (+9.4) · D 44.8% · R 54.2%
- 2008→2024 swing
- -16.0pp toward R · 2008: 6.6pp · 2024: -9.4pp
- All cycles
- 2024: R+9.4 2020: R+6.6 2016: R+2.5 2012: D+4.6 2008: D+6.6
Not yet ingested
- Civics
- —
Market trends
- HPI YoY
- ▼ -114.56%
- Current HPI
- 209.2788
- Rent YoY
- —
- Metro
- —
- State GDP YoY
- ▲ 3.28%
- F500 in state
- 26
Industry mix (Fortune 500 HQ in NC)
| Industry | F500 HQs | Revenue |
|---|---|---|
| Financial Services | 2 | $213B |
|
||
| Retail | 2 | $95B |
|
||
| Industrial Conglomerate | 1 | $38B |
|
||
| Metals / Steel | 1 | $35B |
|
||
| Utilities | 1 | $30B |
|
||
| Industrial Machinery | 1 | $19B |
|
||
Price history
1 event — show timeline
- 2026-05-26 Coming Soon $120,000 TMLS
Property tax history
+2.4%/yrLatest (2025): $1,028 · +1.7% YoY. Source: county tax records.
Cash-flow waterfall
monthlySold comps — $/sqft
last 12 mo · ≤1 miLoading sold comps…