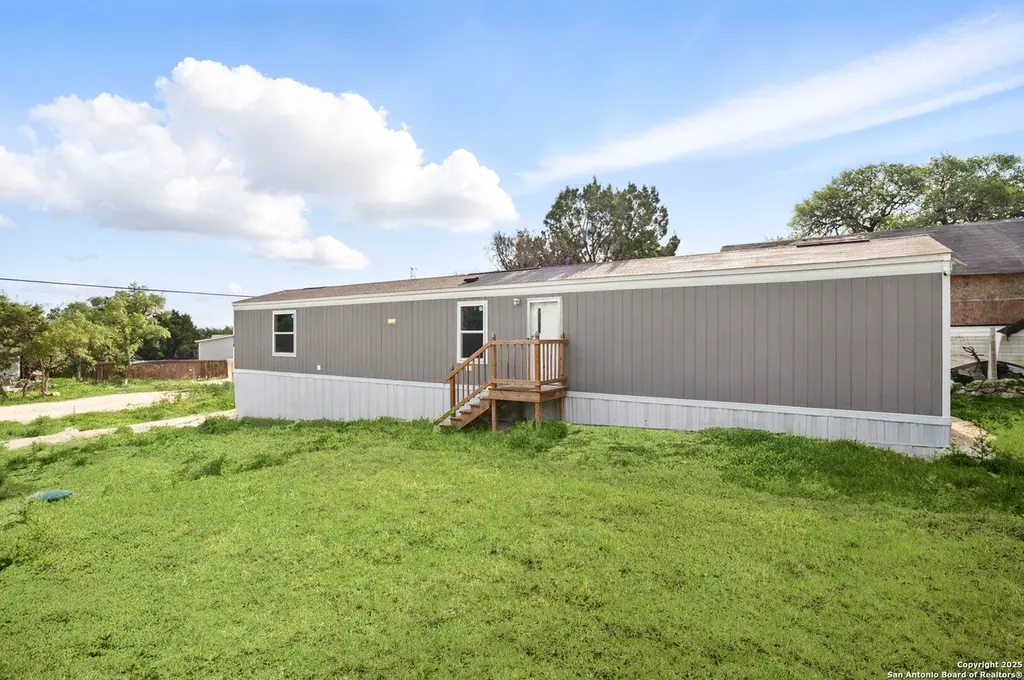
938 Covered Wagon · Canyon Lake, TX
Flood risk 1/10 · Minimal
- FEMA flood zone
- X (unshaded)
- Chance of flooding over 30 yrs
- 0.0%
- Est. flood insurance / yr
- $507 – $1,088
Fire risk 5/10 · Moderate
- Est. fire insurance / yr
- $1,222 – $2,270
Heat risk 7/10 · Major
- Hot days now (above 107°F)
- 7 days/yr
- Hot days in 30 yrs
- 22 days/yr
Wind risk 6/10 · Moderate
- Chance of severe wind over 30 yrs
- 68.0%
Air-quality risk 2/10 · Minimal
- Unhealthy air days now
- 1 days/yr
- Unhealthy air days in 30 yrs
- 1 days/yr
Risk factors via First Street. Map © Google.
Why this score? — see what drove the B grade
The composite is a weighted blend of 9 inputs, each scored 0–100. Each bar is that input's sub-score; the figure is the points it added to the 100-point composite (weight × sub-score).
- Cash flow +28.3/30.0
- ARV discount +11.9/15.0
- DSCR +10.0/10.0
- 1% rule +6.7/10.0
- Schools +5.2/10.0
- Livability +3.4/5.0
- Rent growth +2.5/5.0
- Condition / age +2.5/5.0
- Appreciation +0.0/10.0
$158,000
🖨 Deal sheet 📄 Offer letter ✓ Due diligence
Listing remarks MLS
Welcome home to this beautiful 2023 manufactured home on a generous 0.236-acre lot in Cypress Lake Gardens! With room to add a garage, carport, shop, or RV parking, the possibilities are endless. Spend time outdoors at the neighborhood park and playground, and enjoy the convenient location near US-281, shopping, and dining. A versatile property in a prime location-don't miss it!
Key facts
- 0.236-acre lot
- Convenient location
- Neighborhood park
Tags
Neighborhood map
What this means for you Summary
Snapshot
- This is a 3-bed/2.0-bath manufactured listed at $158k.
Deal economics
- At list price, monthly cash flow is $506 ($6k/yr) — positive.
- The deal already cash-flows at list — no discount required.
- Meets the 1% rule at list price ($2k rent vs $158k).
- Recommended offer: $139k (12.0% below list) — sets the bar for market timing.
- Cap rate 10.1% vs local median 2.3% in Canyon Lake — top-decile yield for the area; either an underpriced asset or a hidden risk that comps aren't pricing in. Stress-test before assuming the spread holds.
Location & tenants
- Location reads 67/100 on livability (#534 in TX) — a middle-class / working-renter tenant base. Strengths: employment A+, housing A+, cost of living A; Watch: schools C-, amenities F, commute F.
- Comal ISD (rural): math 57% / reading 59% proficiency, ranked #58 of 826 in TX (top 7%) — acceptable for families but not a draw, mixed tenant base, ~2y average lease.
- Market conditions: 633 active listings in the ZIP; 2 comparable units currently listed for rent nearby; high-income renter base; 3,420 units permitted in Comal County in 2024 (1,164 in 5+ unit buildings).
Forward outlook
- Local home prices are declining (-3.0%/yr); year-one equity from $1k of loan paydown is wiped out by about $5k of value loss. Plan a longer hold.
- Comal County population projected at +70% by 2050 — long-run rental-demand tailwind backs the buy-and-hold thesis.
- At projected returns (-3.0% appreciation + 3.0% rent growth), your $44k cash investment doubles in ~9 years — after that, you're playing with house money.
Negotiation context
- It's been on market 230 days — a 12% lower offer ($139k) is reasonable based on typical stale-listing flexibility.
- 17 sale attempts since 4y ago with the ask held roughly flat each time — persistent listings suggest the price (not the market) is what's stuck; bring a comps-based counter.
Risks & watch-outs
- Climate carrying-cost: major wind risk, 68% chance of damaging wind over 30y; moderate wildfire risk; extreme-heat days projected 7→22/yr by 2055 (HVAC capex compounding) — expect insurance premiums to compound above CPI over the hold.
Questions for the listing agent
- It's been on market 230 days. Have you received any prior offers? Is the seller open to a 12% concession, seller financing, or rate buy-down credit?
- What does the HOA fee cover, when was the last increase, and are there any pending special assessments or reserve-fund shortfalls?
- Why hasn't it sold? Are there any deal-killer items the seller is aware of (foundation, flood, title, zoning, code violations)?
- Is there a deadline driving the sale (1031 exchange, divorce, estate, relocation)? That informs how much negotiation room exists.
- What's the average days-on-market for RENTAL listings here right now (not sales)? A rising rental-DOM trend means longer vacancies and softer asking-rent achievability than the comps imply.
- What's the recent tenant-quality profile in this submarket — average credit score on applications, eviction rate, late-payment / NSF rate, and stable-employment percentage? A property-management company in the area should have these aggregated.
- How much new for-sale + rental construction is in the pipeline within 1–3 miles? Heavy new supply typically softens prices + rents 12–24 months out; constrained supply supports both.
Investment metrics
- 1% rule
- 1.17% ✓
- Cap rate
- 10.14%
- Cash-on-cash
- 13.72%
- DSCR
- 1.61
- GRM
- 7.1
CMA / ARV
- ARV (median comp)
- $175,000
- List price
- $158,000
- Delta
- -9.71%
- Verdict
- FAIR
- Comps
- 7 within 1.0 mi
Show comp detail 1 sale within ~0.75 mi
| Address | Dist | Beds/Ba | Sqft | Sold | Price | $/sf | Match |
|---|---|---|---|---|---|---|---|
| 2931 Western Skies Dr | 0.06mi | 2/2.0 (-1) | 896 (-1%) | 9mo | $199,900 | $223 | 83 |
Match score weights: distance 35% · size 25% · config 20% · recency 20%. Top-matched comps best support the ARV.
Projected returns pro-forma
-3.0% appreciation · 3.0% rent growth · sell at horizon
- IRR
- 3.8%
- Equity multiple
- 1.15×
- Total profit
- $6,571
- Equity at exit
- $23,558
- IRR
- 13.3%
- Equity multiple
- 2.06×
- Total profit
- $47,005
- Equity at exit
- $13,661
Cash invested: $44,240 (down + closing). Projections, not guarantees.
Landlord ↔ Tenant lean methodology
- Overall (STATE)
- 87 Strongly Landlord-Friendly
- State Texas
- 87 Strongly Landlord-Friendly · R+5
- County
- — inherits STATE
- City
- — inherits STATE
ZIP-level market 78070
- Home prices YoY
- -20.8%
- Active inventory
- 633
- Price-to-rent
- 7.1×
Monthly cashflow live
- Estimated rent
- $1,856 medium interval (Pro) →
- Mortgage (P&I)
- −$829
- Tax from tax record
- −$61 /mo · $733/yr
- Insurance
- −$66
- HOA
- −$5
- Vacancy / Maint / Mgmt
- −$390
- Net cashflow
- $506
Break-even live
UW: 25.0% down · 7.5% · 30yr · 1.5% tax · 5.0% vac · 8.0% maint · 8.0% mgmt
Financing live
Cash to close
- Down payment
- $39,500
- Closing costs
- $4,740
- Reserves months
- —
- Total cash needed
- —
Loan-product check · same deal, 3 products live
Conventional
25% down · 7.5% · 30yr
- Down + closing
- —
- Monthly P&I
- —
- Monthly cashflow
- —
- DSCR
- —
- Eligible?
- —
Personal DTI + credit; lowest rate.
DSCR
20% down · 8.5% · 30yr
- Down + closing
- —
- Monthly P&I
- —
- Monthly cashflow
- —
- DSCR
- —
- Eligible?
- —
No personal income docs; deal must DSCR.
Hard money
10% down · 12.0% · 12mo
- Down + closing
- —
- Monthly P&I
- —
- Monthly cashflow
- —
- DSCR
- —
- Eligible?
- —
Short-term bridge; refi at stabilization.
Rent comps 2 comps
| Address | Beds | Baths | Sqft | Rent | $/sqft | DOM | Units | Dist |
|---|---|---|---|---|---|---|---|---|
| 2381 Cypress Gardens Blvd Spring Branch, TX | 2.0 | 1.0 | 800 | $1,195 | $1.49 | 43d | 1 | 0.27mi |
| 2341 Puter Creek Rd Spring Branch, TX | 2.0 | 2.0 | 1000 | $1,700 | $1.70 | 43d | 1 | 1.32mi |
HOA detail
- Monthly dues
- $5 · $60/yr
Listing history 50 events
-
2026-06-18days on market $158,000 Active 230 DOM
-
2026-06-17days on market $158,000 Active 229 DOM
-
2026-06-16days on market $158,000 Active 228 DOM
-
2026-06-15days on market $158,000 Active 227 DOM
-
2026-06-13days on market $158,000 Active 225 DOM
-
2026-06-09days on market $158,000 Active 221 DOM
-
2026-06-08days on market $158,000 Active 220 DOM
-
2026-06-07days on market $158,000 Active 219 DOM
-
2026-06-04days on market $158,000 Active 216 DOM
-
2026-06-03days on market $158,000 Active 215 DOM
-
2026-06-02days on market $158,000 Active 214 DOM
-
2026-06-02days on market $158,000 Active 213 DOM
-
2026-05-31days on market $158,000 Active 212 DOM
-
2025-10-31$158,000 New 381-char remark
Show marketing remark (381 chars)
Welcome home to this beautiful 2023 manufactured home on a generous 0.236-acre lot in Cypress Lake Gardens! With room to add a garage, carport, shop, or RV parking, the possibilities are endless. Spend time outdoors at the neighborhood park and playground, and enjoy the convenient location near US-281, shopping, and dining. A versatile property in a prime location-don't miss it!
-
2025-10-20historical $1,300
-
2025-10-17historical
-
2025-09-29status Pending
-
2025-09-26historical
-
2025-08-08price $1,300
-
2025-05-26price $1,450
-
2025-04-22$1,650
-
2025-04-22historical $1,650
-
2025-04-20$1,650
-
2025-04-19$158,000 New
-
2025-04-19$158,000 Active
-
2025-04-04historical
-
2025-04-04historical
-
2025-03-12status Active
-
2025-03-12status Active
-
2025-03-12status Back on Market
-
2025-03-09status Pending
-
2025-03-09status Pending
-
2025-03-09status Pending
-
2025-03-05historical Active Under Contract
-
2025-03-05historical Active Under Contract
-
2025-03-05historical Active Option
-
2024-10-23price $158,900
-
2024-10-23price $158,900
-
2024-10-22Active
-
2024-09-13$159,900 New
-
2024-09-13$159,900 Active
-
2024-09-09historical
-
2024-08-17price $169,999
-
2024-08-02price $174,799
-
2024-08-01status Back on Market
-
2024-07-31historical
-
2024-07-31historical
-
2024-07-12price $174,899
-
2024-07-12price $174,899
-
2024-06-10status Active
ⓘ Source: listings_history table (triggers on properties + properties_extension) + one-shot
backfill from property_details.listing_events for pre-trigger history.
Tax reassessment forecast TX · Resets to sale price
- Current annual tax
- $733 · $61/mo
- Projected year-2 tax
- $2,891 · $241/mo
- Expected delta
- +$2,159/yr (+$180/mo · 294.6%)
ⓘ Screening estimate from a state-policy table — verify with the county assessor before closing.
Climate risk First Street
- Flood 1/10 Low FEMA zone X (unshaded) · 0% chance over 30 yrs
- Wildfire 5/10 Major
- Heat 7/10 Severe 7 d/yr ≥107°F today · 22 d/yr by 30 yrs out
- Wind 6/10 Major 68% chance of damaging wind over 30 yrs
- Air quality 2/10 Low 1 unhealthy d/yr today · 1 by 30 yrs out
Nearby sold comps map
Loading sold comps map…
Walkable amenities ~0.75 mi
Loading nearby amenities…
Taxation est. · year 1
- Rental income
- $22,275
- − Mortgage interest
- −$8,850
- − Property taxes
- −$733
- − Insurance
- −$790
- − Repairs & maintenance
- −$1,782
- − Management
- −$1,782
- − HOA
- −$60
- − Depreciation
- −$4,596
- Taxable income
- $3,682
- Est. tax owed @ 24.0%
- −$884
- After-tax cash flow
- $5,188/yr
For passive investors: Depreciation is non-cash, so a rental often shows a tax loss while cash-flowing — sheltering income. Rental losses are passive: they offset passive income freely, and up to $25,000/yr can offset ordinary (W-2) income if you actively participate and your MAGI is under $100k (phasing out to $0 by $150k); unused losses carry forward. On sale, claimed depreciation is recaptured at up to 25%, and gains may owe capital-gains tax (a 1031 exchange can defer both). Figures are a year-1 estimate at your 24.0% rate — not tax advice; consult a CPA.
Schools (NCES district)
- District
- Comal ISD
- NCES district ID
- 4814730
- Math proficiency
- 57% ▼ -9.00%
- Reading proficiency
- 59% ▼ -2.00%
- Median HH income
- $74,792
- Composite
- 51.79/100
- National rank
- #1671
- State rank
- #58 of 826 in TX
Livability — Canyon Lake
- Score
- 67/100
- State rank
- #534
- US rank
- #10441
Category grades
Schools grade is shown separately in the Schools card above.
Census & demographics
- Census place
- Canyon Lake, TX
- County
- Comal County · 206,262 people
- City population
- 42,159
- Metro
- San Antonio-New Braunfels, TX
- Population (ZIP)
- 20,200
- Household income
- $115,175
- Rent vs Own
- Severe rent burden
- 73.0
Population outlook (Comal County) Hauer SSP2
- Today (2025)
- 175,637 people
- By 2030
- 199,911 · +13.8%
- By 2040
- 249,436 · +42.0%
- By 2050
- 299,430 · +70.5%
- By 2075
- 423,857 · +141.3%
- By 2100
- 512,048 · +191.5%
Race, ethnicity, and origin ACS 2023
- Neighborhood character
- Predominantly White (70%)
- Race & ethnicity
- White 70% Hispanic / Latino 22% Two or more races 12% Black 3%
- Hispanic origin (detail)
- Mexican 19%
- Common ancestry
- Lithuanian 3% Romanian 3% Slovak 2%
- Foreign-born
- 6% · Canada
- Languages at home
- 89% English-only · Spanish 10% French/Haitian/Cajun 1%
Political lean MEDSL · Comal
- 2024 margin
- Solid R (+45.5) · D 26.8% · R 72.2%
- 2008→2024 swing
- +1.9pp toward D · 2008: -47.4pp · 2024: -45.5pp
- All cycles
- 2024: R+45.5 2020: R+42.7 2016: R+50.1 2012: R+54.1 2008: R+47.4
Not yet ingested
- Civics
- —
Market trends
- HPI YoY
- ▼ -61.35%
- Current HPI
- 233.2875
- Rent YoY
- —
- Metro
- San Antonio-New Braunfels, TX
- State GDP YoY
- ▲ 3.95%
- F500 in state
- 110
Industry mix (Fortune 500 HQ in TX)
| Industry | F500 HQs | Revenue |
|---|---|---|
| Energy | 16 | $1,198B |
|
||
| Technology | 5 | $198B |
|
||
| Engineering / Construction | 4 | $72B |
|
||
| Energy Services | 3 | $60B |
|
||
| Utilities | 3 | $41B |
|
||
| Healthcare | 2 | $330B |
|
||
Price history
+364.7% since first listed47 events — show timeline
- 2025-10-31 Listed $158,000 LERA
- 2025-10-20 Rental Removed $1,300 CTXMLS
- 2025-10-17 Listing Removed — LERA
- 2025-09-29 Pending — CTXMLS
- 2025-09-26 Listing Removed — CTXMLS
- 2025-08-08 Price Changed $1,300 CTXMLS
- 2025-05-26 Price Changed $1,450 CTXMLS
- 2025-04-22 Listed for Rent $1,650 CTXMLS
- 2025-04-22 Rental Removed $1,650 SABOR
- 2025-04-20 Listed for Rent $1,650 SABOR
- 2025-04-19 Listed $158,000 LERA
- 2025-04-19 Listed $158,000 CTXMLS
- 2025-04-04 Listing Removed — LERA
- 2025-04-04 Listing Removed — CTXMLS
- 2025-03-12 Relisted — Unlock MLS
- 2025-03-12 Relisted — CTXMLS
- 2025-03-12 Relisted — LERA
- 2025-03-09 Pending — Unlock MLS
- 2025-03-09 Pending — CTXMLS
- 2025-03-09 Pending — LERA
- 2025-03-05 Contingent — Unlock MLS
- 2025-03-05 Contingent — CTXMLS
- 2025-03-05 Contingent — LERA
- 2024-10-23 Price Changed $158,900 LERA
- 2024-10-23 Price Changed $158,900 CTXMLS
- 2024-10-22 Listed — Unlock MLS
- 2024-09-13 Listed $159,900 LERA
- 2024-09-13 Listed $159,900 CTXMLS
- 2024-09-09 Listing Removed — LERA
- 2024-08-17 Price Changed $169,999 LERA
- 2024-08-02 Price Changed $174,799 LERA
- 2024-08-01 Relisted — LERA
- 2024-07-31 Listing Removed — LERA
- 2024-07-31 Listing Removed — CTXMLS
- 2024-07-12 Price Changed $174,899 LERA
- 2024-07-12 Price Changed $174,899 CTXMLS
- 2024-06-10 Relisted — CTXMLS
- 2024-06-10 Relisted — LERA
- 2024-05-31 Contingent — CTXMLS
- 2024-05-31 Contingent — LERA
- 2024-03-27 Price Changed $174,999 LERA
- 2024-03-27 Price Changed $174,999 CTXMLS
- 2024-03-07 Listed $179,999 CTXMLS
- 2024-02-01 Listed $179,999 LERA
- 2022-06-03 Pending — CTXMLS
- 2022-06-01 Listed $34,000 CTXMLS
- 1986-05-23 Sold (Public Records) — Public Records
Property tax history
+15.5%/yrLatest (2026): $733 · -13.2% YoY. Source: county tax records.
Cash-flow waterfall
monthlySold comps — $/sqft
last 12 mo · ≤1 miLoading sold comps…