9301 SE 61st Dr · Taylor Creek, FL
Flood risk 1/10 · Minimal
- FEMA flood zone
- X (unshaded)
- Chance of flooding over 30 yrs
- 0.0%
- Est. flood insurance / yr
- $507 – $1,088
Fire risk 4/10 · Minor
- Est. fire insurance / yr
- $947 – $1,759
Heat risk 9/10 · Severe
- Hot days now (above 107°F)
- 7 days/yr
- Hot days in 30 yrs
- 24 days/yr
Wind risk 10/10 · Severe
- Chance of severe wind over 30 yrs
- 99.0%
Air-quality risk 2/10 · Minimal
- Unhealthy air days now
- 0 days/yr
- Unhealthy air days in 30 yrs
- 1 days/yr
Risk factors via First Street. Map © Google.
Why this score? — see what drove the C grade
The composite is a weighted blend of 9 inputs, each scored 0–100. Each bar is that input's sub-score; the figure is the points it added to the 100-point composite (weight × sub-score).
- Cash flow +24.7/30.0
- ARV discount +9.5/15.0
- DSCR +8.0/10.0
- 1% rule +6.2/10.0
- Schools +3.6/10.0
- Livability +2.8/5.0
- Rent growth +2.5/5.0
- Condition / age +2.5/5.0
- Appreciation +0.0/10.0
$125,000
🖨 Deal sheet (PDF) 📄 Offer letter ✓ Due diligence
Listing remarks MLS
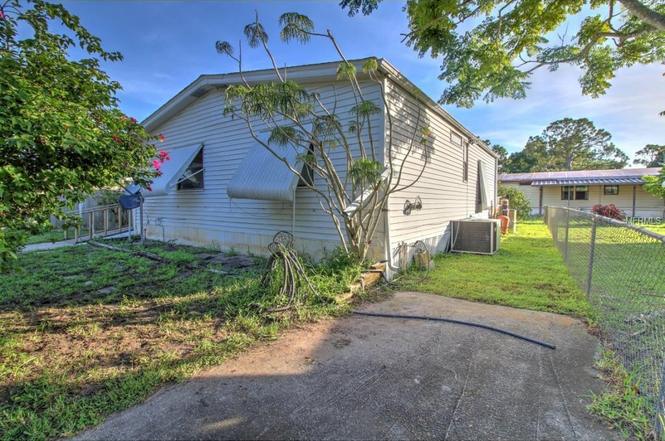
Cute 2 Bedroom, 2 Bathroom DWMH in Lar-Kee Lakes. Spacious Master Bedroom with Walk in Closet. 2 Storage Sheds in Back. Great Starter Home or Investment Property. Call to Schedule a Showing Today. LivestockYN = N, Land Use = RES,
Key facts
- Lakeside home
- Extra storage
- Updated bathrooms
Tags
Property features AI
Finance
- Financial info: Pets allowed with no restrictions
- HOA & community: No association amenities
Exterior
- Utilities: Well water; Water available
- Home design: Manufactured home; Single-story; Faces northwest; Resale condition
- Construction: Modular construction
- Exterior features: Entry level living area
Interior
- Kitchen: Electric range; Refrigerator
- Bedrooms: 2 bedrooms (main level)
- Flooring: Laminate flooring
- Bathrooms: 2 full bathrooms (main level)
- Heating & cooling: Central heating; Central air conditioning
- Interior features: Stacked bedroom layout
- Laundry & utility: Washer hookup; Dryer hookup
Neighborhood map
What this means for you Summary
Snapshot
- This is a 2-bed/2.0-bath manufactured listed at $125k.
Deal economics
- At list price, monthly cash flow is $262 ($3k/yr) — positive.
- The deal already cash-flows at list — no discount required.
- Meets the 1% rule at list price ($1k rent vs $125k).
- Recommended offer: $114k (9.0% below list) — sets the bar for market timing.
- Cap rate 8.8% vs local median 4.1% in Taylor Creek — top-decile yield for the area; either an underpriced asset or a hidden risk that comps aren't pricing in. Stress-test before assuming the spread holds.
Location & tenants
- Location reads 56/100 on livability (#874 in FL) — a working-class tenant base; expect higher turnover. Strengths: cost of living A+, housing A+, crime B+; Watch: schools F, amenities F, commute F.
- Okeechobee (town): math 44% / reading 42% proficiency, ranked #58 of 73 in FL (top 80%) — families likely to look elsewhere, expect single-tenant / working-renter base with shorter leases; 72% free/reduced lunch — lower-income household profile, screen leases tightly.
- Market conditions: 402 active listings in the ZIP; 1 comparable units currently listed for rent nearby; 18 units permitted in Okeechobee County in 2024 (0 in 5+ unit buildings).
- This rent runs 32% of the median local income ($53k/yr) — at the standard rent-burdened threshold; future hikes will face affordability resistance.
Forward outlook
- Local home prices are declining (-3.0%/yr); year-one equity from $864 of loan paydown is wiped out by about $4k of value loss. Plan a longer hold.
- Okeechobee County population projected at -21% by 2050 — secular population decline; favor cash flow + early exit over multi-decade hold.
Negotiation context
- It's been on market 110 days — a 9% lower offer ($114k) is reasonable based on typical stale-listing flexibility.
- 8 sale attempts since 8y ago; this cycle's ask is 7712% above the opening price — seller raised mid-cycle; expect resistance to lowballs.
- Current owner paid $40k; list at $125k implies a 212% gain — meaningful room to come down on a strong offer.
Risks & watch-outs
- Climate carrying-cost: severe wind risk, 99% chance of damaging wind over 30y; extreme-heat days projected 7→24/yr by 2055 (HVAC capex compounding) — expect insurance premiums to compound above CPI over the hold.
Questions for the listing agent
- It's been on market 110 days. Have you received any prior offers? Is the seller open to a 9% concession, seller financing, or rate buy-down credit?
- Why hasn't it sold? Are there any deal-killer items the seller is aware of (foundation, flood, title, zoning, code violations)?
- Is there a deadline driving the sale (1031 exchange, divorce, estate, relocation)? That informs how much negotiation room exists.
- Schools are F-rated, which usually means shorter tenancies and higher turnover. Who's the typical renter profile here, and what's been the actual vacancy rate?
- What's the average days-on-market for RENTAL listings here right now (not sales)? A rising rental-DOM trend means longer vacancies and softer asking-rent achievability than the comps imply.
- What's the recent tenant-quality profile in this submarket — average credit score on applications, eviction rate, late-payment / NSF rate, and stable-employment percentage? A property-management company in the area should have these aggregated.
- How much new for-sale + rental construction is in the pipeline within 1–3 miles? Heavy new supply typically softens prices + rents 12–24 months out; constrained supply supports both.
Investment metrics
- 1% rule
- 1.12% ✓
- Cap rate
- 8.81%
- Cash-on-cash
- 8.99%
- DSCR
- 1.40
- GRM
- 7.4
CMA / ARV
- ARV (on-the-fly)
- $130,816
- Comps found
- 3
Show comp detail 3 sales within ~0.75 mi
| Address | Dist | Beds/Ba | Sqft | Sold | Price | $/sf | Match |
|---|---|---|---|---|---|---|---|
| 9237 SE 60th Dr | 0.06mi | 2/2.0 | 902 (+1%) | 17mo | $80,000 | $89 | 82 |
| 8672 SE 59th Dr | 0.55mi | 2/2.0 | 926 (+3%) | 5mo | $176,000 | $190 | 64 |
| 8815 SE 57th Dr | 0.53mi | 3/2.0 (+1) | 938 (+5%) | 13mo | $137,000 | $146 | 52 |
Match score weights: distance 35% · size 25% · config 20% · recency 20%. Top-matched comps best support the ARV.
Projected returns pro-forma
-3.0% appreciation · 3.0% rent growth · sell at horizon
- IRR
- -2.7%
- Equity multiple
- 0.90×
- Total profit
- $-3,555
- Equity at exit
- $18,638
- IRR
- 7.0%
- Equity multiple
- 1.53×
- Total profit
- $18,434
- Equity at exit
- $10,808
Cash invested: $35,000 (down + closing). Projections, not guarantees.
Landlord ↔ Tenant lean methodology
- Overall (STATE)
- 87 Strongly Landlord-Friendly
- State Florida
- 87 Strongly Landlord-Friendly · R+3
- County
- — inherits STATE
- City
- — inherits STATE
ZIP-level market 34974
- Home prices YoY
- -15.6%
- Active inventory
- 402
- Price-to-rent
- 7.4×
Monthly cashflow live
- Estimated rent
- $1,400 medium interval (Pro) →
- Mortgage (P&I)
- −$656
- Tax from tax record
- −$136 /mo · $1,634/yr
- Insurance
- −$52
- HOA
- −$0
- Vacancy / Maint / Mgmt
- −$294
- Net cashflow
- $262
Break-even live
Sensitivity live
| Price | -10% $333 | -5% $297 | +0% $262 | +5% $227 | +10% $191 |
|---|---|---|---|---|---|
| Rent | -10% $151 | -5% $207 | +0% $262 | +5% $317 | +10% $373 |
| Rate | -1.0pp $325 | -0.5pp $294 | base $262 | +0.5pp $230 | +1.0pp $197 |
UW: 25.0% down · 7.5% · 30yr · 1.5% tax · 5.0% vac · 8.0% maint · 8.0% mgmt
Financing live
Cash to close
- Down payment
- $31,250
- Closing costs
- $3,750
- Reserves months
- —
- Total cash needed
- —
Loan-product check · same deal, 3 products live
Conventional
25% down · 7.5% · 30yr
- Down + closing
- —
- Monthly P&I
- —
- Monthly cashflow
- —
- DSCR
- —
- Eligible?
- —
Personal DTI + credit; lowest rate.
DSCR
20% down · 8.5% · 30yr
- Down + closing
- —
- Monthly P&I
- —
- Monthly cashflow
- —
- DSCR
- —
- Eligible?
- —
No personal income docs; deal must DSCR.
Hard money
10% down · 12.0% · 12mo
- Down + closing
- —
- Monthly P&I
- —
- Monthly cashflow
- —
- DSCR
- —
- Eligible?
- —
Short-term bridge; refi at stabilization.
Rent comps 1 comps
| Address | Beds | Baths | Sqft | Rent | $/sqft | DOM | Units | Dist |
|---|---|---|---|---|---|---|---|---|
| 9301 SE 61st Dr Okeechobee, FL | 2.0 | 2.0 | 896 | $1,550 | $1.73 | 24d | 1 | 0.03mi |
Listing history 15 events
-
2026-04-16price $1,550
-
2026-04-09$1,600
-
2026-04-09historical $1,600
-
2026-03-03$1,600
-
2026-02-05$125,000 Active
-
2025-11-19historical $1,600
-
2025-10-26$1,600
-
2025-10-26historical $1,800
-
2025-10-12$1,800
-
2025-10-12historical $1,800
-
2025-09-05$1,800
-
2024-01-22historical $1,500
-
2024-01-05$1,500
-
2018-07-25soldstatus $40,000 229-char remark
Show marketing remark (229 chars)
Cute 2 Bedroom, 2 Bathroom DWMH in Lar-Kee Lakes. Spacious Master Bedroom with Walk in Closet. 2 Storage Sheds in Back. Great Starter Home or Investment Property. Call to Schedule a Showing Today. LivestockYN = N, Land Use = RES,
-
2018-06-27$42,000 229-char remark
Show marketing remark (229 chars)
Cute 2 Bedroom, 2 Bathroom DWMH in Lar-Kee Lakes. Spacious Master Bedroom with Walk in Closet. 2 Storage Sheds in Back. Great Starter Home or Investment Property. Call to Schedule a Showing Today. LivestockYN = N, Land Use = RES,
ⓘ Source: listings_history table (triggers on properties + properties_extension) + one-shot
backfill from property_details.listing_events for pre-trigger history.
Tax reassessment forecast FL · Resets to sale price
- Current annual tax
- $1,634 · $136/mo
- Projected year-2 tax
- $1,634 · $136/mo
- Expected delta
- $0/yr ($0/mo · 0.0%)
ⓘ Screening estimate from a state-policy table — verify with the county assessor before closing.
Climate risk First Street
- Flood 1/10 Low FEMA zone X (unshaded) · 0% chance over 30 yrs
- Wildfire 4/10 Moderate
- Heat 9/10 Extreme 7 d/yr ≥107°F today · 24 d/yr by 30 yrs out
- Wind 10/10 Extreme 99% chance of damaging wind over 30 yrs
- Air quality 2/10 Low 0 unhealthy d/yr today · 1 by 30 yrs out
Nearby sold comps map
Loading sold comps map…
Walkable amenities ~0.75 mi
Loading nearby amenities…
Taxation est. · year 1
- Rental income
- $16,798
- − Mortgage interest
- −$7,002
- − Property taxes
- −$1,634
- − Insurance
- −$625
- − Repairs & maintenance
- −$1,344
- − Management
- −$1,344
- − Depreciation
- −$3,636
- Taxable income
- $1,213
- Est. tax owed @ 24.0%
- −$291
- After-tax cash flow
- $2,854/yr
For passive investors: Depreciation is non-cash, so a rental often shows a tax loss while cash-flowing — sheltering income. Rental losses are passive: they offset passive income freely, and up to $25,000/yr can offset ordinary (W-2) income if you actively participate and your MAGI is under $100k (phasing out to $0 by $150k); unused losses carry forward. On sale, claimed depreciation is recaptured at up to 25%, and gains may owe capital-gains tax (a 1031 exchange can defer both). Figures are a year-1 estimate at your 24.0% rate — not tax advice; consult a CPA.
Schools (NCES district)
- District
- Okeechobee
- NCES district ID
- 1201410
- Math proficiency
- 44% ▼ -12.00%
- Reading proficiency
- 42% ▼ -4.00%
- Median HH income
- $36,710
- Composite
- 35.73/100
- National rank
- #4855
- State rank
- #58 of 73 in FL
Livability — Taylor Creek
- Score
- 56/100
- State rank
- #874
- US rank
- #23017
Category grades
Schools grade is shown separately in the Schools card above.
Census & demographics
- County
- Okeechobee County · 23,975 people
- Metro
- Okeechobee, FL
- Population (ZIP)
- 23,975
- Household income
- $53,013
- Rent vs Own
- Severe rent burden
- 399.0
Population outlook (Okeechobee County) Hauer SSP2
- Today (2025)
- 37,273 people
- By 2030
- 35,885 · -3.7%
- By 2040
- 32,931 · -11.6%
- By 2050
- 29,433 · -21.0%
- By 2075
- 19,607 · -47.4%
- By 2100
- 11,814 · -68.3%
Race, ethnicity, and origin ACS 2023
- Neighborhood character
- Predominantly White (74%)
- Race & ethnicity
- White 74% Hispanic / Latino 19% Two or more races 8% Asian 2% Black 2% Native American 1%
- Hispanic origin (detail)
- Mexican 12% Puerto Rican 1% Cuban 2%
- Common ancestry
- Lithuanian 2% Iranian 2% Italian 2%
- Foreign-born
- 11% · Canada, Jamaica
- Languages at home
- 81% English-only · Spanish 16% French/Haitian/Cajun 1% Other Indo-European 1%
Political lean MEDSL · Okeechobee
- 2024 margin
- Solid R (+53.8) · D 22.9% · R 76.7%
- 2008→2024 swing
- -34.6pp toward R · 2008: -19.2pp · 2024: -53.8pp
- All cycles
- 2024: R+53.8 2020: R+44.4 2016: R+39.5 2012: R+20.0 2008: R+19.2
Not yet ingested
- Civics
- —
Market trends
- HPI YoY
- ▼ -64.47%
- Current HPI
- 348.6692
- Rent YoY
- —
- Metro
- Okeechobee, FL
- State GDP YoY
- ▲ 3.28%
- F500 in state
- 36
Industry mix (Fortune 500 HQ in FL)
| Industry | F500 HQs | Revenue |
|---|---|---|
| Industrial Technology | 2 | $29B |
|
||
| Insurance | 2 | $17B |
|
||
| Retail | 1 | $60B |
|
||
| Technology Distribution | 1 | $58B |
|
||
| Homebuilding | 1 | $35B |
|
||
| Technology Manufacturing | 1 | $35B |
|
||
Price history
-96.3% since first listed15 events — show timeline
- 2026-04-16 Price Changed $1,550 RMLSFL
- 2026-04-09 Listed for Rent $1,600 RMLSFL
- 2026-04-09 Rental Removed $1,600 GFLMLS
- 2026-03-03 Listed for Rent $1,600 GFLMLS
- 2026-02-05 Listed $125,000 Beaches MLS
- 2025-11-19 Rental Removed $1,600 RMLSFL
- 2025-10-26 Listed for Rent $1,600 RMLSFL
- 2025-10-26 Rental Removed $1,800 GFLMLS
- 2025-10-12 Listed for Rent $1,800 GFLMLS
- 2025-10-12 Rental Removed $1,800 RMLSFL
- 2025-09-05 Listed for Rent $1,800 RMLSFL
- 2024-01-22 Rental Removed $1,500 GFLMLS
- 2024-01-05 Listed for Rent $1,500 GFLMLS
- 2018-07-25 Sold (MLS) $40,000 Stellar MLS as Distributed by MLS Grid
- 2018-06-27 Listed $42,000 Stellar MLS as Distributed by MLS Grid
Property tax history
+14.3%/yrLatest (2025): $1,634 · +5.6% YoY. Source: county tax records.
Cash-flow waterfall
monthlySold comps — $/sqft
last 12 mo · ≤1 miLoading sold comps…