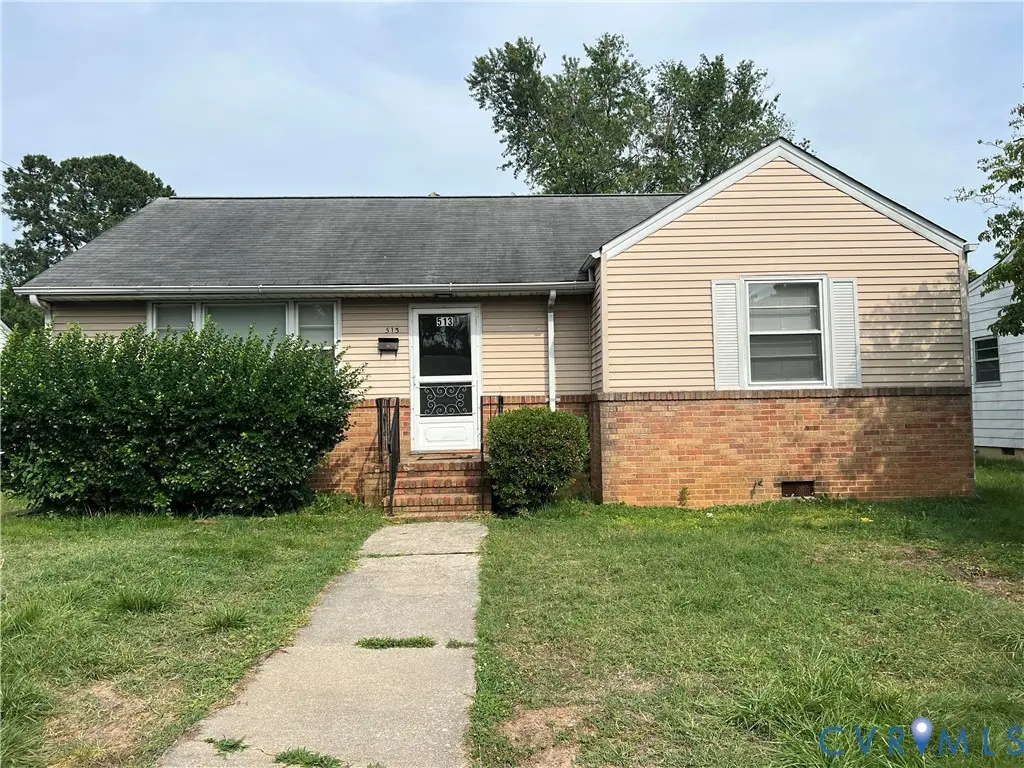
513 Pinehurst Ave · Colonial Heights, VA
Flood risk 1/10 · Minimal
- FEMA flood zone
- X (unshaded)
- Chance of flooding over 30 yrs
- 0.0%
- Est. flood insurance / yr
- $507 – $1,088
Fire risk 1/10 · Minimal
- Est. fire insurance / yr
- $666 – $1,236
Heat risk 8/10 · Major
- Hot days now (above 108°F)
- 7 days/yr
- Hot days in 30 yrs
- 16 days/yr
Wind risk 6/10 · Moderate
- Chance of severe wind over 30 yrs
- 42.0%
Air-quality risk 2/10 · Minimal
- Unhealthy air days now
- 0 days/yr
- Unhealthy air days in 30 yrs
- 1 days/yr
Risk factors via First Street. Map © Google.
Why this score? — see what drove the C- grade
The composite is a weighted blend of 9 inputs, each scored 0–100. Each bar is that input's sub-score; the figure is the points it added to the 100-point composite (weight × sub-score).
- ARV discount +15.0/15.0
- Cash flow +13.2/30.0
- Schools +4.9/10.0
- Rent growth +4.4/5.0
- DSCR +4.0/10.0
- Livability +3.7/5.0
- 1% rule +3.3/10.0
- Condition / age +2.5/5.0
- Appreciation +0.0/10.0
$189,500
🖨 Deal sheet (PDF) 📄 Offer letter ✓ Due diligence
Listing remarks
Investment Special!!!! This 3 bedroom 1 full bath in Colonial Heights and in the Tussing school district is perfect for an investor to add to their portfolio! This home is Sold as Is and will not go FHA or VA. The location is convenient to schools, interstates, shopping, dining, doctors and so much more!!!
Key facts
- 0.32 acre lot
- Built 1956
- Listed 6 days
Property features AI
Finance
- Other: Lot size approximately 0.32 acres; Assessed value provided but excluded from detailed listing
- Financial info: Financial details not provided
- HOA & community: HOA details not provided
Exterior
- Parking: Parking details not provided
- Security: Security details not provided
- Utilities: Public water; Public sewer
- Home design: One-story home; Above-grade finished living area 1,108; Frame construction
- Construction: Frame construction; Composition roof; Built (actual year not specified)
- Exterior features: Lot zoned R2
Interior
- Kitchen: Kitchen details not provided
- Bedrooms: Bedrooms not specified
- Flooring: Flooring details not provided
- Bathrooms: 1 full bathroom
- Heating & cooling: Electric heating; Electric cooling
- Interior features: Total of 6 rooms; Resale condition
- Laundry & utility: Laundry and utility details not provided
Neighborhood map
What this means for you Summary
Snapshot
- This is a 3-bed/1.0-bath single-family listed at $190k.
Deal economics
- At list price, monthly cash flow is $-4 ($-44/yr) — negative.
- To cash-flow at today's rent, offer at most $189k (0.3% below list).
- To meet the 1% rule (rent ≥ 1% of price), the offer needs to be $157k (17.2% below list).
- Recommended offer: $157k (17.2% below list) — sets the bar for 1% rule.
- Cap rate 6.3% vs local median 4.2% in Colonial Heights — top-decile yield for the area; either an underpriced asset or a hidden risk that comps aren't pricing in. Stress-test before assuming the spread holds.
Location & tenants
- Location reads 74/100 on livability (#146 in VA, #4,726 nationally) — a middle-class / working-renter tenant base. Strengths: cost of living A+, housing A+, health & safety A+; Watch: employment C-, amenities D, crime F.
- Colonial Heights City Public School District (suburban): math 52% / reading 64% proficiency, ranked #67 of 131 in VA (top 51%) — acceptable for families but not a draw, mixed tenant base, ~2y average lease.
- Zoned schools: Tussing Elementary (math 58% / reading 71%, grade B, #416 of 1,108 statewide, top 41%, 623 students, 84% FRL); Colonial Heights Middle (math 49% / reading 64%, grade B, #184 of 342 statewide, top 54%, 598 students, 86% FRL); Colonial Heights High (math 82% / reading 77%, grade A-, #63 of 319 statewide, top 22%, 876 students, 85% FRL) — zoned schools average 85% FRL vs 37% district-wide (48 pts higher); higher-poverty schools than district average — tighter screening recommended.
- Market conditions: Rents rising fast (+7.5%/yr); 126 active listings in the ZIP; 18 comparable units currently listed for rent nearby; rentals at typical pace (median 19d on market — plan ~3-4 weeks tenant-placement turnaround); solid renter incomes; 17 units permitted in Colonial Heights city in 2024 (0 in 5+ unit buildings).
Forward outlook
- Local home prices are declining (-3.0%/yr); year-one equity from $1k of loan paydown is wiped out by about $6k of value loss. Plan a longer hold.
- Colonial Heights County population projected at +15% by 2050 — long-run rental-demand tailwind backs the buy-and-hold thesis.
Negotiation context
- Only 6 days on market — expect competitive offers; lowballing is unlikely to land.
- Current owner paid $13k; list at $190k implies a 1306% gain — meaningful room to come down on a strong offer.
Risks & watch-outs
- Watch-outs: built in 1956 — expect roof / HVAC / electrical / plumbing capex.
- Climate carrying-cost: major wind risk, 42% chance of damaging wind over 30y; extreme-heat days projected 7→16/yr by 2055 (HVAC capex compounding) — expect insurance premiums to compound above CPI over the hold.
Questions for the listing agent
- What do current leases actually rent for vs. the listed asking? Can we see a recent rent roll and the last 12 months of T-12 income?
- Built in 1956 — when were the roof, HVAC, electrical panel, plumbing, and water heater last replaced?
- Is there a deadline driving the sale (1031 exchange, divorce, estate, relocation)? That informs how much negotiation room exists.
- Schools are A-rated — typically a magnet for longer-tenancy family renters. What's the average tenant stay here, and is there a school-zone premium baked into asking?
- Crime grade is F in this area — have there been break-ins, vandalism, or insurance claims at this property in the last 3 years? What carrier currently insures it and at what premium?
- What's the average days-on-market for RENTAL listings here right now (not sales)? A rising rental-DOM trend means longer vacancies and softer asking-rent achievability than the comps imply.
- What's the recent tenant-quality profile in this submarket — average credit score on applications, eviction rate, late-payment / NSF rate, and stable-employment percentage? A property-management company in the area should have these aggregated.
- How much new for-sale + rental construction is in the pipeline within 1–3 miles? Heavy new supply typically softens prices + rents 12–24 months out; constrained supply supports both.
Investment metrics
- 1% rule
- 0.83% ✗
- Cap rate
- 6.27%
- Cash-on-cash
- -0.08%
- DSCR
- 1.00
- GRM
- 10.1
CMA / ARV
- ARV (on-the-fly)
- $238,220
- Comps found
- 12
Show comp detail 12 sales within ~0.75 mi
| Address | Dist | Beds/Ba | Sqft | Sold | Price | $/sf | Match |
|---|---|---|---|---|---|---|---|
| 607 Pinehurst Ave | 0.12mi | 3/1.0 | 1,061 (-4%) | 12mo | $247,000 | $233 | 78 |
| 525 Roslyn Ave | 0.18mi | 3/1.5 | 1,025 (-8%) | 11mo | $220,000 | $215 | 68 |
| 231 Cameron Ave | 0.51mi | 2/1.0 (-1) | 1,078 (-3%) | 6mo | $210,000 | $195 | 62 |
| 500 Floral Ave | 0.38mi | 3/2.0 | 1,196 (+8%) | 4mo | $214,000 | $179 | 61 |
| 514 Chestnut Ave | 0.08mi | 3/2.0 | 1,264 (+14%) | 12mo | $309,000 | $244 | 59 |
| 817 Lafayette Ave | 0.62mi | 2/1.0 (-1) | 1,104 (-0%) | 9mo | $155,000 | $140 | 58 |
| 228 Washington Ave | 0.49mi | 3/1.5 | 999 (-10%) | 4mo | $250,000 | $250 | 55 |
| 212 Norfolk Ave | 0.75mi | 3/1.0 | 1,176 (+6%) | 4mo | $162,500 | $138 | 52 |
| 828 Miller St | 0.72mi | 4/2.0 (+1) | 1,072 (-3%) | 8mo | $142,500 | $133 | 45 |
| 914 Kensington | 0.52mi | 2/1.0 (-1) | 973 (-12%) | 7mo | $210,000 | $216 | 44 |
| 231 Lafayette Ave | 0.58mi | 2/1.0 (-1) | 984 (-11%) | 9mo | $150,000 | $152 | 42 |
| 306 Richmond Ave | 0.74mi | 3/2.0 | 1,232 (+11%) | 13mo | $285,000 | $231 | 32 |
Match score weights: distance 35% · size 25% · config 20% · recency 20%. Top-matched comps best support the ARV.
Projected returns pro-forma
-3.0% appreciation · 7.5% rent growth · sell at horizon
- IRR
- -11.8%
- Equity multiple
- 0.56×
- Total profit
- $-23,536
- Equity at exit
- $28,255
- IRR
- 2.8%
- Equity multiple
- 1.24×
- Total profit
- $12,561
- Equity at exit
- $16,384
Cash invested: $53,060 (down + closing). Projections, not guarantees.
Landlord ↔ Tenant lean methodology
- Overall (STATE)
- 55 Moderately Landlord-Leaning
- State Virginia
- 55 Moderately Landlord-Leaning · D+2
- County
- — inherits STATE
- City
- — inherits STATE
ZIP-level market 23834
- Rents YoY
- 7.5%
- Active inventory
- 126
- Price-to-rent
- 10.1×
Monthly cashflow live
- Estimated rent
- $1,568 high interval (Pro) →
- Mortgage (P&I)
- −$994
- Tax from tax record
- −$170 /mo · $2,039/yr
- Insurance
- −$79
- HOA
- −$0
- Vacancy / Maint / Mgmt
- −$329
- Net cashflow
- $-4
Break-even live
Sensitivity live
| Price | -10% $104 | -5% $50 | +0% $-4 | +5% $-57 | +10% $-111 |
|---|---|---|---|---|---|
| Rent | -10% $-128 | -5% $-66 | +0% $-4 | +5% $58 | +10% $120 |
| Rate | -1.0pp $92 | -0.5pp $45 | base $-4 | +0.5pp $-53 | +1.0pp $-103 |
UW: 25.0% down · 7.5% · 30yr · 1.5% tax · 5.0% vac · 8.0% maint · 8.0% mgmt
Financing live
Cash to close
- Down payment
- $47,375
- Closing costs
- $5,685
- Reserves months
- —
- Total cash needed
- —
Loan-product check · same deal, 3 products live
Conventional
25% down · 7.5% · 30yr
- Down + closing
- —
- Monthly P&I
- —
- Monthly cashflow
- —
- DSCR
- —
- Eligible?
- —
Personal DTI + credit; lowest rate.
DSCR
20% down · 8.5% · 30yr
- Down + closing
- —
- Monthly P&I
- —
- Monthly cashflow
- —
- DSCR
- —
- Eligible?
- —
No personal income docs; deal must DSCR.
Hard money
10% down · 12.0% · 12mo
- Down + closing
- —
- Monthly P&I
- —
- Monthly cashflow
- —
- DSCR
- —
- Eligible?
- —
Short-term bridge; refi at stabilization.
Rent comps 18 comps
| Address | Beds | Baths | Sqft | Rent | $/sqft | DOM | Units | Dist |
|---|---|---|---|---|---|---|---|---|
| 500 Floral Ave Colonial Heights, VA | 3.0 | 2.0 | 1196 | $1,895 | $1.58 | 25d | 1 | 0.38mi |
| 147 Witten St Petersburg, VA | 3.0 | 1.0 | 1170 | $1,495 | $1.28 | 12d | 1 | 0.50mi |
| 815 Floral Ave Colonial Heights, VA | 3.0 | 1.0 | 908 | $1,500 | $1.65 | 22d | 1 | 0.50mi |
| 707 Hamilton Ave Colonial Heights, VA | 2.0 | 1.0 | 999 | $1,325 | $1.33 | 13d | 1 | 0.53mi |
| 114 Lee Ave Colonial Heights, VA | 2.0 | 1.5 | 1088 | $1,750 | $1.61 | 25d | 1 | 0.71mi |
| 1118 Jett Ave Colonial Heights, VA | 2.0 | 1.0 | 780 | $1,400 | $1.79 | 13d | 1 | 0.84mi |
| 250 E Bank St Petersburg, VA | 2.0 | 1.0–2.0 | 862 | $1,509 | $1.75 | 3d | 19 | 0.85mi |
| 406 Bradsher Ave Unit A Colonial Heights, VA | 2.0 | 1.0 | 940 | $1,050 | $1.12 | 25d | 1 | 1.02mi |
| 30 Franklin St Petersburg, VA | 2.0 | 1.0–2.0 | 755 | $1,550 | $2.05 | 21d | 1 | 1.11mi |
| 212 E Wythe St Unit 1 Petersburg, VA | 4.0 | 1.5 | 1400 | $1,295 | $0.93 | 45d | 1 | 1.18mi |
| 212 E Wythe St Unit 1 Petersburg, VA | 4.0 | 1.5 | 1400 | $1,295 | $0.93 | 25d | 1 | 1.18mi |
| 9 S Market St Petersburg, VA | 1.0–2.0 | 1.0–2.0 | 721 | $1,350 | $1.87 | 19d | 6 | 1.31mi |
| 1500 Concord Ave Unit 02 02 Colonial Heights, VA | 2.0 | 1.5 | 915 | $1,300 | $1.42 | 3d | 1 | 1.31mi |
| 1400 Branders Bridge Rd Colonial Heights, VA | 2.0 | 1.0–1.5 | 1034 | $1,132 | $1.09 | 3d | 1 | 1.36mi |
| 16 S Market St Petersburg, VA | 1.0–2.0 | 1.0–2.0 | 769 | $2,312 | $3.01 | 3d | 17 | 1.37mi |
| 445 Roundtop Ave Petersburg, VA | 2.0 | 1.0 | 750 | $1,050 | $1.40 | 3d | 3 | 1.44mi |
| 424 Roundtop Ave Petersburg, VA | 3.0 | 1.0 | 988 | $1,350 | $1.37 | 45d | 1 | 1.48mi |
| 109 Perry St Petersburg, VA | 1.0–2.0 | 1.0–2.0 | 787 | $1,577 | $2.00 | 4d | 15 | 1.49mi |
Listing history 4 events
-
2026-06-16statusdays on market $189,500 Pending 6 DOM
-
2026-06-15days on market $189,500 Active 5 DOM
-
2026-06-13remarks 308-char remark
-
2026-06-13$189,500 Active 3 DOM
ⓘ Source: listings_history table (triggers on properties + properties_extension) + one-shot
backfill from property_details.listing_events for pre-trigger history.
Tax reassessment forecast VA · Resets to sale price
- Current annual tax
- $2,039 · $170/mo
- Projected year-2 tax
- $2,039 · $170/mo
- Expected delta
- $0/yr ($0/mo · 0.0%)
ⓘ Screening estimate from a state-policy table — verify with the county assessor before closing.
Climate risk First Street
- Flood 1/10 Low FEMA zone X (unshaded) · 0% chance over 30 yrs
- Wildfire 1/10 Low
- Heat 8/10 Severe 7 d/yr ≥108°F today · 16 d/yr by 30 yrs out
- Wind 6/10 Major 42% chance of damaging wind over 30 yrs
- Air quality 2/10 Low 0 unhealthy d/yr today · 1 by 30 yrs out
Nearby sold comps map
Loading sold comps map…
Walkable amenities ~0.75 mi
Loading nearby amenities…
Taxation est. · year 1
- Rental income
- $18,819
- − Mortgage interest
- −$10,615
- − Property taxes
- −$2,039
- − Insurance
- −$948
- − Repairs & maintenance
- −$1,506
- − Management
- −$1,506
- − Depreciation
- −$5,513
- Taxable loss
- −$3,306
- Est. tax savings @ 24.0%
- +$793
- After-tax cash flow
- $749/yr
For passive investors: Depreciation is non-cash, so a rental often shows a tax loss while cash-flowing — sheltering income. Rental losses are passive: they offset passive income freely, and up to $25,000/yr can offset ordinary (W-2) income if you actively participate and your MAGI is under $100k (phasing out to $0 by $150k); unused losses carry forward. On sale, claimed depreciation is recaptured at up to 25%, and gains may owe capital-gains tax (a 1031 exchange can defer both). Figures are a year-1 estimate at your 24.0% rate — not tax advice; consult a CPA.
Schools (NCES district)
- District
- Colonial Heights City Public School District
- NCES district ID
- 5100960
- Math proficiency
- 52% ▼ -31.00%
- Reading proficiency
- 64% ▼ -12.00%
- Median HH income
- $50,368
- Composite
- 49.41/100
- National rank
- #2011
- State rank
- #67 of 131 in VA
Livability — Colonial Heights
- Score
- 74/100
- State rank
- #146
- US rank
- #4726
Category grades
Schools grade is shown separately in the Schools card above.
Census & demographics
- Census place
- Colonial Heights, VA
- County
- Chesterfield County · 406,988 people
- City population
- 26,628
- Metro
- Richmond, VA
- Population (ZIP)
- 26,628
- Household income
- $84,338
- Rent vs Own
- Severe rent burden
- 814.0
Population outlook (Colonial Heights County) Hauer SSP2
- Today (2025)
- 18,627 people
- By 2030
- 19,110 · +2.6%
- By 2040
- 20,215 · +8.5%
- By 2050
- 21,424 · +15.0%
- By 2075
- 24,692 · +32.6%
- By 2100
- 26,164 · +40.5%
Race, ethnicity, and origin ACS 2023
- Neighborhood character
- Majority White (63%)
- Race & ethnicity
- White 63% Black 22% Hispanic / Latino 8% Two or more races 5% Asian 3%
- Hispanic origin (detail)
- Mexican 3% Puerto Rican 3%
- Common ancestry
- Serbian 2% Slovak 2% Lithuanian 2%
- Foreign-born
- 7% · Canada, China, South Korea
- Languages at home
- 91% English-only · Spanish 5% Other Indo-European 2% Korean 1%
Political lean MEDSL · Colonial Heights
- 2024 margin
- Solid R (+32.5) · D 33.4% · R 65.8%
- 2008→2024 swing
- +8.2pp toward D · 2008: -40.7pp · 2024: -32.5pp
- All cycles
- 2024: R+32.5 2020: R+33.2 2016: R+39.3 2012: R+39.5 2008: R+40.7
Not yet ingested
- Civics
- —
Market trends
- HPI YoY
- ▼ -212.28%
- Current HPI
- 294.4478
- Rent YoY
- ▲ 7.50%
- Metro
- Richmond, VA
- State GDP YoY
- ▲ 2.40%
- F500 in state
- 50
Industry mix (Fortune 500 HQ in VA)
| Industry | F500 HQs | Revenue |
|---|---|---|
| Aerospace / Defense | 4 | $236B |
|
||
| Technology / Defense | 3 | $32B |
|
||
| Financial Services | 2 | $176B |
|
||
| Utilities | 2 | $27B |
|
||
| Insurance | 2 | $25B |
|
||
| Technology | 2 | $15B |
|
||
Price history
+1306.3% since first listed2 events — show timeline
- 2026-06-10 Listed $189,500 CVRMLS
- 1966-05-19 Sold (Public Records) $13,475 Public Records
Property tax history
+4.8%/yrLatest (2026): $2,039 · +14.8% YoY. Source: county tax records.
Cash-flow waterfall
monthlySold comps — $/sqft
last 12 mo · ≤1 miLoading sold comps…