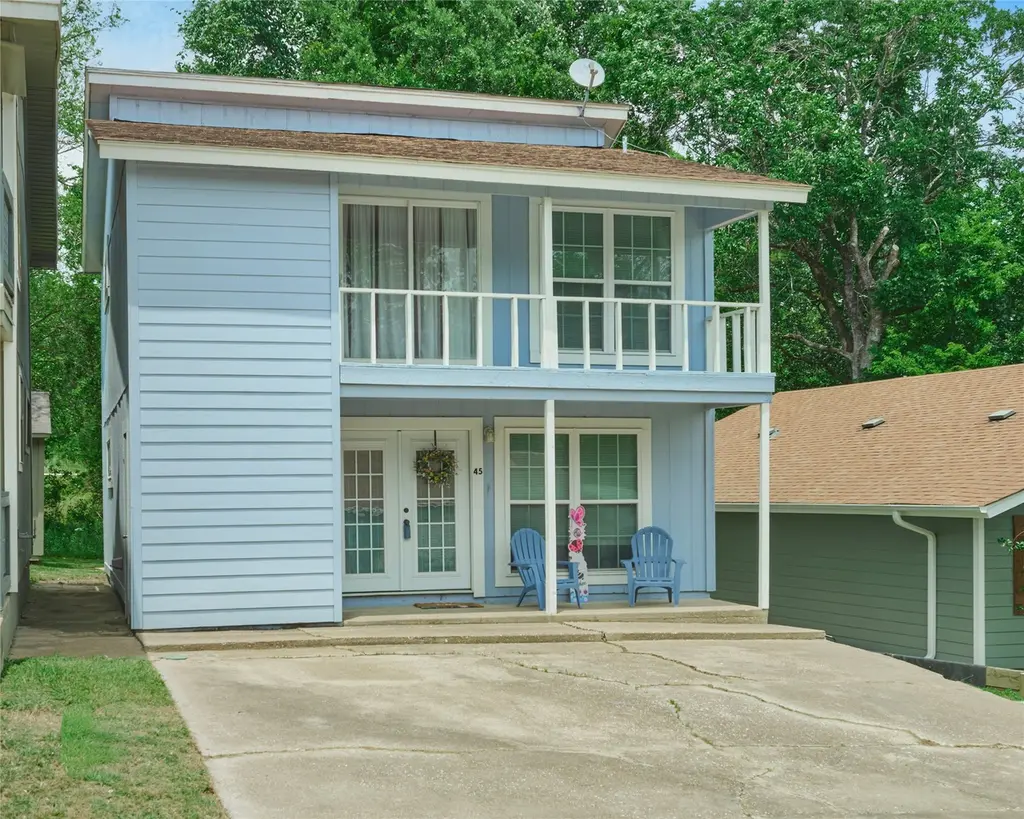
45 Harbour Row Dr · Cape Royale, TX
Flood risk 1/10 · Minimal
- FEMA flood zone
- X (unshaded)
- Chance of flooding over 30 yrs
- 0.0%
- Est. flood insurance / yr
- $507 – $1,088
Fire risk 2/10 · Minimal
- Est. fire insurance / yr
- $1,222 – $2,270
Heat risk 8/10 · Major
- Hot days now (above 111°F)
- 7 days/yr
- Hot days in 30 yrs
- 25 days/yr
Wind risk 8/10 · Major
- Chance of severe wind over 30 yrs
- 99.0%
Air-quality risk 1/10 · Minimal
- Unhealthy air days now
- 0 days/yr
- Unhealthy air days in 30 yrs
- 0 days/yr
Risk factors via First Street. Map © Google.
Why this score? — see what drove the D grade
The composite is a weighted blend of 9 inputs, each scored 0–100. Each bar is that input's sub-score; the figure is the points it added to the 100-point composite (weight × sub-score).
- ARV discount +15.0/15.0
- Cash flow +9.8/30.0
- 1% rule +2.9/10.0
- Livability +2.9/5.0
- DSCR +2.8/10.0
- Rent growth +2.5/5.0
- Condition / age +2.5/5.0
- Schools +2.0/10.0
- Appreciation +0.0/10.0
$189,000
🖨 Deal sheet (PDF) 📄 Offer letter ✓ Due diligence
Listing remarks
Step inside this charming Cape Royale home featuring 3-4 bedrooms and 2 baths. Recently updated with fresh paint, new flooring, fixtures, and windows in the front. Embrace the resort lifestyle with amenities like a boat ramp, marina, clubhouse, pool, park, playground, tennis/pickleball courts, basketball court, and picnic area. Make this your new home sweet home today!
Key facts
- Cape royale home
- Clubhouse
- Pool
Tags
Property features AI
Finance
- Financial info: Association fee amount: $702 annually
- HOA & community: Part of Cape Royale association; Association amenities include clubhouse, marina, boat ramp, basketball and sport courts, pickleball, tennis courts, playground, picnic area, trash service, security, and community pool; Annual association fee
Exterior
- Security: Controlled access
- Utilities: Public water; Public sewer
- Home design: Residential property; Built in 1980; Slab foundation; Composition roof; Concrete road access; Subdivision lot
- Construction: Construction materials: Unknown
- Exterior features: Balcony; Deck; Porch; Patio; Storage; Shed(s); Tennis court(s); Association pool
Interior
- Kitchen: Electric cooktop; Electric oven; Electric range
- Bedrooms: Total rooms: 8
- Bathrooms: 2 full bathrooms
- Heating & cooling: Central heating (electric); Central air (electric)
- Interior features: Kitchen island; Ceiling fans; Kitchen/dining combo; Programmable thermostat; Insulated doors
- Laundry & utility: Washer hookup; Electric dryer hookup
Neighborhood map
What this means for you Summary
Snapshot
- This is a 3-bed/2.0-bath single-family listed at $189k.
Deal economics
- At list price, monthly cash flow is $-120 ($-1k/yr) — negative.
- To cash-flow at today's rent, offer at most $168k (11.2% below list).
- To meet the 1% rule (rent ≥ 1% of price), the offer needs to be $150k (20.6% below list).
- Recommended offer: $150k (20.6% below list) — sets the bar for 1% rule.
- Cap rate 5.5% vs local median 2.5% in Cape Royale — top-decile yield for the area; either an underpriced asset or a hidden risk that comps aren't pricing in. Stress-test before assuming the spread holds.
Location & tenants
- Location reads 58/100 on livability (#1,203 in TX) — a working-class tenant base; expect higher turnover. Strengths: crime A, housing A, cost of living B+; Watch: amenities F, commute F, employment D-.
- Coldspring-Oakhurst CISD (rural): math 18% / reading 28% proficiency, ranked #732 of 826 in TX (top 89%) — low school quality limits family demand, transient renter base, plan for 1-2y turnover; 60% free/reduced lunch — lower-income household profile, screen leases tightly.
- Zoned schools: Street El (449 students, 70% FRL); Lincoln J H (math 14% / reading 28%, grade F, #1,387 of 1,662 statewide, top 85%, 347 students, 58% FRL); Coldspring-Oakhurst H S (math 27% / reading 37%, grade F, #1,044 of 1,632 statewide, top 66%, 496 students, 55% FRL) — zoned schools at 61% FRL track the district average.
- Market conditions: 364 active listings in the ZIP; 1 comparable units currently listed for rent nearby; 575 units permitted in San Jacinto County in 2024 (0 in 5+ unit buildings).
Forward outlook
- Local home prices are declining (-3.0%/yr); year-one equity from $1k of loan paydown is wiped out by about $6k of value loss. Plan a longer hold.
- San Jacinto County population projected at +7% by 2050 — modest demand growth; plan on rents tracking national, not racing it.
Negotiation context
- It's been on market 32 days — a 3% lower offer ($183k) is reasonable based on typical stale-listing flexibility.
Risks & watch-outs
- Climate carrying-cost: severe wind risk, 99% chance of damaging wind over 30y; extreme-heat days projected 7→25/yr by 2055 (HVAC capex compounding) — expect insurance premiums to compound above CPI over the hold.
Questions for the listing agent
- What do current leases actually rent for vs. the listed asking? Can we see a recent rent roll and the last 12 months of T-12 income?
- It's been on market 32 days. Have you received any prior offers? Is the seller open to a 21% concession, seller financing, or rate buy-down credit?
- What does the HOA fee cover, when was the last increase, and are there any pending special assessments or reserve-fund shortfalls?
- Is there a deadline driving the sale (1031 exchange, divorce, estate, relocation)? That informs how much negotiation room exists.
- The area grade is low — what's the realistic commute time and amenity access for the typical tenant pool here? Any planned neighborhood developments (good or bad) we should know about?
- What's the average days-on-market for RENTAL listings here right now (not sales)? A rising rental-DOM trend means longer vacancies and softer asking-rent achievability than the comps imply.
- What's the recent tenant-quality profile in this submarket — average credit score on applications, eviction rate, late-payment / NSF rate, and stable-employment percentage? A property-management company in the area should have these aggregated.
- How much new for-sale + rental construction is in the pipeline within 1–3 miles? Heavy new supply typically softens prices + rents 12–24 months out; constrained supply supports both.
Investment metrics
- 1% rule
- 0.79% ✗
- Cap rate
- 5.53%
- Cash-on-cash
- -2.73%
- DSCR
- 0.88
- GRM
- 10.5
CMA / ARV
- ARV (on-the-fly)
- $289,800
- Comps found
- 8
Show comp detail 8 sales within ~0.75 mi
| Address | Dist | Beds/Ba | Sqft | Sold | Price | $/sf | Match |
|---|---|---|---|---|---|---|---|
| 116 Harbour Ln | 0.04mi | 3/1.5 | 1,286 (-7%) | 2mo | $155,000 | $121 | 84 |
| 30 N Pine Harbour Dr | 0.43mi | 3/2.0 | 1,379 (-0%) | 9mo | $289,989 | $210 | 72 |
| 81 Harbour Point Cir | 0.29mi | 2/2.0 (-1) | 1,464 (+6%) | 3mo | $599,000 | $409 | 69 |
| 330 S Pine Harbour Dr | 0.34mi | 3/2.0 | 1,260 (-9%) | 2mo | $254,900 | $202 | 69 |
| 150 Piping Rock Pl | 0.48mi | 3/2.0 | 1,322 (-4%) | 23mo | $288,000 | $218 | 52 |
| 410 N Pine Harbour Dr | 0.48mi | 3/2.0 | 1,266 (-8%) | 18mo | $240,000 | $190 | 49 |
| 40 Pecan Cv | 0.71mi | 2/2.0 (-1) | 1,431 (+4%) | 9mo | $169,000 | $118 | 48 |
| 531 N Forest Cove Loop | 0.64mi | 3/2.0 | 1,176 (-15%) | 6mo | $410,000 | $349 | 40 |
Match score weights: distance 35% · size 25% · config 20% · recency 20%. Top-matched comps best support the ARV.
Projected returns pro-forma
-3.0% appreciation · 3.0% rent growth · sell at horizon
- IRR
- -20.8%
- Equity multiple
- 0.28×
- Total profit
- $-38,265
- Equity at exit
- $28,181
- IRR
- -14.1%
- Equity multiple
- 0.19×
- Total profit
- $-43,096
- Equity at exit
- $16,341
Cash invested: $52,920 (down + closing). Projections, not guarantees.
Landlord ↔ Tenant lean methodology
- Overall (STATE)
- 87 Strongly Landlord-Friendly
- State Texas
- 87 Strongly Landlord-Friendly · R+5
- County
- — inherits STATE
- City
- — inherits STATE
ZIP-level market 77331
- Active inventory
- 364
- Price-to-rent
- 10.5×
Monthly cashflow live
- Estimated rent
- $1,500 medium interval (Pro) →
- Mortgage (P&I)
- −$991
- Tax from tax record
- −$176 /mo · $2,117/yr
- Insurance
- −$79
- HOA
- −$59
- Vacancy / Maint / Mgmt
- −$315
- Net cashflow
- $-120
Break-even live
Sensitivity live
| Price | -10% $-13 | -5% $-67 | +0% $-120 | +5% $-174 | +10% $-227 |
|---|---|---|---|---|---|
| Rent | -10% $-239 | -5% $-180 | +0% $-120 | +5% $-61 | +10% $-2 |
| Rate | -1.0pp $-25 | -0.5pp $-72 | base $-120 | +0.5pp $-169 | +1.0pp $-219 |
UW: 25.0% down · 7.5% · 30yr · 1.5% tax · 5.0% vac · 8.0% maint · 8.0% mgmt
Financing live
Cash to close
- Down payment
- $47,250
- Closing costs
- $5,670
- Reserves months
- —
- Total cash needed
- —
Loan-product check · same deal, 3 products live
Conventional
25% down · 7.5% · 30yr
- Down + closing
- —
- Monthly P&I
- —
- Monthly cashflow
- —
- DSCR
- —
- Eligible?
- —
Personal DTI + credit; lowest rate.
DSCR
20% down · 8.5% · 30yr
- Down + closing
- —
- Monthly P&I
- —
- Monthly cashflow
- —
- DSCR
- —
- Eligible?
- —
No personal income docs; deal must DSCR.
Hard money
10% down · 12.0% · 12mo
- Down + closing
- —
- Monthly P&I
- —
- Monthly cashflow
- —
- DSCR
- —
- Eligible?
- —
Short-term bridge; refi at stabilization.
Rent comps 1 comps
| Address | Beds | Baths | Sqft | Rent | $/sqft | DOM | Units | Dist |
|---|---|---|---|---|---|---|---|---|
| 30 Harbour Ln Coldspring, TX | 3.0 | 2.0 | 1280 | $1,500 | $1.17 | 0d | 1 | 0.10mi |
HOA detail
- Monthly dues
- $59 · $708/yr
- Likely covers
- pool
Listing history 22 events
-
2026-06-21days on market $189,000 Active 32 DOM
-
2026-06-19days on market $189,000 Active 30 DOM
-
2026-06-18days on market $189,000 Active 29 DOM
-
2026-06-18price $189,000 Active 28 DOM
-
2026-06-17days on market $199,000 Active 28 DOM
-
2026-06-16days on market $199,000 Active 27 DOM
-
2026-06-15days on market $199,000 Active 26 DOM
-
2026-06-14days on market $199,000 Active 24 DOM
-
2026-06-13days on market $199,000 Active 23 DOM
-
2026-06-10days on market $199,000 Active 21 DOM
-
2026-06-09days on market $199,000 Active 20 DOM
-
2026-06-08days on market $199,000 Active 19 DOM
-
2026-06-07days on market $199,000 Active 18 DOM
-
2026-06-03days on market $199,000 Active 14 DOM
-
2026-06-02days on market $199,000 Active 13 DOM
-
2026-06-01days on market $199,000 Active 12 DOM
-
2026-05-31days on market $199,000 Active 11 DOM
-
2026-05-30days on market $199,000 Active 10 DOM
-
2026-05-20$199,000 Active
-
2025-11-24soldstatus
-
2018-04-27soldstatus
-
1997-02-04soldstatus
ⓘ Source: listings_history table (triggers on properties + properties_extension) + one-shot
backfill from property_details.listing_events for pre-trigger history.
Tax reassessment forecast TX · Resets to sale price
- Current annual tax
- $2,117 · $176/mo
- Projected year-2 tax
- $3,459 · $288/mo
- Expected delta
- +$1,342/yr (+$112/mo · 63.4%)
ⓘ Screening estimate from a state-policy table — verify with the county assessor before closing.
Climate risk First Street
- Flood 1/10 Low FEMA zone X (unshaded) · 0% chance over 30 yrs
- Wildfire 2/10 Low
- Heat 8/10 Severe 7 d/yr ≥111°F today · 25 d/yr by 30 yrs out
- Wind 8/10 Severe 99% chance of damaging wind over 30 yrs
- Air quality 1/10 Low 0 unhealthy d/yr today · 0 by 30 yrs out
Nearby sold comps map
Loading sold comps map…
Walkable amenities ~0.75 mi
Loading nearby amenities…
Taxation est. · year 1
- Rental income
- $18,000
- − Mortgage interest
- −$10,587
- − Property taxes
- −$2,117
- − Insurance
- −$945
- − Repairs & maintenance
- −$1,440
- − Management
- −$1,440
- − HOA
- −$708
- − Depreciation
- −$5,498
- Taxable loss
- −$4,735
- Est. tax savings @ 24.0%
- +$1,136
- After-tax cash flow
- $-307/yr
For passive investors: Depreciation is non-cash, so a rental often shows a tax loss while cash-flowing — sheltering income. Rental losses are passive: they offset passive income freely, and up to $25,000/yr can offset ordinary (W-2) income if you actively participate and your MAGI is under $100k (phasing out to $0 by $150k); unused losses carry forward. On sale, claimed depreciation is recaptured at up to 25%, and gains may owe capital-gains tax (a 1031 exchange can defer both). Figures are a year-1 estimate at your 24.0% rate — not tax advice; consult a CPA.
Schools (NCES district)
- District
- Coldspring-Oakhurst CISD
- NCES district ID
- 4814520
- Math proficiency
- 18% ▼ -9.00%
- Reading proficiency
- 28% ▼ -2.00%
- Median HH income
- $46,916
- Composite
- 20.07/100
- National rank
- #8653
- State rank
- #732 of 826 in TX
Livability — Cape Royale
- Score
- 58/100
- State rank
- #1203
- US rank
- #21032
Category grades
Schools grade is shown separately in the Schools card above.
Census & demographics
- Census place
- Cape Royale, TX
- Population (ZIP)
- 7,348
Population outlook (San Jacinto County) Hauer SSP2
- Today (2025)
- 29,069 people
- By 2030
- 29,750 · +2.3%
- By 2040
- 30,714 · +5.7%
- By 2050
- 31,010 · +6.7%
- By 2075
- 31,616 · +8.8%
- By 2100
- 29,874 · +2.8%
Race, ethnicity, and origin ACS 2023
- Neighborhood character
- Predominantly White (78%)
- Race & ethnicity
- White 78% Black 13% Two or more races 8% Hispanic / Latino 4%
- Common ancestry
- Slovak 3% Italian 2% Romanian 2%
- Foreign-born
- 3% · Canada
- Languages at home
- 94% English-only · Spanish 5% Arabic 1%
Political lean MEDSL · San Jacinto
- 2024 margin
- Solid R (+65.3) · D 17.0% · R 82.3%
- 2008→2024 swing
- -27.0pp toward R · 2008: -38.3pp · 2024: -65.3pp
- All cycles
- 2024: R+65.3 2020: R+61.9 2016: R+58.4 2012: R+48.9 2008: R+38.3
Not yet ingested
- Civics
- —
Market trends
- HPI YoY
- ▼ -146.98%
- Current HPI
- 199.0493
- Rent YoY
- —
- Metro
- —
- State GDP YoY
- ▲ 3.95%
- F500 in state
- 110
Industry mix (Fortune 500 HQ in TX)
| Industry | F500 HQs | Revenue |
|---|---|---|
| Energy | 16 | $1,198B |
|
||
| Technology | 5 | $198B |
|
||
| Engineering / Construction | 4 | $72B |
|
||
| Energy Services | 3 | $60B |
|
||
| Utilities | 3 | $41B |
|
||
| Healthcare | 2 | $330B |
|
||
Price history
4 events — show timeline
- 2026-05-20 Listed $199,000 HARMLS
- 2025-11-24 Sold (Public Records) — Public Records
- 2018-04-27 Sold (Public Records) — Public Records
- 1997-02-04 Sold (Public Records) — Public Records
Property tax history
+4.5%/yrLatest (2025): $2,117 · -1.9% YoY. Source: county tax records.
Cash-flow waterfall
monthlySold comps — $/sqft
last 12 mo · ≤1 miLoading sold comps…