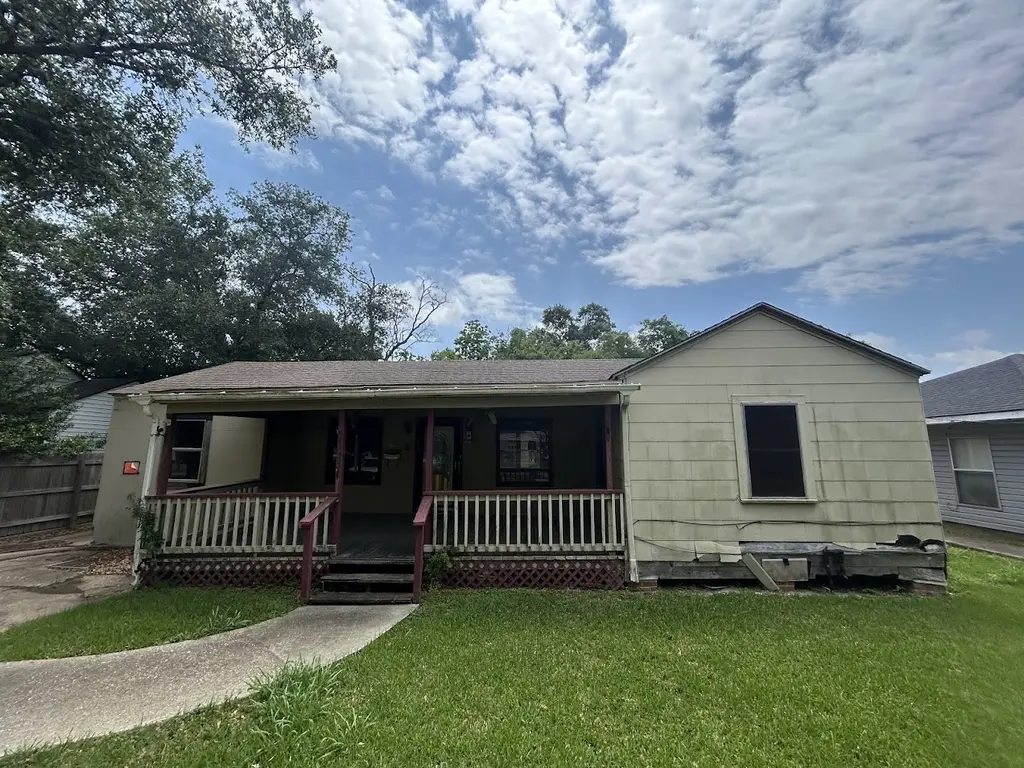
6136 25th St · Groves, TX
Flood risk 8/10 · Major
- FEMA flood zone
- X (shaded)
- Chance of flooding over 30 yrs
- 0.6%
- Est. flood insurance / yr
- $507 – $1,088
Fire risk 1/10 · Minimal
- Est. fire insurance / yr
- $1,222 – $2,270
Heat risk 9/10 · Severe
- Hot days now (above 110°F)
- 7 days/yr
- Hot days in 30 yrs
- 25 days/yr
Wind risk 9/10 · Severe
- Chance of severe wind over 30 yrs
- 99.0%
Air-quality risk 2/10 · Minimal
- Unhealthy air days now
- 1 days/yr
- Unhealthy air days in 30 yrs
- 1 days/yr
Risk factors via First Street. Map © Google.
Why this score? — see what drove the B+ grade
The composite is a weighted blend of 9 inputs, each scored 0–100. Each bar is that input's sub-score; the figure is the points it added to the 100-point composite (weight × sub-score).
- Cash flow +30.0/30.0
- ARV discount +15.0/15.0
- DSCR +10.0/10.0
- 1% rule +9.5/10.0
- Schools +3.9/10.0
- Livability +3.6/5.0
- Rent growth +2.5/5.0
- Condition / age +2.5/5.0
- Appreciation +0.0/10.0
$127,299
🖨 Deal sheet (PDF) 📄 Offer letter ✓ Due diligence
Listing remarks MLS
FIXER UPPER! Welcome to this charming 4 bedroom and 1 ½ bathroom home available just outside of Beaumont, TX. This property has approximately 1,508 Sq. Ft. of living space and features a large living room, lovely kitchen that overlooks the breakfast area, an extended covered front porch, a backyard deck area, and a wooden storage unit in the backyard. It has wooded flooring in the main areas of the home and ceramic tile in the kitchen and bathrooms. It is being sold As Is but has a lot of potential. Here you will have convenient access to TX-87 and TX-73. Downtown Beaumont and Lamar University are approximately 20 minutes away and there are tons of great local eateries, markets, and parks nearby. Sabine Lake is a very short commute away as well. WE MAKE IT EAST TO OWN. This is a great opportunity! Don't wait, call us today to get more information on the owner's easy terms and smooth process that may be able to put the deed in your name and make this your dream home.
Key facts
- Lovely kitchen
- Backyard deck area
- Wooded flooring
Tags
Neighborhood map
What this means for you Summary
Snapshot
- This is a 4-bed/1.5-bath single-family listed at $127k.
Deal economics
- At list price, monthly cash flow is $440 ($5k/yr) — positive.
- The deal already cash-flows at list — no discount required.
- Meets the 1% rule at list price ($2k rent vs $127k).
- Recommended offer: $112k (12.0% below list) — sets the bar for market timing.
- Cap rate 11.1% vs local median 4.0% in Groves — top-decile yield for the area; either an underpriced asset or a hidden risk that comps aren't pricing in. Stress-test before assuming the spread holds.
Location & tenants
- Location reads 71/100 on livability (#315 in TX) — a middle-class / working-renter tenant base. Strengths: cost of living A+, housing A+, health & safety A; Watch: employment C-, amenities F, commute F.
- Port Neches-Groves ISD (suburban): math 42% / reading 47% proficiency, ranked #260 of 826 in TX (top 32%) — families likely to look elsewhere, expect single-tenant / working-renter base with shorter leases.
- Market conditions: 92 active listings in the ZIP; 343 units permitted in Jefferson County in 2024 (0 in 5+ unit buildings).
- This rent runs 30% of the median local income ($74k/yr) — at the standard rent-burdened threshold; future hikes will face affordability resistance.
Forward outlook
- Local home prices are declining (-3.0%/yr); year-one equity from $880 of loan paydown is wiped out by about $4k of value loss. Plan a longer hold.
- At projected returns (-3.0% appreciation + 3.0% rent growth), your $36k cash investment doubles in ~8 years — after that, you're playing with house money.
Negotiation context
- It's been on market 384 days — a 12% lower offer ($112k) is reasonable based on typical stale-listing flexibility.
Risks & watch-outs
- Watch-outs: flood insurance adds $66/mo.
- Climate carrying-cost: severe flood risk; severe wind risk, 99% chance of damaging wind over 30y; extreme-heat days projected 7→25/yr by 2055 (HVAC capex compounding) — expect insurance premiums to compound above CPI over the hold.
Questions for the listing agent
- It's been on market 384 days. Have you received any prior offers? Is the seller open to a 12% concession, seller financing, or rate buy-down credit?
- Built in 1962 — when were the roof, HVAC, electrical panel, plumbing, and water heater last replaced?
- What's the actual annual flood-insurance premium (NFIP or private), and is the property in a SFHA with mandatory coverage?
- Why hasn't it sold? Are there any deal-killer items the seller is aware of (foundation, flood, title, zoning, code violations)?
- Is there a deadline driving the sale (1031 exchange, divorce, estate, relocation)? That informs how much negotiation room exists.
- What's the average days-on-market for RENTAL listings here right now (not sales)? A rising rental-DOM trend means longer vacancies and softer asking-rent achievability than the comps imply.
- What's the recent tenant-quality profile in this submarket — average credit score on applications, eviction rate, late-payment / NSF rate, and stable-employment percentage? A property-management company in the area should have these aggregated.
- How much new for-sale + rental construction is in the pipeline within 1–3 miles? Heavy new supply typically softens prices + rents 12–24 months out; constrained supply supports both.
Investment metrics
- 1% rule
- 1.45% ✓
- Cap rate
- 11.06%
- Cash-on-cash
- 17.04%
- DSCR
- 1.76
- GRM
- 5.7
CMA / ARV
- ARV (median comp)
- $176,240
- List price
- $127,299
- Delta
- -27.77%
- Verdict
- UNDERPRICED
- Comps
- 20 within 1.0 mi
Show comp detail 12 sales within ~0.75 mi
| Address | Dist | Beds/Ba | Sqft | Sold | Price | $/sf | Match |
|---|---|---|---|---|---|---|---|
| 6220 32nd St | 0.51mi | 4/2.0 | 1,606 (+6%) | 8mo | $254,000 | $158 | 56 |
| 2600 Berry Ave | 0.26mi | 3/2.0 (-1) | 1,431 (-5%) | 19mo | $154,900 | $108 | 56 |
| 2301 Owens Ave | 0.29mi | 3/1.0 (-1) | 1,310 (-13%) | 3mo | $199,999 | $153 | 55 |
| 3022 South Dr | 0.33mi | 3/2.0 (-1) | 1,583 (+5%) | 21mo | $49,900 | $32 | 52 |
| 2330 Little John Ln | 0.62mi | 3/2.0 (-1) | 1,478 (-2%) | 12mo | $239,900 | $162 | 51 |
| 3231 Charles Ave | 0.52mi | 3/1.5 (-1) | 1,632 (+8%) | 8mo | $240,000 | $147 | 50 |
| 2649 Azalea Ave | 0.47mi | 3/2.0 (-1) | 1,290 (-14%) | 1mo | $205,000 | $159 | 46 |
| 3165 Charles Ave | 0.47mi | 3/2.0 (-1) | 1,584 (+5%) | 21mo | $190,000 | $120 | 46 |
| 1924 Owens Ave | 0.49mi | 4/2.0 | 1,716 (+14%) | 9mo | $250,000 | $146 | 44 |
| 6698 Verde St | 0.75mi | 3/1.0 (-1) | 1,398 (-7%) | 11mo | $170,000 | $122 | 37 |
| 2920 Terrace Ave | 0.47mi | 3/2.0 (-1) | 1,668 (+11%) | 23mo | $262,376 | $157 | 34 |
| 3420 Grant Ave | 0.63mi | 3/2.0 (-1) | 1,685 (+12%) | 24mo | $169,900 | $101 | 24 |
Match score weights: distance 35% · size 25% · config 20% · recency 20%. Top-matched comps best support the ARV.
Projected returns pro-forma
-3.0% appreciation · 3.0% rent growth · sell at horizon
- IRR
- 5.4%
- Equity multiple
- 1.21×
- Total profit
- $7,489
- Equity at exit
- $18,981
- IRR
- 14.9%
- Equity multiple
- 2.21×
- Total profit
- $43,041
- Equity at exit
- $11,006
Cash invested: $35,644 (down + closing). Projections, not guarantees.
Landlord ↔ Tenant lean methodology
- Overall (STATE)
- 87 Strongly Landlord-Friendly
- State Texas
- 87 Strongly Landlord-Friendly · R+5
- County
- — inherits STATE
- City
- — inherits STATE
ZIP-level market 77619
- Active inventory
- 92
- Price-to-rent
- 5.7×
Monthly cashflow live
- Estimated rent
- $1,846 medium interval (Pro) →
- Mortgage (P&I)
- −$668
- Tax from tax record
- −$232 /mo · $2,778/yr
- Insurance
- −$53
- Flood insurance flood zone
- −$66 /mo · $798/yr
- HOA
- −$0
- Vacancy / Maint / Mgmt
- −$388
- Net cashflow
- $440
Break-even live
Sensitivity live
| Price | -10% $512 | -5% $476 | +0% $440 | +5% $404 | +10% $368 |
|---|---|---|---|---|---|
| Rent | -10% $294 | -5% $367 | +0% $440 | +5% $513 | +10% $586 |
| Rate | -1.0pp $504 | -0.5pp $472 | base $440 | +0.5pp $407 | +1.0pp $373 |
UW: 25.0% down · 7.5% · 30yr · 1.5% tax · 5.0% vac · 8.0% maint · 8.0% mgmt
Financing live
Cash to close
- Down payment
- $31,825
- Closing costs
- $3,819
- Reserves months
- —
- Total cash needed
- —
Loan-product check · same deal, 3 products live
Conventional
25% down · 7.5% · 30yr
- Down + closing
- —
- Monthly P&I
- —
- Monthly cashflow
- —
- DSCR
- —
- Eligible?
- —
Personal DTI + credit; lowest rate.
DSCR
20% down · 8.5% · 30yr
- Down + closing
- —
- Monthly P&I
- —
- Monthly cashflow
- —
- DSCR
- —
- Eligible?
- —
No personal income docs; deal must DSCR.
Hard money
10% down · 12.0% · 12mo
- Down + closing
- —
- Monthly P&I
- —
- Monthly cashflow
- —
- DSCR
- —
- Eligible?
- —
Short-term bridge; refi at stabilization.
Listing history 16 events
-
2026-06-21days on market $127,299 Active 384 DOM
-
2026-06-18days on market $127,299 Active 381 DOM
-
2026-06-17days on market $127,299 Active 380 DOM
-
2026-06-16days on market $127,299 Active 379 DOM
-
2026-06-15days on market $127,299 Active 378 DOM
-
2026-06-14days on market $127,299 Active 376 DOM
-
2026-06-10days on market $127,299 Active 373 DOM
-
2026-06-09days on market $127,299 Active 372 DOM
-
2026-06-08days on market $127,299 Active 371 DOM
-
2026-06-07days on market $127,299 Active 370 DOM
-
2026-06-03days on market $127,299 Active 366 DOM
-
2026-06-02days on market $127,299 Active 365 DOM
-
2026-06-01days on market $127,299 Active 364 DOM
-
2026-05-31days on market $127,299 Active 363 DOM
-
2026-05-30days on market $127,299 Active 362 DOM
-
2025-06-02$127,299 Active 987-char remark
Show marketing remark (987 chars)
FIXER UPPER! Welcome to this charming 4 bedroom and 1 ½ bathroom home available just outside of Beaumont, TX. This property has approximately 1,508 Sq. Ft. of living space and features a large living room, lovely kitchen that overlooks the breakfast area, an extended covered front porch, a backyard deck area, and a wooden storage unit in the backyard. It has wooded flooring in the main areas of the home and ceramic tile in the kitchen and bathrooms. It is being sold As Is but has a lot of potential. Here you will have convenient access to TX-87 and TX-73. Downtown Beaumont and Lamar University are approximately 20 minutes away and there are tons of great local eateries, markets, and parks nearby. Sabine Lake is a very short commute away as well. WE MAKE IT EAST TO OWN. This is a great opportunity! Don't wait, call us today to get more information on the owner's easy terms and smooth process that may be able to put the deed in your name and make this your dream home.
ⓘ Source: listings_history table (triggers on properties + properties_extension) + one-shot
backfill from property_details.listing_events for pre-trigger history.
Tax reassessment forecast TX · Resets to sale price
- Current annual tax
- $2,778 · $232/mo
- Projected year-2 tax
- $2,778 · $232/mo
- Expected delta
- $0/yr ($0/mo · 0.0%)
ⓘ Screening estimate from a state-policy table — verify with the county assessor before closing.
Climate risk First Street
- Flood 8/10 Severe FEMA zone X (shaded) · 60% chance over 30 yrs
- Wildfire 1/10 Low
- Heat 9/10 Extreme 7 d/yr ≥110°F today · 25 d/yr by 30 yrs out
- Wind 9/10 Extreme 99% chance of damaging wind over 30 yrs
- Air quality 2/10 Low 1 unhealthy d/yr today · 1 by 30 yrs out
Nearby sold comps map
Loading sold comps map…
Walkable amenities ~0.75 mi
Loading nearby amenities…
Taxation est. · year 1
- Rental income
- $22,151
- − Mortgage interest
- −$7,131
- − Property taxes
- −$2,778
- − Insurance
- −$1,434
- − Repairs & maintenance
- −$1,772
- − Management
- −$1,772
- − Depreciation
- −$3,703
- Taxable income
- $3,561
- Est. tax owed @ 24.0%
- −$855
- After-tax cash flow
- $4,422/yr
For passive investors: Depreciation is non-cash, so a rental often shows a tax loss while cash-flowing — sheltering income. Rental losses are passive: they offset passive income freely, and up to $25,000/yr can offset ordinary (W-2) income if you actively participate and your MAGI is under $100k (phasing out to $0 by $150k); unused losses carry forward. On sale, claimed depreciation is recaptured at up to 25%, and gains may owe capital-gains tax (a 1031 exchange can defer both). Figures are a year-1 estimate at your 24.0% rate — not tax advice; consult a CPA.
Schools (NCES district)
- District
- Port Neches-Groves ISD
- NCES district ID
- 4835430
- Math proficiency
- 42% ▼ -13.00%
- Reading proficiency
- 47% ▼ -5.00%
- Median HH income
- $54,661
- Composite
- 38.65/100
- National rank
- #4152
- State rank
- #260 of 826 in TX
Livability — Groves
- Score
- 71/100
- State rank
- #315
- US rank
- #7031
Category grades
Schools grade is shown separately in the Schools card above.
Census & demographics
- Census place
- Groves, TX
- County
- Jefferson County · 203,592 people
- City population
- 16,976
- Metro
- Beaumont-Port Arthur, TX
- Population (ZIP)
- 16,976
- Household income
- $73,710
- Rent vs Own
- Severe rent burden
- 131.0
Population outlook (Jefferson County) Hauer SSP2
- Today (2025)
- 259,015 people
- By 2030
- 260,685 · +0.6%
- By 2040
- 263,309 · +1.7%
- By 2050
- 265,237 · +2.4%
- By 2075
- 270,193 · +4.3%
- By 2100
- 255,628 · -1.3%
Race, ethnicity, and origin ACS 2023
- Neighborhood character
- Diverse neighborhood (Simpson 0.62)
- Race & ethnicity
- White 53% Hispanic / Latino 30% Two or more races 18% Black 9% Asian 6%
- Hispanic origin (detail)
- Mexican 24% Dominican 2%
- Common ancestry
- Lithuanian 10% Serbian 1% Slovak 1%
- Foreign-born
- 16% · Canada, Vietnam, Jamaica
- Languages at home
- 72% English-only · Spanish 20% Vietnamese 5% Other Asian/Pacific 2%
Political lean MEDSL · Jefferson
- 2024 margin
- Lean R (+8.9) · D 45.1% · R 54.0%
- 2008→2024 swing
- -11.1pp toward R · 2008: 2.2pp · 2024: -8.9pp
- All cycles
- 2024: R+8.9 2020: R+1.6 2016: R+0.5 2012: D+1.6 2008: D+2.2
Not yet ingested
- Civics
- —
Market trends
- HPI YoY
- ▼ -235.42%
- Current HPI
- 183.1358
- Rent YoY
- —
- Metro
- Beaumont-Port Arthur, TX
- State GDP YoY
- ▲ 3.95%
- F500 in state
- 110
Industry mix (Fortune 500 HQ in TX)
| Industry | F500 HQs | Revenue |
|---|---|---|
| Energy | 16 | $1,198B |
|
||
| Technology | 5 | $198B |
|
||
| Engineering / Construction | 4 | $72B |
|
||
| Energy Services | 3 | $60B |
|
||
| Utilities | 3 | $41B |
|
||
| Healthcare | 2 | $330B |
|
||
Price history
1 event — show timeline
- 2025-06-02 Listed $127,299 HARMLS
Property tax history
+3.0%/yrLatest (2025): $2,778 · -30.2% YoY. Source: county tax records.
Cash-flow waterfall
monthlySold comps — $/sqft
last 12 mo · ≤1 miLoading sold comps…