8515 N Atlantic Ave Unit 1-46 · Cape Canaveral, FL
Flood risk 7/10 · Major
- FEMA flood zone
- X (unshaded)
- Chance of flooding over 30 yrs
- 0.89%
- Est. flood insurance / yr
- $507 – $1,088
Fire risk 1/10 · Minimal
- Est. fire insurance / yr
- $947 – $1,759
Heat risk 10/10 · Severe
- Hot days now (above 105°F)
- 7 days/yr
- Hot days in 30 yrs
- 23 days/yr
Wind risk 10/10 · Severe
- Chance of severe wind over 30 yrs
- 99.0%
Air-quality risk 1/10 · Minimal
- Unhealthy air days now
- 0 days/yr
- Unhealthy air days in 30 yrs
- 0 days/yr
Risk factors via First Street. Map © Google.
Why this score? — see what drove the B grade
The composite is a weighted blend of 9 inputs, each scored 0–100. Each bar is that input's sub-score; the figure is the points it added to the 100-point composite (weight × sub-score).
- Cash flow +30.0/30.0
- 1% rule +10.0/10.0
- DSCR +10.0/10.0
- ARV discount +7.5/15.0
- Schools +4.7/10.0
- Livability +4.2/5.0
- Rent growth +3.5/5.0
- Condition / age +2.2/5.0
- Appreciation +0.0/10.0
$89,900
🖨 Deal sheet (PDF) 📄 Offer letter ✓ Due diligence
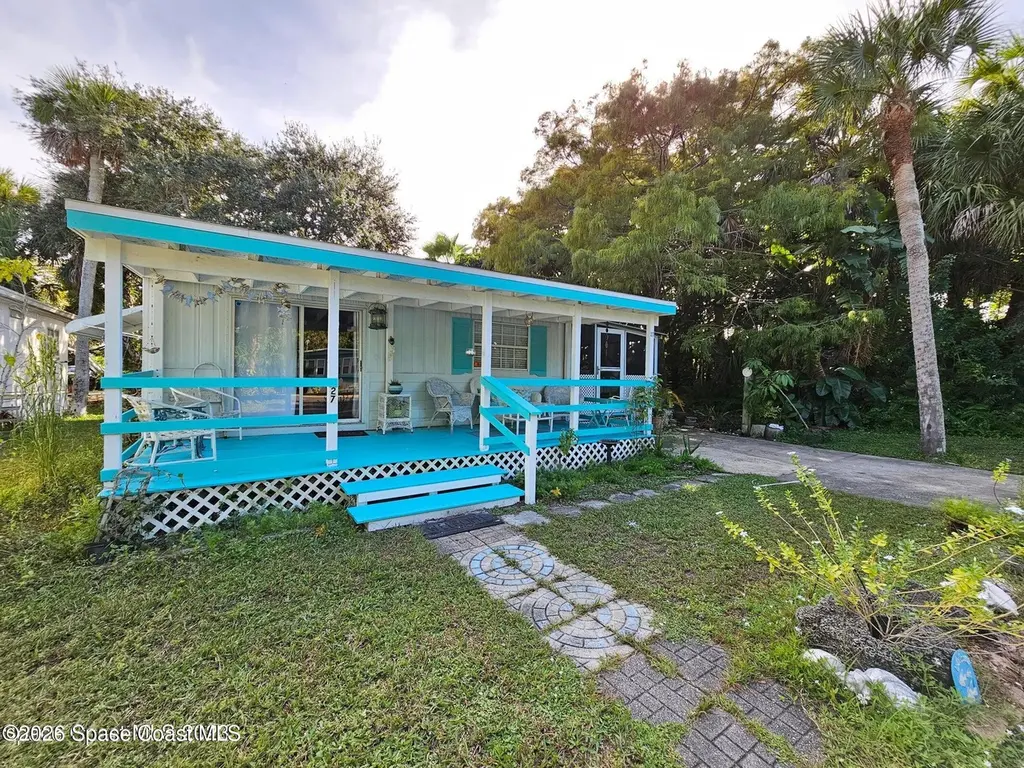
Listing remarks
Mobile Home Only, Land Not Included / Sale Handled Directly with Owner Fully furnished and move in ready, this 2 bedroom, 2 bath mobile home is tucked at the back of Cape Canaveral Mobile Estates, surrounded by mature trees that offer natural shade and added privacy. Everything you need is already here, just unpack and settle in. The layout is comfortable and functional, with a welcoming front porch perfect for enjoying the Florida weather, a screened side porch for year round outdoor living, and a nature trail that winds around the back of the property. Plenty of space for a garden or container plants as well. Located in a 55+ community just minutes from the beach, with easy access to P
Key facts
- Screened side porch
- Nature trail
- Move in ready
Tags
Property features AI
Finance
- Other: Lot size approximately 3.83 acres; Additional parcel referenced
- HOA & community: Senior community
Exterior
- Parking: Unassigned parking; Other parking
- Utilities: Public sewer; Cable available; Electricity available; Sewer available; Water available
- Home design: Manufactured home; One story; North-facing
- Construction: Aluminum siding
- Exterior features: Patio; Porch; Screened porch; Many trees on the lot
Interior
- Kitchen: Electric cooktop; Electric oven; Refrigerator
- Bedrooms: 2 bedrooms
- Flooring: Carpet; Laminate; Tile
- Bathrooms: 2 full bathrooms
- Heating & cooling: Wall/window cooling units; No central heating listed
- Interior features: Ceiling fan(s); Eat-in kitchen; Primary bathroom with tub and shower; Furnished
- Laundry & utility: Electric water heater
Neighborhood map
What this means for you Summary
Snapshot
- This is a 2-bed/2.0-bath manufactured listed at $90k. Condition is rated fair.
Deal economics
- At list price, monthly cash flow is $951 ($11k/yr) — positive.
- The deal already cash-flows at list — no discount required.
- Meets the 1% rule at list price ($2k rent vs $90k).
- Recommended offer: $89k (1.5% below list) — sets the bar for market timing.
Location & tenants
- Location reads 84/100 on livability (#34 in FL, #677 nationally) — a professional / high-income tenant draw. Strengths: crime A+, commute A+, housing A+; Watch: amenities F.
- Brevard (suburban): math 53% / reading 57% proficiency, ranked #19 of 73 in FL (top 26%) — acceptable for families but not a draw, mixed tenant base, ~2y average lease.
- Zoned schools: Cape View Elementary School (math 62% / reading 62%, grade B, #608 of 2,144 statewide, top 29%, 305 students, 61% FRL); Cocoa Beach Junior/Senior High School (math 65% / reading 66%, grade B, #75 of 667 statewide, top 11%, 982 students, 30% FRL) — zoned schools at 45% FRL track the district average.
- Market conditions: Rents rising fast (+4.0%/yr); 221 active listings in the ZIP; 40 comparable units currently listed for rent nearby; rentals at typical pace (median 26d on market — plan ~3-4 weeks tenant-placement turnaround); 4,602 units permitted in Brevard County in 2024 (702 in 5+ unit buildings).
- This rent runs 37% of the median local income ($67k/yr) — at the standard rent-burdened threshold; future hikes will face affordability resistance.
Forward outlook
- Local home prices are declining (-3.0%/yr); year-one equity from $622 of loan paydown is wiped out by about $3k of value loss. Plan a longer hold.
- Brevard County population projected at +15% by 2050 — modest demand growth; plan on rents tracking national, not racing it.
- At projected returns (-3.0% appreciation + 4.0% rent growth), your $25k cash investment doubles in ~3 years — after that, you're playing with house money.
Negotiation context
- It's been on market 15 days — a 2% lower offer ($89k) is reasonable based on typical stale-listing flexibility.
Risks & watch-outs
- Watch-outs: flood insurance adds $66/mo.
- Climate carrying-cost: major flood risk; severe wind risk, 99% chance of damaging wind over 30y; extreme-heat days projected 7→23/yr by 2055 (HVAC capex compounding) — expect insurance premiums to compound above CPI over the hold.
Questions for the listing agent
- Have any recent inspections been done? Can we get a copy of the seller's disclosures and any deferred-maintenance estimates?
- What's the actual annual flood-insurance premium (NFIP or private), and is the property in a SFHA with mandatory coverage?
- Is there a deadline driving the sale (1031 exchange, divorce, estate, relocation)? That informs how much negotiation room exists.
- Schools are B-rated — typically a magnet for longer-tenancy family renters. What's the average tenant stay here, and is there a school-zone premium baked into asking?
- What's the average days-on-market for RENTAL listings here right now (not sales)? A rising rental-DOM trend means longer vacancies and softer asking-rent achievability than the comps imply.
- What's the recent tenant-quality profile in this submarket — average credit score on applications, eviction rate, late-payment / NSF rate, and stable-employment percentage? A property-management company in the area should have these aggregated.
- How much new for-sale + rental construction is in the pipeline within 1–3 miles? Heavy new supply typically softens prices + rents 12–24 months out; constrained supply supports both.
Investment metrics
- 1% rule
- 2.31% ✓
- Cap rate
- 19.88%
- Cash-on-cash
- 48.52%
- DSCR
- 3.16
- GRM
- 3.6
CMA / ARV
No comps found within radius.
Projected returns pro-forma
-3.0% appreciation · 4.02% rent growth · sell at horizon
- IRR
- 43.7%
- Equity multiple
- 2.92×
- Total profit
- $48,253
- Equity at exit
- $13,404
- IRR
- 50.2%
- Equity multiple
- 6.14×
- Total profit
- $129,351
- Equity at exit
- $7,773
Cash invested: $25,172 (down + closing). Projections, not guarantees.
Landlord ↔ Tenant lean methodology
- Overall (STATE)
- 87 Strongly Landlord-Friendly
- State Florida
- 87 Strongly Landlord-Friendly · R+3
- County
- — inherits STATE
- City
- — inherits STATE
ZIP-level market 32920
- Home prices YoY
- -29.5%
- Rents YoY
- 4.0%
- Active inventory
- 221
- Price-to-rent
- 3.6×
Monthly cashflow live
- Estimated rent
- $2,075 high interval (Pro) →
- Mortgage (P&I)
- −$471
- Tax est. 1.5%
- −$112 /mo · $1,348/yr
- Insurance
- −$37
- Flood insurance flood zone
- −$66 /mo · $798/yr
- HOA
- −$0
- Vacancy / Maint / Mgmt
- −$436
- Net cashflow
- $951
Break-even live
Sensitivity live
| Price | -10% $1,014 | -5% $982 | +0% $951 | +5% $920 | +10% $889 |
|---|---|---|---|---|---|
| Rent | -10% $788 | -5% $869 | +0% $951 | +5% $1,033 | +10% $1,115 |
| Rate | -1.0pp $997 | -0.5pp $974 | base $951 | +0.5pp $928 | +1.0pp $904 |
UW: 25.0% down · 7.5% · 30yr · 1.5% tax · 5.0% vac · 8.0% maint · 8.0% mgmt
Financing live
Cash to close
- Down payment
- $22,475
- Closing costs
- $2,697
- Reserves months
- —
- Total cash needed
- —
Loan-product check · same deal, 3 products live
Conventional
25% down · 7.5% · 30yr
- Down + closing
- —
- Monthly P&I
- —
- Monthly cashflow
- —
- DSCR
- —
- Eligible?
- —
Personal DTI + credit; lowest rate.
DSCR
20% down · 8.5% · 30yr
- Down + closing
- —
- Monthly P&I
- —
- Monthly cashflow
- —
- DSCR
- —
- Eligible?
- —
No personal income docs; deal must DSCR.
Hard money
10% down · 12.0% · 12mo
- Down + closing
- —
- Monthly P&I
- —
- Monthly cashflow
- —
- DSCR
- —
- Eligible?
- —
Short-term bridge; refi at stabilization.
Rent comps 40 comps
| Address | Beds | Baths | Sqft | Rent | $/sqft | DOM | Units | Dist |
|---|---|---|---|---|---|---|---|---|
| 8515 N Atlantic Ave Unit 27 Cape Canaveral, FL | 2.0 | 2.0 | 1070 | $1,550 | $1.45 | 25d | 1 | 0.06mi |
| 8401 N Atlantic Ave Cape Canaveral, FL | 1.0–2.0 | 1.0 | 707 | $1,550 | $2.19 | 23d | 5 | 0.17mi |
| 8401 N Atlantic Ave Cape Canaveral, FL | 1.0–2.0 | 1.0 | 707 | $1,495 | $2.11 | 16d | 5 | 0.17mi |
| 213 Canaveral Beach Blvd Cape Canaveral, FL | 2.0 | 1.5 | 1200 | $1,850 | $1.54 | 21d | 1 | 0.22mi |
| 217 Canaveral Beach Blvd Cape Canaveral, FL | 2.0 | 1.5 | 1240 | $1,850 | $1.49 | 25d | 1 | 0.23mi |
| 201 Chandler St Cape Canaveral, FL | 1.0–2.0 | 1.0–2.0 | 700 | $1,595 | $2.28 | 21d | 1 | 0.23mi |
| 240 Canaveral Beach Blvd Cape Canaveral, FL | 2.0 | 1.0 | 828 | $2,200 | $2.66 | 16d | 1 | 0.26mi |
| 227 Canaveral Beach Blvd Cape Canaveral, FL | 1.0 | 1.0 | 700 | $1,600 | $2.29 | 21d | 1 | 0.26mi |
| 227 Canaveral Beach Blvd Unit 5 Cape Canaveral, FL | 1.0 | 1.0 | 700 | $1,600 | $2.29 | 23d | 1 | 0.26mi |
| 105 Garden Beach Ln Unit 1044317P Cape Canaveral, FL | 2.0 | 2.0 | 1184 | $2,986 | $2.52 | 16d | 1 | 0.27mi |
| 236 Chandler St Unit C Cape Canaveral, FL | 2.0 | 1.5 | 992 | $1,900 | $1.92 | 25d | 1 | 0.29mi |
| 258 Canaveral Beach Blvd Unit 1245234P Cape Canaveral, FL | 2.0 | 1.5 | 818 | $2,570 | $3.14 | 16d | 1 | 0.29mi |
| 262 Canaveral Beach Blvd Unit 1464867P Cape Canaveral, FL | 2.0 | 1.5 | 968 | $2,245 | $2.32 | 16d | 1 | 0.29mi |
| 211 Caroline St Cape Canaveral, FL | 2.0 | 1.0 | 705 | $1,545 | $2.19 | 25d | 1 | 0.32mi |
| 111 Columbia Dr Cape Canaveral, FL | 2.0 | 2.0 | 936 | $2,100 | $2.24 | 25d | 1 | 0.33mi |
| 8800 Sea Shell Ln Cape Canaveral, FL | 3.0 | 2.0 | 1025 | $3,200 | $3.12 | 25d | 1 | 0.33mi |
| 220 Columbia Dr #31 Cape Canaveral, FL | 2.0 | 1.0 | 835 | $1,350 | $1.62 | 25d | 1 | 0.33mi |
| 125 Adams Ave Cape Canaveral, FL | 2.0 | 2.0 | 1340 | $2,800 | $2.09 | 25d | 1 | 0.35mi |
| 299 Chandler St Cape Canaveral, FL | 2.0 | 2.0 | 1140 | $2,400 | $2.11 | 25d | 1 | 0.37mi |
| 299 Chandler St Unit F Cape Canaveral, FL | 2.0 | 2.5 | 1148 | $2,100 | $1.83 | 25d | 1 | 0.37mi |
| 221 Columbia Dr #133 Cape Canaveral, FL | 3.0 | 2.0 | 1200 | $1,700 | $1.42 | 25d | 1 | 0.37mi |
| 120 Madison Ave Cape Canaveral, FL | 2.0 | 2.5 | 1080 | $2,800 | $2.59 | 25d | 1 | 0.42mi |
| 161 Portside Ave #204 Cape Canaveral, FL | 2.0 | 2.0 | 1211 | $1,900 | $1.57 | 25d | 1 | 0.42mi |
| 8309 Rosalind Ave Cape Canaveral, FL | 3.0 | 2.5 | 1280 | $3,000 | $2.34 | 25d | 1 | 0.43mi |
| 180 Portside Ave #102 Cape Canaveral, FL | 2.0 | 2.0 | 1211 | $1,700 | $1.40 | 16d | 1 | 0.44mi |
| 123 Seaport Blvd Unit T10 Cape Canaveral, FL | 2.0 | 2.5 | 1120 | $2,300 | $2.05 | 25d | 1 | 0.44mi |
| 200 International Dr Unit CANB51 Cape Canaveral, FL | 2.0 | 2.0 | 1023 | $2,100 | $2.05 | 16d | 1 | 0.46mi |
| 200 International Dr #510 Cape Canaveral, FL | 2.0 | 2.0 | 1023 | $2,000 | $1.96 | 25d | 1 | 0.46mi |
| 237 Cherie Down Ln Unit 1 Cape Canaveral, FL | 2.0 | 2.5 | 960 | $2,150 | $2.24 | 25d | 1 | 0.48mi |
| 201 Ocean Park Ln Unit V41 Cape Canaveral, FL | 1.0 | 1.0 | 703 | $1,800 | $2.56 | 25d | 1 | 0.48mi |
| 8761 Ilex Ct Cape Canaveral, FL | 3.0 | 2.5 | 1416 | $4,000 | $2.82 | 25d | 1 | 0.49mi |
| 217 Ocean Park Ln Unit V49 Cape Canaveral, FL | 2.0 | 2.0 | 1014 | $2,000 | $1.97 | 21d | 1 | 0.49mi |
| 411 Jefferson Ave Cape Canaveral, FL | 2.0 | 1.0 | 780 | $1,700 | $2.18 | 25d | 1 | 0.49mi |
| 8717 Jasmine Ct Cape Canaveral, FL | 2.0 | 2.0 | 1178 | $2,950 | $2.50 | 25d | 1 | 0.52mi |
| 401 Seaport Blvd Unit T144 Cape Canaveral, FL | 3.0 | 2.5 | 1354 | $3,000 | $2.22 | 16d | 1 | 0.53mi |
| 8754 Honeysuckle Way Unit 1543006P Cape Canaveral, FL | 3.0 | 2.0 | 1108 | $4,170 | $3.76 | 16d | 1 | 0.54mi |
| 412 Beach Park Ln Unit 167 Cape Canaveral, FL | 2.0 | 2.0 | 1014 | $2,000 | $1.97 | 25d | 1 | 0.55mi |
| 8751 Live Oak Ct Cape Canaveral, FL | 2.0 | 2.0 | 1178 | $3,500 | $2.97 | 25d | 1 | 0.55mi |
| 8494 Ridgewood Ave #4405 Cape Canaveral, FL | 2.0 | 2.0 | 1316 | $2,600 | $1.98 | 25d | 1 | 0.56mi |
| 8494 Ridgewood Ave #4206 Cape Canaveral, FL | 2.0 | 2.0 | 1316 | $2,500 | $1.90 | 25d | 1 | 0.56mi |
Listing history 10 events
-
2026-06-17days on market $89,900 Active 15 DOM
-
2026-06-16days on market $89,900 Active 14 DOM
-
2026-06-15days on market $89,900 Active 13 DOM
-
2026-06-14days on market $89,900 Active 11 DOM
-
2026-06-10days on market $89,900 Active 8 DOM
-
2026-06-08days on market $89,900 Active 6 DOM
-
2026-06-07days on market $89,900 Active 5 DOM
-
2026-06-05days on market $89,900 Active 2 DOM
-
2026-06-03remarks 699-char remark
-
2026-06-03$89,900 Active 1 DOM
ⓘ Source: listings_history table (triggers on properties + properties_extension) + one-shot
backfill from property_details.listing_events for pre-trigger history.
Climate risk First Street
- Flood 7/10 Severe FEMA zone X (unshaded) · 89% chance over 30 yrs
- Wildfire 1/10 Low
- Heat 10/10 Extreme 7 d/yr ≥105°F today · 23 d/yr by 30 yrs out
- Wind 10/10 Extreme 99% chance of damaging wind over 30 yrs
- Air quality 1/10 Low 0 unhealthy d/yr today · 0 by 30 yrs out
Nearby sold comps map
Loading sold comps map…
Walkable amenities ~0.75 mi
Loading nearby amenities…
Taxation est. · year 1
- Rental income
- $24,899
- − Mortgage interest
- −$5,036
- − Property taxes
- −$1,348
- − Insurance
- −$1,247
- − Repairs & maintenance
- −$1,992
- − Management
- −$1,992
- − Depreciation
- −$2,615
- Taxable income
- $10,668
- Est. tax owed @ 24.0%
- −$2,560
- After-tax cash flow
- $8,857/yr
For passive investors: Depreciation is non-cash, so a rental often shows a tax loss while cash-flowing — sheltering income. Rental losses are passive: they offset passive income freely, and up to $25,000/yr can offset ordinary (W-2) income if you actively participate and your MAGI is under $100k (phasing out to $0 by $150k); unused losses carry forward. On sale, claimed depreciation is recaptured at up to 25%, and gains may owe capital-gains tax (a 1031 exchange can defer both). Figures are a year-1 estimate at your 24.0% rate — not tax advice; consult a CPA.
Condition & rehab AI · 12 photos
This mobile home is move-in ready with a few cosmetic repairs and maintenance items needed to improve its appearance and value.
Repairs flagged
- Minor Kitchen cabinets — Light wear and tear, but not structural damage.
- Minor Bathroom tiles — Some wear, but not to the point of needing replacement.
- Minor Living room carpet — Significant wear, but not to the point of needing replacement.
- Minor Exterior siding — Some visible wear, but not to the point of needing immediate repair.
- Minor Windows — Some wear, but not to the point of needing immediate replacement.
- Minor HVAC unit — Functional, but the surrounding area shows some wear, which could be addressed during a thorough cleaning and maintenance check.
- Minor Landscaping — Overgrown and needs trimming, but not to the point of needing immediate replacement or major landscaping work.
Value-add opportunities
- Both Paint fresh coat in living room — Fresh paint can make a significant difference in the appearance and value of the home.
- Both Replace worn carpet in living room — Replacing worn carpet can improve the overall appearance and comfort of the living space.
- Both Replace worn tiles in bathrooms — Replacing worn tiles can improve the appearance and functionality of the bathrooms.
- Both Replace worn exterior siding — Replacing worn exterior siding can improve the overall appearance and value of the home.
- Both Replace worn windows — Replacing worn windows can improve the appearance and energy efficiency of the home.
- Both Replace HVAC unit — Replacing the HVAC unit can improve the comfort and energy efficiency of the home.
- Both Landscaping maintenance — Maintaining the landscaping can improve the overall appearance and curb appeal of the home.
Renovation cost estimate screening
| Repair item | Severity | Est. cost |
|---|---|---|
| Kitchen cabinets · Light wear and tear, but not structural damage. | Minor | $500–3,000 |
| Bathroom tiles · Some wear, but not to the point of needing replacement. | Minor | $500–3,000 |
| Living room carpet · Significant wear, but not to the point of needing replacement. | Minor | $500–3,000 |
| Exterior siding · Some visible wear, but not to the point of needing immediate repair. | Minor | $500–3,000 |
| Windows · Some wear, but not to the point of needing immediate replacement. | Minor | $500–3,000 |
| HVAC unit · Functional, but the surrounding area shows some wear, which could be addressed during a thorough cleaning and maintenance check. | Minor | $500–3,000 |
| Landscaping · Overgrown and needs trimming, but not to the point of needing immediate replacement or major landscaping work. | Minor | $500–3,000 |
| Total estimated repair cost · 7 items | $3,500–21,000 |
Value-add ROI direction
- Both Paint fresh coat in living room — Fresh paint can make a significant difference in the appearance and value of the home. ↑
- Both Replace worn carpet in living room — Replacing worn carpet can improve the overall appearance and comfort of the living space. ↑
- Both Replace worn tiles in bathrooms — Replacing worn tiles can improve the appearance and functionality of the bathrooms. ↑
- Both Replace worn exterior siding — Replacing worn exterior siding can improve the overall appearance and value of the home. ↑
- Both Replace worn windows — Replacing worn windows can improve the appearance and energy efficiency of the home. ↑
- Both Replace HVAC unit — Replacing the HVAC unit can improve the comfort and energy efficiency of the home. ↑
- Both Landscaping maintenance — Maintaining the landscaping can improve the overall appearance and curb appeal of the home. ↑
ⓘ Cost ranges are severity-bucket heuristics (US national rule-of-thumb). Get contractor quotes + a written scope before underwriting a rehab budget.
Schools (NCES district)
- District
- Brevard
- NCES district ID
- 1200150
- Math proficiency
- 53% ▼ -9.00%
- Reading proficiency
- 57% ▼ -4.00%
- Median HH income
- $49,426
- Composite
- 46.86/100
- National rank
- #2370
- State rank
- #19 of 73 in FL
Livability — Cape Canaveral
- Score
- 84/100
- State rank
- #34
- US rank
- #677
Category grades
Schools grade is shown separately in the Schools card above.
Census & demographics
- Census place
- Cape Canaveral, FL
- County
- Brevard County · 602,871 people
- City population
- 10,005
- Metro
- Palm Bay-Melbourne-Titusville, FL
- Population (ZIP)
- 10,005
- Household income
- $66,955
- Rent vs Own
- Severe rent burden
- 477.0
Population outlook (Brevard County) Hauer SSP2
- Today (2025)
- 623,254 people
- By 2030
- 648,420 · +4.0%
- By 2040
- 690,009 · +10.7%
- By 2050
- 715,669 · +14.8%
- By 2075
- 775,744 · +24.5%
- By 2100
- 776,687 · +24.6%
Race, ethnicity, and origin ACS 2023
- Neighborhood character
- Predominantly White (86%)
- Race & ethnicity
- White 86% Hispanic / Latino 9% Two or more races 4%
- Hispanic origin (detail)
- Mexican 1% Puerto Rican 6%
- Common ancestry
- Romanian 5% Lithuanian 5% Serbian 2%
- Foreign-born
- 6% · Canada
- Languages at home
- 93% English-only · Spanish 4% Russian/Polish/Slavic 1% German/W. Germanic 1%
Political lean MEDSL · Brevard
- 2024 margin
- Strong R (+20.8) · D 39.1% · R 59.9% · Other 1.0%
- 2008→2024 swing
- -10.4pp toward R · 2008: -10.4pp · 2024: -20.8pp
- All cycles
- 2024: R+20.8 2020: R+16.4 2016: R+19.8 2012: R+12.7 2008: R+10.4
Not yet ingested
- Civics
- —
Market trends
- HPI YoY
- ▼ -125.71%
- Current HPI
- 300.9707
- Rent YoY
- ▲ 4.02%
- Metro
- Palm Bay-Melbourne-Titusville, FL
- State GDP YoY
- ▲ 3.28%
- F500 in state
- 36
Industry mix (Fortune 500 HQ in FL)
| Industry | F500 HQs | Revenue |
|---|---|---|
| Industrial Technology | 2 | $29B |
|
||
| Insurance | 2 | $17B |
|
||
| Retail | 1 | $60B |
|
||
| Technology Distribution | 1 | $58B |
|
||
| Homebuilding | 1 | $35B |
|
||
| Technology Manufacturing | 1 | $35B |
|
||
Price history
1 event — show timeline
- 2026-06-02 Listed $89,900 SCMLS
Cash-flow waterfall
monthlySold comps — $/sqft
last 12 mo · ≤1 miLoading sold comps…