60 Terrace Dr · Monrovia, IN
Flood risk 1/10 · Minimal
- FEMA flood zone
- X (unshaded)
- Chance of flooding over 30 yrs
- 0.0%
- Est. flood insurance / yr
- $507 – $1,088
Fire risk 1/10 · Minimal
- Est. fire insurance / yr
- $717 – $1,331
Heat risk 3/10 · Minor
- Hot days now (above 102°F)
- 7 days/yr
- Hot days in 30 yrs
- 20 days/yr
Wind risk 2/10 · Minimal
- Chance of severe wind over 30 yrs
- 1.0%
Air-quality risk 3/10 · Minor
- Unhealthy air days now
- 2 days/yr
- Unhealthy air days in 30 yrs
- 3 days/yr
Risk factors via First Street. Map © Google.
Why this score? — see what drove the C- grade
The composite is a weighted blend of 9 inputs, each scored 0–100. Each bar is that input's sub-score; the figure is the points it added to the 100-point composite (weight × sub-score).
- Cash flow +15.5/30.0
- ARV discount +15.0/15.0
- DSCR +4.8/10.0
- Appreciation +4.5/10.0
- Schools +3.4/10.0
- Livability +3.3/5.0
- 1% rule +3.0/10.0
- Rent growth +2.5/5.0
- Condition / age +2.5/5.0
$222,500
🖨 Deal sheet (PDF) 📄 Offer letter ✓ Due diligence
Listing remarks MLS
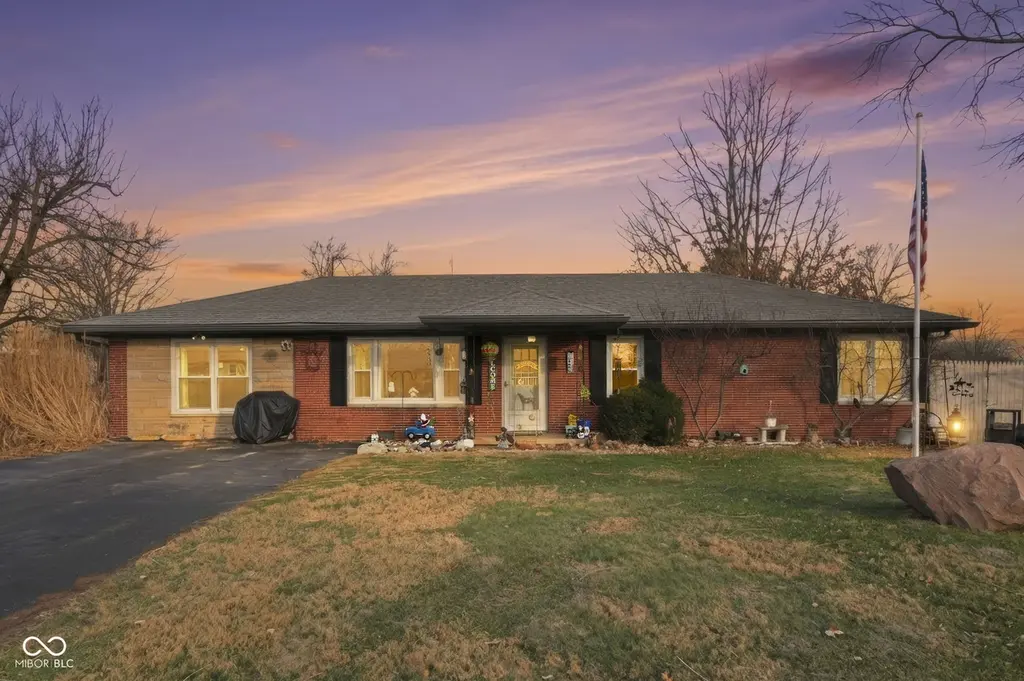
Discover an inviting home awaiting you at 60 Terrace DR, MONROVIA, IN. This all-brick ranch in Morgan county presents a wonderful opportunity, ready for you to move in and make it your own. The living room offers a warm and inviting space, enhanced by elegant crown molding, creating an atmosphere of comfort and relaxation. Imagine cozy evenings spent by the fire, enveloped in the tranquility of your own personal haven in an additional large, great room. The property features three bedrooms and one full bathroom, thoughtfully designed to provide comfortable living spaces. With a fenced backyard and a shed, the expansive 16771 square foot lot offers plentiful outdoor space. This 1475 square foot residence, built in 1958, is a single story of possibilities, ready to embrace your vision and lifestyle on a corner lot with no HOA.
Key facts
- All brick ranch
- Fenced backyard
- Corner lot
Tags
Neighborhood map
What this means for you Summary
Snapshot
- This is a 3-bed/1.0-bath single-family listed at $222k.
Deal economics
- At list price, monthly cash flow is $88 ($1k/yr) — positive.
- The deal already cash-flows at list — no discount required.
- To meet the 1% rule (rent ≥ 1% of price), the offer needs to be $179k (19.6% below list).
- Recommended offer: $179k (19.6% below list) — sets the bar for 1% rule.
- Cap rate 6.8% vs local median 4.4% in Monrovia — top-decile yield for the area; either an underpriced asset or a hidden risk that comps aren't pricing in. Stress-test before assuming the spread holds.
Location & tenants
- Location reads 66/100 on livability (#304 in IN) — a middle-class / working-renter tenant base. Strengths: crime A+, employment A+, cost of living A+; Watch: amenities F, commute F, health & safety F.
- Monroe-Gregg School District (rural): math 31% / reading 45% proficiency, ranked #143 of 301 in IN (top 48%) — families likely to look elsewhere, expect single-tenant / working-renter base with shorter leases.
- Zoned schools: Monrovia Elementary School (math 42% / reading 44%, grade F, #417 of 994 statewide, top 43%, 702 students, 47% FRL); Monrovia Middle School (math 24% / reading 42%, grade F, #180 of 330 statewide, top 56%, 328 students, 47% FRL); Monrovia High School (math 32% / reading 57%, grade F, #169 of 369 statewide, top 51%, 528 students, 36% FRL).
- Market conditions: 56 active listings in the ZIP; 2 comparable units currently listed for rent nearby; 330 units permitted in Morgan County in 2024 (0 in 5+ unit buildings).
Forward outlook
- Local home prices are declining (-1.0%/yr); year-one equity from $2k of loan paydown is wiped out by about $2k of value loss. Plan a longer hold.
- Morgan County population projected to shrink 6% by 2050 — rents likely to lag national; underwrite the cash flow, not the appreciation.
Negotiation context
- It's been on market 123 days — a 12% lower offer ($196k) is reasonable based on typical stale-listing flexibility.
Risks & watch-outs
- Watch-outs: built in 1958 — expect roof / HVAC / electrical / plumbing capex.
Questions for the listing agent
- It's been on market 123 days. Have you received any prior offers? Is the seller open to a 20% concession, seller financing, or rate buy-down credit?
- Built in 1958 — when were the roof, HVAC, electrical panel, plumbing, and water heater last replaced?
- Why hasn't it sold? Are there any deal-killer items the seller is aware of (foundation, flood, title, zoning, code violations)?
- Is there a deadline driving the sale (1031 exchange, divorce, estate, relocation)? That informs how much negotiation room exists.
- Schools are D-rated, which usually means shorter tenancies and higher turnover. Who's the typical renter profile here, and what's been the actual vacancy rate?
- What's the average days-on-market for RENTAL listings here right now (not sales)? A rising rental-DOM trend means longer vacancies and softer asking-rent achievability than the comps imply.
- What's the recent tenant-quality profile in this submarket — average credit score on applications, eviction rate, late-payment / NSF rate, and stable-employment percentage? A property-management company in the area should have these aggregated.
- How much new for-sale + rental construction is in the pipeline within 1–3 miles? Heavy new supply typically softens prices + rents 12–24 months out; constrained supply supports both.
Investment metrics
- 1% rule
- 0.80% ✗
- Cap rate
- 6.77%
- Cash-on-cash
- 1.69%
- DSCR
- 1.08
- GRM
- 10.4
CMA / ARV
- ARV (median comp)
- $284,223
- List price
- $222,500
- Delta
- -21.72%
- Verdict
- UNDERPRICED
- Comps
- 20 within 1.0 mi
Show comp detail 12 sales within ~0.75 mi
| Address | Dist | Beds/Ba | Sqft | Sold | Price | $/sf | Match |
|---|---|---|---|---|---|---|---|
| 60 Terrace Dr | 0.00mi | 3/1.0 | 1,475 (0%) | 0mo | $222,500 | $151 | 100 |
| 2941 W Hawanian Ln | 0.41mi | 4/2.0 (+1) | 1,454 (-1%) | 0mo | $250,000 | $172 | 69 |
| 2987 W Longbranch Dr | 0.52mi | 3/2.0 | 1,459 (-1%) | 3mo | $235,000 | $161 | 68 |
| 2966 W Calimanco Ln | 0.40mi | 3/2.0 | 1,399 (-5%) | 2mo | $255,000 | $182 | 68 |
| 3152 W Haberdashery Dr | 0.55mi | 3/2.0 | 1,495 (+1%) | 2mo | $270,000 | $181 | 67 |
| 11171 N Longbranch St | 0.42mi | 3/2.0 | 1,560 (+6%) | 4mo | $259,000 | $166 | 63 |
| 11111 N Longbranch St | 0.37mi | 3/2.0 | 1,616 (+10%) | 3mo | $250,000 | $155 | 60 |
| 2911 W Hawanian Ln | 0.40mi | 4/2.0 (+1) | 1,585 (+8%) | 11mo | $269,900 | $170 | 50 |
| 11254 N Sashing Way | 0.58mi | 3/2.0 | 1,565 (+6%) | 11mo | $267,000 | $171 | 50 |
| 11305 N Quillow Way | 0.75mi | 3/2.0 | 1,503 (+2%) | 12mo | $303,000 | $202 | 48 |
| 3256 W Vintage St | 0.67mi | 3/2.0 | 1,272 (-14%) | 1mo | $259,010 | $204 | 41 |
| 2936 W Calimanco Ln | 0.39mi | 4/2.0 (+1) | 1,660 (+12%) | 13mo | $272,000 | $164 | 41 |
Match score weights: distance 35% · size 25% · config 20% · recency 20%. Top-matched comps best support the ARV.
Projected returns pro-forma
-1.0% appreciation · 3.0% rent growth · sell at horizon
- IRR
- -4.1%
- Equity multiple
- 0.82×
- Total profit
- $-11,227
- Equity at exit
- $53,745
- IRR
- 2.6%
- Equity multiple
- 1.24×
- Total profit
- $15,168
- Equity at exit
- $56,467
Cash invested: $62,300 (down + closing). Projections, not guarantees.
Landlord ↔ Tenant lean methodology
- Overall (STATE)
- 90 Strongly Landlord-Friendly
- State Indiana
- 90 Strongly Landlord-Friendly · R+11
- County
- — inherits STATE
- City
- — inherits STATE
ZIP-level market 46157
- Home prices YoY
- -0.5%
- Active inventory
- 56
- Price-to-rent
- 10.4×
Monthly cashflow live
- Estimated rent
- $1,789 medium interval (Pro) →
- Mortgage (P&I)
- −$1,167
- Tax from tax record
- −$66 /mo · $794/yr
- Insurance
- −$93
- HOA
- −$0
- Vacancy / Maint / Mgmt
- −$376
- Net cashflow
- $88
Break-even live
Sensitivity live
| Price | -10% $214 | -5% $151 | +0% $88 | +5% $25 | +10% $-38 |
|---|---|---|---|---|---|
| Rent | -10% $-54 | -5% $17 | +0% $88 | +5% $159 | +10% $229 |
| Rate | -1.0pp $200 | -0.5pp $144 | base $88 | +0.5pp $30 | +1.0pp $-28 |
UW: 25.0% down · 7.5% · 30yr · 1.5% tax · 5.0% vac · 8.0% maint · 8.0% mgmt
Financing live
Cash to close
- Down payment
- $55,625
- Closing costs
- $6,675
- Reserves months
- —
- Total cash needed
- —
Loan-product check · same deal, 3 products live
Conventional
25% down · 7.5% · 30yr
- Down + closing
- —
- Monthly P&I
- —
- Monthly cashflow
- —
- DSCR
- —
- Eligible?
- —
Personal DTI + credit; lowest rate.
DSCR
20% down · 8.5% · 30yr
- Down + closing
- —
- Monthly P&I
- —
- Monthly cashflow
- —
- DSCR
- —
- Eligible?
- —
No personal income docs; deal must DSCR.
Hard money
10% down · 12.0% · 12mo
- Down + closing
- —
- Monthly P&I
- —
- Monthly cashflow
- —
- DSCR
- —
- Eligible?
- —
Short-term bridge; refi at stabilization.
Rent comps 2 comps
| Address | Beds | Baths | Sqft | Rent | $/sqft | DOM | Units | Dist |
|---|---|---|---|---|---|---|---|---|
| 2898 W Hawanian Ln Monrovia, IN | 3.0 | 2.0 | 1392 | $1,720 | $1.24 | 45d | 1 | 0.45mi |
| 3009 W Sampler Ln Monrovia, IN | 3.0 | 2.0 | 1560 | $1,866 | $1.20 | 45d | 1 | 0.50mi |
Listing history 4 events
-
2026-05-06status Pending 840-char remark
Show marketing remark (840 chars)
Discover an inviting home awaiting you at 60 Terrace DR, MONROVIA, IN. This all-brick ranch in Morgan county presents a wonderful opportunity, ready for you to move in and make it your own. The living room offers a warm and inviting space, enhanced by elegant crown molding, creating an atmosphere of comfort and relaxation. Imagine cozy evenings spent by the fire, enveloped in the tranquility of your own personal haven in an additional large, great room. The property features three bedrooms and one full bathroom, thoughtfully designed to provide comfortable living spaces. With a fenced backyard and a shed, the expansive 16771 square foot lot offers plentiful outdoor space. This 1475 square foot residence, built in 1958, is a single story of possibilities, ready to embrace your vision and lifestyle on a corner lot with no HOA.
-
2026-04-16price $222,500 840-char remark
Show marketing remark (840 chars)
Discover an inviting home awaiting you at 60 Terrace DR, MONROVIA, IN. This all-brick ranch in Morgan county presents a wonderful opportunity, ready for you to move in and make it your own. The living room offers a warm and inviting space, enhanced by elegant crown molding, creating an atmosphere of comfort and relaxation. Imagine cozy evenings spent by the fire, enveloped in the tranquility of your own personal haven in an additional large, great room. The property features three bedrooms and one full bathroom, thoughtfully designed to provide comfortable living spaces. With a fenced backyard and a shed, the expansive 16771 square foot lot offers plentiful outdoor space. This 1475 square foot residence, built in 1958, is a single story of possibilities, ready to embrace your vision and lifestyle on a corner lot with no HOA.
-
2026-02-15price $229,999 840-char remark
Show marketing remark (840 chars)
Discover an inviting home awaiting you at 60 Terrace DR, MONROVIA, IN. This all-brick ranch in Morgan county presents a wonderful opportunity, ready for you to move in and make it your own. The living room offers a warm and inviting space, enhanced by elegant crown molding, creating an atmosphere of comfort and relaxation. Imagine cozy evenings spent by the fire, enveloped in the tranquility of your own personal haven in an additional large, great room. The property features three bedrooms and one full bathroom, thoughtfully designed to provide comfortable living spaces. With a fenced backyard and a shed, the expansive 16771 square foot lot offers plentiful outdoor space. This 1475 square foot residence, built in 1958, is a single story of possibilities, ready to embrace your vision and lifestyle on a corner lot with no HOA.
-
2026-01-03$235,000 Active 840-char remark
Show marketing remark (840 chars)
Discover an inviting home awaiting you at 60 Terrace DR, MONROVIA, IN. This all-brick ranch in Morgan county presents a wonderful opportunity, ready for you to move in and make it your own. The living room offers a warm and inviting space, enhanced by elegant crown molding, creating an atmosphere of comfort and relaxation. Imagine cozy evenings spent by the fire, enveloped in the tranquility of your own personal haven in an additional large, great room. The property features three bedrooms and one full bathroom, thoughtfully designed to provide comfortable living spaces. With a fenced backyard and a shed, the expansive 16771 square foot lot offers plentiful outdoor space. This 1475 square foot residence, built in 1958, is a single story of possibilities, ready to embrace your vision and lifestyle on a corner lot with no HOA.
ⓘ Source: listings_history table (triggers on properties + properties_extension) + one-shot
backfill from property_details.listing_events for pre-trigger history.
Tax reassessment forecast IN · Partial reset (capped growth)
- Current annual tax
- $794 · $66/mo
- Projected year-2 tax
- $1,343 · $112/mo
- Expected delta
- +$549/yr (+$46/mo · 69.1%)
ⓘ Screening estimate from a state-policy table — verify with the county assessor before closing.
Climate risk First Street
- Flood 1/10 Low FEMA zone X (unshaded) · 0% chance over 30 yrs
- Wildfire 1/10 Low
- Heat 3/10 Moderate 7 d/yr ≥102°F today · 20 d/yr by 30 yrs out
- Wind 2/10 Low 100% chance of damaging wind over 30 yrs
- Air quality 3/10 Moderate 2 unhealthy d/yr today · 3 by 30 yrs out
Nearby sold comps map
Loading sold comps map…
Walkable amenities ~0.75 mi
Loading nearby amenities…
Taxation est. · year 1
- Rental income
- $21,472
- − Mortgage interest
- −$12,463
- − Property taxes
- −$794
- − Insurance
- −$1,112
- − Repairs & maintenance
- −$1,718
- − Management
- −$1,718
- − Depreciation
- −$6,473
- Taxable loss
- −$2,807
- Est. tax savings @ 24.0%
- +$674
- After-tax cash flow
- $1,728/yr
For passive investors: Depreciation is non-cash, so a rental often shows a tax loss while cash-flowing — sheltering income. Rental losses are passive: they offset passive income freely, and up to $25,000/yr can offset ordinary (W-2) income if you actively participate and your MAGI is under $100k (phasing out to $0 by $150k); unused losses carry forward. On sale, claimed depreciation is recaptured at up to 25%, and gains may owe capital-gains tax (a 1031 exchange can defer both). Figures are a year-1 estimate at your 24.0% rate — not tax advice; consult a CPA.
Schools (NCES district)
- District
- Monroe-Gregg School District
- NCES district ID
- 1804140
- Math proficiency
- 31% ▼ -9.00%
- Reading proficiency
- 45% ▼ -4.00%
- Median HH income
- $64,767
- Composite
- 34.2/100
- National rank
- #5266
- State rank
- #143 of 301 in IN
Livability — Monrovia
- Score
- 66/100
- State rank
- #304
- US rank
- #12092
Category grades
Schools grade is shown separately in the Schools card above.
Census & demographics
- Census place
- Monrovia, IN
- Population (ZIP)
- 4,370
Population outlook (Morgan County) Hauer SSP2
- Today (2025)
- 71,081 people
- By 2030
- 71,178 · +0.1%
- By 2040
- 69,907 · -1.7%
- By 2050
- 66,455 · -6.5%
- By 2075
- 57,291 · -19.4%
- By 2100
- 43,782 · -38.4%
Race, ethnicity, and origin ACS 2023
- Neighborhood character
- Predominantly White (90%)
- Race & ethnicity
- White 90% Two or more races 5% Hispanic / Latino 3% Black 2% Asian 1%
- Common ancestry
- Slovak 2% Italian 2% Lithuanian 1%
- Foreign-born
- 2%
- Languages at home
- 98% English-only · Tagalog/Filipino 1%
Political lean MEDSL · Morgan
- 2024 margin
- Solid R (+54.3) · D 22.0% · R 76.3% · Other 1.7%
- 2008→2024 swing
- -27.3pp toward R · 2008: -27.1pp · 2024: -54.3pp
- All cycles
- 2024: R+54.3 2020: R+54.6 2016: R+56.6 2012: R+41.1 2008: R+27.1
Not yet ingested
- Civics
- —
Market trends
- HPI YoY
- ▼ -1.00%
- Current HPI
- 212.8798
- Rent YoY
- —
- Metro
- —
- State GDP YoY
- ▲ 2.90%
- F500 in state
- 18
Industry mix (Fortune 500 HQ in IN)
| Industry | F500 HQs | Revenue |
|---|---|---|
| Industrial Machinery | 2 | $37B |
|
||
| Healthcare | 1 | $177B |
|
||
| Pharmaceuticals | 1 | $45B |
|
||
| Metals / Steel | 1 | $18B |
|
||
| Agriculture | 1 | $17B |
|
||
| Packaging | 1 | $12B |
|
||
Price history
-5.3% since first listed4 events — show timeline
- 2026-05-06 Pending — MIBOR as Distributed by MLS Grid
- 2026-04-16 Price Changed $222,500 MIBOR as Distributed by MLS Grid
- 2026-02-15 Price Changed $229,999 MIBOR as Distributed by MLS Grid
- 2026-01-03 Listed $235,000 MIBOR as Distributed by MLS Grid
Property tax history
+5.1%/yrLatest (2025): $794 · -12.5% YoY. Source: county tax records.
Cash-flow waterfall
monthlySold comps — $/sqft
last 12 mo · ≤1 miLoading sold comps…