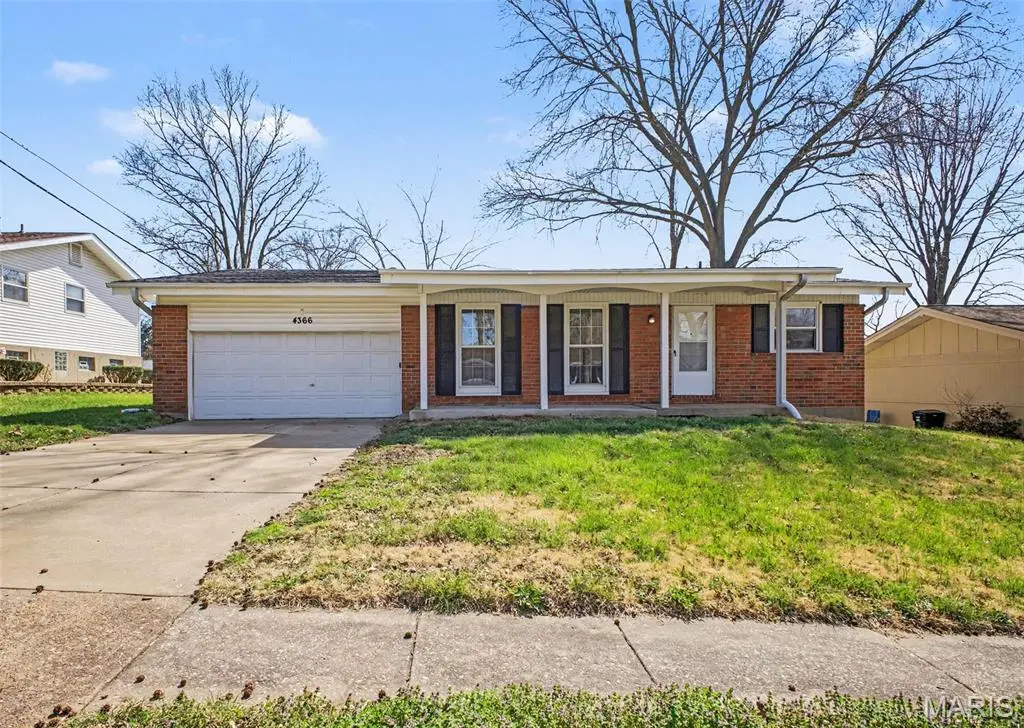
4366 Sulla Dr · Black Jack, MO
Flood risk 1/10 · Minimal
- FEMA flood zone
- X (unshaded)
- Chance of flooding over 30 yrs
- 0.0%
- Est. flood insurance / yr
- $473 – $860
Fire risk 1/10 · Minimal
- Est. fire insurance / yr
- $1,054 – $1,958
Heat risk 5/10 · Moderate
- Hot days now (above 106°F)
- 7 days/yr
- Hot days in 30 yrs
- 21 days/yr
Wind risk 2/10 · Minimal
- Chance of severe wind over 30 yrs
- 1.0%
Air-quality risk 3/10 · Minor
- Unhealthy air days now
- 3 days/yr
- Unhealthy air days in 30 yrs
- 5 days/yr
Risk factors via First Street. Map © Google.
Why this score? — see what drove the C grade
The composite is a weighted blend of 9 inputs, each scored 0–100. Each bar is that input's sub-score; the figure is the points it added to the 100-point composite (weight × sub-score).
- ARV discount +13.9/15.0
- Cash flow +12.9/30.0
- Appreciation +10.0/10.0
- Rent growth +4.4/5.0
- DSCR +3.9/10.0
- Livability +3.5/5.0
- 1% rule +3.4/10.0
- Condition / age +2.5/5.0
- Schools +1.7/10.0
$196,000
🖨 Deal sheet (PDF) 📄 Offer letter ✓ Due diligence
Listing remarks MLS
This move-in ready three-bedroom, two-bathroom home is perfectly situated in the desirable Seven Hills Plat 1 neighborhood. The interior features a functional layout highlighted by a kitchen equipped with durable granite countertops and sleek black appliances. The basement remains unfinished, offering a blank canvas and plenty of additional storage space to suit your needs. The location is a standout feature, offering incredible convenience with close proximity to local stores, grocery shops, and a variety of restaurants. You will also enjoy easy access to the highway for a quick commute without being right on top of the traffic. Schedule your private showing today!
Key facts
- Black appliances
- Unfinished basement
- Granite countertops
Tags
Neighborhood map
What this means for you Summary
Snapshot
- This is a 3-bed/2.0-bath single-family listed at $196k.
Deal economics
- At list price, monthly cash flow is $-13 ($-157/yr) — negative.
- To cash-flow at today's rent, offer at most $194k (1.2% below list).
- To meet the 1% rule (rent ≥ 1% of price), the offer needs to be $165k (15.9% below list).
- Recommended offer: $165k (15.9% below list) — sets the bar for 1% rule.
Location & tenants
- Location reads 70/100 on livability (#132 in MO) — a middle-class / working-renter tenant base. Strengths: cost of living A+, housing A+; Watch: health & safety C-, crime D+, amenities F.
- Hazelwood (suburban): math 11% / reading 26% proficiency, ranked #306 of 324 in MO (top 94%) — low school quality limits family demand, transient renter base, plan for 1-2y turnover.
- Zoned schools: Jury Elem. (math 5% / reading 19%, grade F, #1,016 of 1,115 statewide, top 92%, 420 students, 99% FRL); Central Middle (math 12% / reading 25%, grade F, #348 of 391 statewide, top 89%, 707 students, 68% FRL); Hazelwood Central High (math 12% / reading 33%, grade F, #455 of 521 statewide, top 88%, 1,628 students, 52% FRL) — zoned schools average 73% FRL vs 53% district-wide (20 pts higher); higher-poverty schools than district average — tighter screening recommended.
- Market conditions: Rents rising fast (+7.5%/yr); 221 active listings in the ZIP; 22 comparable units currently listed for rent nearby; rentals at typical pace (median 25d on market — plan ~3-4 weeks tenant-placement turnaround); 41% of comp listings sitting > 30 days — soft ceiling on asking rent; 920 units permitted in St. Louis County in 2024 (250 in 5+ unit buildings).
Forward outlook
- In year one you build about $21k of equity ($1k loan paydown + $20k appreciation (10.0% local appreciation)).
- At projected returns (10.0% appreciation + 7.5% rent growth), your $55k cash investment doubles in ~3 years — after that, you're playing with house money.
- By year 2, paydown + projected appreciation supports a ~$34k cash-out refi (75% LTV) — recoverable capital for the next deal without selling this one.
Negotiation context
- It's been on market 83 days — a 6% lower offer ($184k) is reasonable based on typical stale-listing flexibility.
- 3 sale attempts since 3y ago; this cycle's ask has dropped $12k (6%) from the opening price — seller is motivated, your offer sets the floor, not the list.
- Current owner paid $64k; list at $196k implies a 206% gain — meaningful room to come down on a strong offer.
Risks & watch-outs
- Climate carrying-cost: extreme-heat days projected 7→21/yr by 2055 (HVAC capex compounding) — expect insurance premiums to compound above CPI over the hold.
Questions for the listing agent
- What do current leases actually rent for vs. the listed asking? Can we see a recent rent roll and the last 12 months of T-12 income?
- It's been on market 83 days. Have you received any prior offers? Is the seller open to a 16% concession, seller financing, or rate buy-down credit?
- Built in 1965 — when were the roof, HVAC, electrical panel, plumbing, and water heater last replaced?
- What does the HOA fee cover, when was the last increase, and are there any pending special assessments or reserve-fund shortfalls?
- Why hasn't it sold? Are there any deal-killer items the seller is aware of (foundation, flood, title, zoning, code violations)?
- Is there a deadline driving the sale (1031 exchange, divorce, estate, relocation)? That informs how much negotiation room exists.
- Crime grade is D in this area — have there been break-ins, vandalism, or insurance claims at this property in the last 3 years? What carrier currently insures it and at what premium?
- What's the average days-on-market for RENTAL listings here right now (not sales)? A rising rental-DOM trend means longer vacancies and softer asking-rent achievability than the comps imply.
- What's the recent tenant-quality profile in this submarket — average credit score on applications, eviction rate, late-payment / NSF rate, and stable-employment percentage? A property-management company in the area should have these aggregated.
- How much new for-sale + rental construction is in the pipeline within 1–3 miles? Heavy new supply typically softens prices + rents 12–24 months out; constrained supply supports both.
Investment metrics
- 1% rule
- 0.84% ✗
- Cap rate
- 6.21%
- Cash-on-cash
- -0.29%
- DSCR
- 0.99
- GRM
- 9.9
CMA / ARV
- ARV (median comp)
- $228,251
- List price
- $196,000
- Delta
- -14.13%
- Verdict
- UNDERPRICED
- Comps
- 20 within 1.0 mi
Show comp detail 12 sales within ~0.75 mi
| Address | Dist | Beds/Ba | Sqft | Sold | Price | $/sf | Match |
|---|---|---|---|---|---|---|---|
| 4394 Satiris Dr | 0.09mi | 3/2.0 | 1,301 (-4%) | 1mo | $235,000 | $181 | 89 |
| 4428 Papal Dr | 0.13mi | 3/2.0 | 1,318 (-3%) | 6mo | $129,900 | $99 | 85 |
| 4451 Rhine Dr | 0.15mi | 3/2.0 | 1,421 (+5%) | 0mo | $165,000 | $116 | 84 |
| 4443 Remus Dr | 0.15mi | 4/2.5 (+1) | 1,354 (0%) | 3mo | $224,900 | $166 | 83 |
| 4333 Caracalla Dr | 0.12mi | 3/2.5 | 1,271 (-6%) | 3mo | $225,000 | $177 | 80 |
| 11962 Nero Dr | 0.24mi | 3/2.0 | 1,440 (+6%) | 1mo | $220,000 | $153 | 77 |
| 11678 Galba Dr | 0.39mi | 3/2.0 | 1,292 (-5%) | 2mo | $129,900 | $101 | 73 |
| 11565 Mehl Ave | 0.19mi | 2/1.5 (-1) | 1,270 (-6%) | 4mo | $81,000 | $64 | 70 |
| 4377 Varano Dr | 0.31mi | 3/2.0 | 1,155 (-15%) | 2mo | $150,000 | $130 | 60 |
| 11636 Macrinus Dr | 0.29mi | 4/3.0 (+1) | 1,525 (+13%) | 1mo | $229,900 | $151 | 56 |
| 2325 Grassland Dr | 0.55mi | 3/2.0 | 1,525 (+13%) | 2mo | $239,000 | $157 | 52 |
| 11129 Old Halls Ferry Rd | 0.63mi | 3/1.0 | 1,216 (-10%) | 7mo | $75,000 | $62 | 44 |
Match score weights: distance 35% · size 25% · config 20% · recency 20%. Top-matched comps best support the ARV.
Projected returns pro-forma
10.0% appreciation · 7.51% rent growth · sell at horizon
- IRR
- 25.6%
- Equity multiple
- 3.07×
- Total profit
- $113,738
- Equity at exit
- $176,572
- IRR
- 23.7%
- Equity multiple
- 7.46×
- Total profit
- $354,612
- Equity at exit
- $380,785
Cash invested: $54,880 (down + closing). Projections, not guarantees.
Landlord ↔ Tenant lean methodology
- Overall (STATE)
- 81 Strongly Landlord-Friendly
- State Missouri
- 81 Strongly Landlord-Friendly · R+10
- County
- — inherits STATE
- City
- — inherits STATE
ZIP-level market 63033
- Home prices YoY
- 2.5%
- Rents YoY
- 7.5%
- Active inventory
- 221
- Price-to-rent
- 9.9×
Monthly cashflow live
- Estimated rent
- $1,649 high interval (Pro) →
- Mortgage (P&I)
- −$1,028
- Tax from tax record
- −$196 /mo · $2,356/yr
- Insurance
- −$82
- HOA
- −$10
- Vacancy / Maint / Mgmt
- −$346
- Net cashflow
- $-13
Break-even live
Sensitivity live
| Price | -10% $98 | -5% $42 | +0% $-13 | +5% $-69 | +10% $-124 |
|---|---|---|---|---|---|
| Rent | -10% $-143 | -5% $-78 | +0% $-13 | +5% $52 | +10% $117 |
| Rate | -1.0pp $86 | -0.5pp $37 | base $-13 | +0.5pp $-64 | +1.0pp $-116 |
UW: 25.0% down · 7.5% · 30yr · 1.5% tax · 5.0% vac · 8.0% maint · 8.0% mgmt
Financing live
Cash to close
- Down payment
- $49,000
- Closing costs
- $5,880
- Reserves months
- —
- Total cash needed
- —
Loan-product check · same deal, 3 products live
Conventional
25% down · 7.5% · 30yr
- Down + closing
- —
- Monthly P&I
- —
- Monthly cashflow
- —
- DSCR
- —
- Eligible?
- —
Personal DTI + credit; lowest rate.
DSCR
20% down · 8.5% · 30yr
- Down + closing
- —
- Monthly P&I
- —
- Monthly cashflow
- —
- DSCR
- —
- Eligible?
- —
No personal income docs; deal must DSCR.
Hard money
10% down · 12.0% · 12mo
- Down + closing
- —
- Monthly P&I
- —
- Monthly cashflow
- —
- DSCR
- —
- Eligible?
- —
Short-term bridge; refi at stabilization.
Rent comps 22 comps
| Address | Beds | Baths | Sqft | Rent | $/sqft | DOM | Units | Dist |
|---|---|---|---|---|---|---|---|---|
| 11635 Hazeloak Dr Black Jack, MO | 3.0 | 2.0 | 1124 | $1,728 | $1.54 | 19d | 1 | 0.52mi |
| 2745 Rottingdean Dr St. Louis, MO | 1.0–2.0 | 1.0 | 825 | $975 | $1.18 | 45d | 1 | 0.55mi |
| 4872 Bristol Rock Rd Black Jack, MO | 4.0 | 2.0 | 1448 | $2,061 | $1.42 | 3d | 1 | 0.61mi |
| 4583 Whisper Lake Dr Black Jack, MO | 1.0–5.0 | 1.0–2.5 | 1225 | $1,180 | $0.96 | 0d | 18 | 0.91mi |
| 2544 Netherton Dr Saint Louis, MO | 3.0 | 2.0 | 1288 | $1,945 | $1.51 | 0d | 1 | 0.94mi |
| 2257 Luxmore Dr Saint Louis, MO | 3.0 | 3.0 | 1073 | $1,495 | $1.39 | 25d | 1 | 1.13mi |
| 1670 Arundel Dr Florissant, MO | 3.0 | 2.0 | 1012 | $1,450 | $1.43 | 25d | 1 | 1.16mi |
| 1536 Springlet Ct #31 Florissant, MO | 3.0 | 2.5 | 1161 | $1,450 | $1.25 | 0d | 1 | 1.18mi |
| 1536 Springlet Ct #31 Florissant, MO | 3.0 | 2.5 | 1161 | $1,450 | $1.25 | 9d | 1 | 1.18mi |
| 1502 Summer Run Dr #108 Florissant, MO | 2.0 | 1.5 | 922 | $1,200 | $1.30 | 25d | 1 | 1.23mi |
| 2259 Ainsworth Dr Saint Louis, MO | 4.0 | 2.0 | 1500 | $1,776 | $1.18 | 45d | 1 | 1.28mi |
| 2259 Ainsworth Dr Saint Louis, MO | 4.0 | 2.0 | 1561 | $2,100 | $1.35 | 0d | 1 | 1.28mi |
| 3582 Pershall Rd Unit 3631 Ferguson, MO | 2.0 | 2.0 | 1500 | $1,295 | $0.86 | 45d | 1 | 1.34mi |
| 10329 Chesley Dr Saint Louis, MO | 3.0 | 1.0 | 1014 | $1,350 | $1.33 | 25d | 1 | 1.35mi |
| 3585 Pershall Rd Unit Moor Ferguson, MO | 3.0 | 2.0 | 1577 | $1,500 | $0.95 | 45d | 1 | 1.39mi |
| 3585 Pershall Rd Unit Savana Ferguson, MO | 2.0 | 1.5 | 1518 | $1,375 | $0.91 | 45d | 1 | 1.39mi |
| 3585 Pershall Rd Ferguson, MO | 2.0 | 2.0 | 1388 | $1,400 | $1.01 | 45d | 1 | 1.39mi |
| 62 Capitol Hill Dr Saint Louis, MO | 3.0 | 2.0 | 1239 | $1,250 | $1.01 | 45d | 1 | 1.40mi |
| 10304 Bon Oak Dr Saint Louis, MO | 3.0 | 1.5 | 1500 | $1,250 | $0.83 | 45d | 1 | 1.41mi |
| 1547 Babcock Dr Saint Louis, MO | 3.0 | 1.0 | 1014 | $1,480 | $1.46 | 45d | 1 | 1.41mi |
| 1915 Green Valley Dr Saint Louis, MO | 4.0 | 2.0 | 1740 | $1,500 | $0.86 | 5d | 1 | 1.42mi |
| 1095 Ozment Dr Florissant, MO | 3.0 | 2.0 | 984 | $1,461 | $1.48 | 25d | 1 | 1.47mi |
HOA detail
- Monthly dues
- $10 · $120/yr
Listing history 33 events
-
2026-06-21days on market $196,000 Active 83 DOM
-
2026-06-18days on market $196,000 Active 80 DOM
-
2026-06-17days on market $196,000 Active 79 DOM
-
2026-06-16days on market $196,000 Active 78 DOM
-
2026-06-15price $196,000 Active 77 DOM
-
2026-06-15days on market $202,000 Active 77 DOM
-
2026-06-13days on market $202,000 Active 75 DOM
-
2026-06-13days on market $202,000 Active 74 DOM
-
2026-06-09days on market $202,000 Active 71 DOM
-
2026-06-08days on market $202,000 Active 70 DOM
-
2026-06-07days on market $202,000 Active 69 DOM
-
2026-06-05days on market $202,000 Active 66 DOM
-
2026-06-03days on market $202,000 Active 65 DOM
-
2026-06-02days on market $202,000 Active 64 DOM
-
2026-06-01days on market $202,000 Active 63 DOM
-
2026-05-31days on market $202,000 Active 62 DOM
-
2026-05-15price $202,000 674-char remark
Show marketing remark (674 chars)
This move-in ready three-bedroom, two-bathroom home is perfectly situated in the desirable Seven Hills Plat 1 neighborhood. The interior features a functional layout highlighted by a kitchen equipped with durable granite countertops and sleek black appliances. The basement remains unfinished, offering a blank canvas and plenty of additional storage space to suit your needs. The location is a standout feature, offering incredible convenience with close proximity to local stores, grocery shops, and a variety of restaurants. You will also enjoy easy access to the highway for a quick commute without being right on top of the traffic. Schedule your private showing today!
-
2026-03-30$208,000 Active 674-char remark
Show marketing remark (674 chars)
This move-in ready three-bedroom, two-bathroom home is perfectly situated in the desirable Seven Hills Plat 1 neighborhood. The interior features a functional layout highlighted by a kitchen equipped with durable granite countertops and sleek black appliances. The basement remains unfinished, offering a blank canvas and plenty of additional storage space to suit your needs. The location is a standout feature, offering incredible convenience with close proximity to local stores, grocery shops, and a variety of restaurants. You will also enjoy easy access to the highway for a quick commute without being right on top of the traffic. Schedule your private showing today!
-
2024-01-27historical $1,505
-
2024-01-27historical $1,505
-
2024-01-25price $1,505
-
2024-01-25price $1,505
-
2024-01-04price $1,575
-
2024-01-04price $1,575
-
2023-12-21price $1,610
-
2023-12-20price $1,610
-
2023-12-14price $1,650
-
2023-12-07price $1,650
-
2023-11-30price $1,675
-
2023-11-30price $1,675
-
2023-11-28$1,475
-
2023-11-23$1,475
-
2016-06-29soldstatus $64,000
ⓘ Source: listings_history table (triggers on properties + properties_extension) + one-shot
backfill from property_details.listing_events for pre-trigger history.
Tax reassessment forecast MO · Resets to sale price
- Current annual tax
- $2,356 · $196/mo
- Projected year-2 tax
- $2,356 · $196/mo
- Expected delta
- $0/yr ($0/mo · 0.0%)
ⓘ Screening estimate from a state-policy table — verify with the county assessor before closing.
Climate risk First Street
- Flood 1/10 Low FEMA zone X (unshaded) · 0% chance over 30 yrs
- Wildfire 1/10 Low
- Heat 5/10 Major 7 d/yr ≥106°F today · 21 d/yr by 30 yrs out
- Wind 2/10 Low 100% chance of damaging wind over 30 yrs
- Air quality 3/10 Moderate 3 unhealthy d/yr today · 5 by 30 yrs out
Nearby sold comps map
Loading sold comps map…
Walkable amenities ~0.75 mi
Loading nearby amenities…
Taxation est. · year 1
- Rental income
- $19,789
- − Mortgage interest
- −$10,979
- − Property taxes
- −$2,356
- − Insurance
- −$980
- − Repairs & maintenance
- −$1,583
- − Management
- −$1,583
- − HOA
- −$120
- − Depreciation
- −$5,702
- Taxable loss
- −$3,514
- Est. tax savings @ 24.0%
- +$843
- After-tax cash flow
- $686/yr
For passive investors: Depreciation is non-cash, so a rental often shows a tax loss while cash-flowing — sheltering income. Rental losses are passive: they offset passive income freely, and up to $25,000/yr can offset ordinary (W-2) income if you actively participate and your MAGI is under $100k (phasing out to $0 by $150k); unused losses carry forward. On sale, claimed depreciation is recaptured at up to 25%, and gains may owe capital-gains tax (a 1031 exchange can defer both). Figures are a year-1 estimate at your 24.0% rate — not tax advice; consult a CPA.
Schools (NCES district)
- District
- Hazelwood
- NCES district ID
- 2913830
- Math proficiency
- 11% ▼ -13.00%
- Reading proficiency
- 26% ▼ -6.00%
- Median HH income
- $51,621
- Composite
- 16.77/100
- National rank
- #9156
- State rank
- #306 of 324 in MO
Livability — Black Jack
- Score
- 70/100
- State rank
- #132
- US rank
- #7706
Category grades
Schools grade is shown separately in the Schools card above.
Census & demographics
- County
- Saint Louis County · 888,823 people
- City population
- 69,104
- Metro
- St. Louis, MO-IL
- Population (ZIP)
- 43,056
- Household income
- $66,776
- Rent vs Own
- Severe rent burden
- 1429.0
Population outlook (St. Louis County) Hauer SSP2
- Today (2025)
- 1,025,227 people
- By 2030
- 1,028,023 · +0.3%
- By 2040
- 1,020,940 · -0.4%
- By 2050
- 1,007,280 · -1.8%
- By 2075
- 987,277 · -3.7%
- By 2100
- 921,984 · -10.1%
Race, ethnicity, and origin ACS 2023
- Neighborhood character
- Predominantly Black (71%)
- Race & ethnicity
- Black 71% White 23% Two or more races 4% Hispanic / Latino 1%
- Common ancestry
- Romanian 1% Lithuanian 1% Italian 1%
- Foreign-born
- 3% · Canada, Vietnam
- Languages at home
- 95% English-only · Spanish 1% French/Haitian/Cajun 1%
Political lean MEDSL · St. Louis
- 2024 margin
- Strong D (+23.4) · D 60.8% · R 37.4% · Other 1.7%
- 2008→2024 swing
- +3.5pp toward D · 2008: 19.9pp · 2024: 23.4pp
- All cycles
- 2024: D+23.4 2020: D+24.0 2016: D+16.2 2012: D+13.7 2008: D+19.9
Not yet ingested
- Civics
- —
Market trends
- HPI YoY
- ▲ 13.78%
- Current HPI
- 570.6
- Rent YoY
- ▲ 7.51%
- Metro
- St. Louis, MO-IL
- State GDP YoY
- ▲ 1.84%
- F500 in state
- 20
Industry mix (Fortune 500 HQ in MO)
| Industry | F500 HQs | Revenue |
|---|---|---|
| Healthcare | 1 | $163B |
|
||
| Insurance | 1 | $21B |
|
||
| Industrial Technology | 1 | $17B |
|
||
| Retail | 1 | $16B |
|
||
| Industrial Distribution | 1 | $10B |
|
||
| Utilities | 1 | $9B |
|
||
Price history
+215.6% since first listed17 events — show timeline
- 2026-05-15 Price Changed $202,000 MARIS as Distributed by MLS Grid
- 2026-03-30 Listed $208,000 MARIS as Distributed by MLS Grid
- 2024-01-27 Rental Removed $1,505 RENTLY
- 2024-01-27 Rental Removed $1,505 RENT.
- 2024-01-25 Price Changed $1,505 RENTLY
- 2024-01-25 Price Changed $1,505 RENT.
- 2024-01-04 Price Changed $1,575 RENTLY
- 2024-01-04 Price Changed $1,575 RENT.
- 2023-12-21 Price Changed $1,610 RENTLY
- 2023-12-20 Price Changed $1,610 RENT.
- 2023-12-14 Price Changed $1,650 RENTLY
- 2023-12-07 Price Changed $1,650 RENT.
- 2023-11-30 Price Changed $1,675 RENTLY
- 2023-11-30 Price Changed $1,675 RENT.
- 2023-11-28 Listed for Rent $1,475 RENTLY
- 2023-11-23 Listed for Rent $1,475 RENT.
- 2016-06-29 Sold (Public Records) $64,000 Public Records
Property tax history
+1.9%/yrLatest (2022): $2,356 · +5.6% YoY. Source: county tax records.
Cash-flow waterfall
monthlySold comps — $/sqft
last 12 mo · ≤1 miLoading sold comps…