2098 River St St · Lisle, NY
Flood risk 9/10 · Severe
- FEMA flood zone
- X (unshaded)
- Chance of flooding over 30 yrs
- 0.99%
- Est. flood insurance / yr
- $507 – $1,088
Fire risk 1/10 · Minimal
- Est. fire insurance / yr
- $691 – $1,283
Heat risk 3/10 · Minor
- Hot days now (above 93°F)
- 7 days/yr
- Hot days in 30 yrs
- 16 days/yr
Wind risk 2/10 · Minimal
- Chance of severe wind over 30 yrs
- 1.0%
Air-quality risk 2/10 · Minimal
- Unhealthy air days now
- 0 days/yr
- Unhealthy air days in 30 yrs
- 1 days/yr
Risk factors via First Street. Map © Google.
Why this score? — see what drove the D grade
The composite is a weighted blend of 9 inputs, each scored 0–100. Each bar is that input's sub-score; the figure is the points it added to the 100-point composite (weight × sub-score).
- Appreciation +8.8/10.0
- Cash flow +7.5/30.0
- ARV discount +7.5/15.0
- Schools +4.3/10.0
- 1% rule +3.2/10.0
- Livability +2.9/5.0
- Rent growth +2.5/5.0
- Condition / age +2.5/5.0
- DSCR +1.6/10.0
$120,000
🖨 Deal sheet 📄 Offer letter ✓ Due diligence
Listing remarks MLS
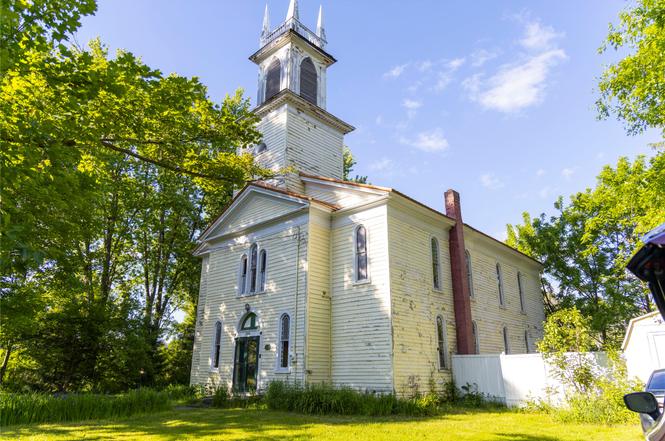
Incredibly unique, historic Church home built in 1822-24. Currently artist's residence/gallery. Character & charm. Unlimited potential. Side rooms downstairs for laundry & tiny 2nd BR, up bonus room, HW floors, beautiful stained glass windows. Central to Ithaca, Binghamton, Cortland. (nyslandmarks. com, religious structures/Lisle)
Key facts
- Tioughnioga river
- Historic property
- Balcony views
Tags
Property features AI
Exterior
- Parking: Detached garage with driveway (1 garage space)
- Utilities: Public water; Septic tank; Cable available
- Home design: Single-family residence; Two levels
- Construction: Wood siding; Stone foundation; Built with wood construction
- Exterior features: Level, wooded and landscaped lot; Shed(s)
Interior
- Kitchen: Microwave; Oven; Refrigerator
- Flooring: Hardwood; Tile
- Bathrooms: 1 full bathroom
- Heating & cooling: Coal stove; Propane heating; Wall furnace; Ceiling fan(s)
- Interior features: Cathedral and vaulted ceilings; High-speed internet
- Laundry & utility: Washer; Dryer; Washer hookup; Electric dryer hookup; Crawl space basement
Neighborhood map
What this means for you Summary
Snapshot
- This is a 1-bed/1.0-bath single-family listed at $120k.
Deal economics
- At list price, monthly cash flow is $-216 ($-3k/yr) — negative.
- To cash-flow at today's rent, offer at most $82k (31.8% below list).
- To meet the 1% rule (rent ≥ 1% of price), the offer needs to be $99k (17.7% below list).
- Recommended offer: $82k (31.8% below list) — sets the bar for cash-flow.
Location & tenants
- Location reads 57/100 on livability (#1,090 in NY) — a working-class tenant base; expect higher turnover. Strengths: cost of living A+, housing A+; Watch: health & safety D, crime F, amenities F.
- Whitney Point Central School District (rural): math 47% / reading 52% proficiency, ranked #390 of 590 in NY (top 66%) — families likely to look elsewhere, expect single-tenant / working-renter base with shorter leases.
- Zoned schools: Caryl E Adams Primary School (math 67% / reading 62%, grade B, #591 of 2,108 statewide, top 31%, 463 students, 54% FRL).
- Zoned-school proficiency averages 64% at this address vs 50% district-wide (+15 pts) — the actual schools serving this property are materially stronger than the Whitney Point Central School District average implies; a family-tenant draw the district grade alone would hide.
- Market conditions: 3 active listings in the ZIP; 340 units permitted in Broome County in 2024 (269 in 5+ unit buildings).
Forward outlook
- In year one you build about $10k of equity ($830 loan paydown + $9k appreciation (7.6% local appreciation)).
- Broome County population projected at -13% by 2050 — secular population decline; favor cash flow + early exit over multi-decade hold.
- By year 4, paydown + projected appreciation supports a ~$34k cash-out refi (75% LTV) — recoverable capital for the next deal without selling this one.
Negotiation context
- Only 3 days on market — expect competitive offers; lowballing is unlikely to land.
- 4 sale attempts since 19y ago with the ask held roughly flat each time — persistent listings suggest the price (not the market) is what's stuck; bring a comps-based counter.
- Current owner paid $84k; 43% above their basis — modest negotiation headroom, anchor on the comps not their cost.
Risks & watch-outs
- Watch-outs: property tax is 2.5% of price; flood insurance adds $66/mo; built in 1822 — expect roof / HVAC / electrical / plumbing capex.
- Climate carrying-cost: severe flood risk — expect insurance premiums to compound above CPI over the hold.
Questions for the listing agent
- What do current leases actually rent for vs. the listed asking? Can we see a recent rent roll and the last 12 months of T-12 income?
- Built in 1822 — when were the roof, HVAC, electrical panel, plumbing, and water heater last replaced?
- Property tax is high relative to price — has the assessment been appealed recently, and will the sale trigger a re-assessment?
- What's the actual annual flood-insurance premium (NFIP or private), and is the property in a SFHA with mandatory coverage?
- Is there a deadline driving the sale (1031 exchange, divorce, estate, relocation)? That informs how much negotiation room exists.
- Schools are F-rated, which usually means shorter tenancies and higher turnover. Who's the typical renter profile here, and what's been the actual vacancy rate?
- Crime grade is F in this area — have there been break-ins, vandalism, or insurance claims at this property in the last 3 years? What carrier currently insures it and at what premium?
- The area grade is low — what's the realistic commute time and amenity access for the typical tenant pool here? Any planned neighborhood developments (good or bad) we should know about?
- What's the average days-on-market for RENTAL listings here right now (not sales)? A rising rental-DOM trend means longer vacancies and softer asking-rent achievability than the comps imply.
- What's the recent tenant-quality profile in this submarket — average credit score on applications, eviction rate, late-payment / NSF rate, and stable-employment percentage? A property-management company in the area should have these aggregated.
- How much new for-sale + rental construction is in the pipeline within 1–3 miles? Heavy new supply typically softens prices + rents 12–24 months out; constrained supply supports both.
Investment metrics
- 1% rule
- 0.82% ✗
- Cap rate
- 4.80%
- Cash-on-cash
- -5.33%
- DSCR
- 0.76
- GRM
- 10.1
CMA / ARV
No comps found within radius.
Projected returns pro-forma
7.57% appreciation · 3.0% rent growth · sell at horizon
- IRR
- 13.2%
- Equity multiple
- 1.97×
- Total profit
- $32,513
- Equity at exit
- $87,663
- IRR
- 13.5%
- Equity multiple
- 4.12×
- Total profit
- $104,752
- Equity at exit
- $170,770
Cash invested: $33,600 (down + closing). Projections, not guarantees.
Landlord ↔ Tenant lean methodology
- Overall (STATE)
- 15 Strongly Tenant-Friendly
- State New York
- 15 Strongly Tenant-Friendly · D+10
- County
- — inherits STATE
- City
- — inherits STATE
ZIP-level market 13797
- Home prices YoY
- 2.3%
- Active inventory
- 3
- Price-to-rent
- 10.1×
Monthly cashflow live
- Estimated rent
- $987 medium interval (Pro) →
- Mortgage (P&I)
- −$629
- Tax from tax record
- −$250 /mo · $3,002/yr
- Insurance
- −$50
- Flood insurance flood zone
- −$66 /mo · $798/yr
- HOA
- −$0
- Vacancy / Maint / Mgmt
- −$207
- Net cashflow
- $-216
Break-even live
UW: 25.0% down · 7.5% · 30yr · 1.5% tax · 5.0% vac · 8.0% maint · 8.0% mgmt
Financing live
Cash to close
- Down payment
- $30,000
- Closing costs
- $3,600
- Reserves months
- —
- Total cash needed
- —
Loan-product check · same deal, 3 products live
Conventional
25% down · 7.5% · 30yr
- Down + closing
- —
- Monthly P&I
- —
- Monthly cashflow
- —
- DSCR
- —
- Eligible?
- —
Personal DTI + credit; lowest rate.
DSCR
20% down · 8.5% · 30yr
- Down + closing
- —
- Monthly P&I
- —
- Monthly cashflow
- —
- DSCR
- —
- Eligible?
- —
No personal income docs; deal must DSCR.
Hard money
10% down · 12.0% · 12mo
- Down + closing
- —
- Monthly P&I
- —
- Monthly cashflow
- —
- DSCR
- —
- Eligible?
- —
Short-term bridge; refi at stabilization.
Listing history 4 events
-
2026-06-19days on market $120,000 Active 3 DOM
-
2026-06-18days on market $120,000 Active 2 DOM
-
2026-06-17remarks 693-char remark
-
2026-06-17$120,000 Active 1 DOM
ⓘ Source: listings_history table (triggers on properties + properties_extension) + one-shot
backfill from property_details.listing_events for pre-trigger history.
Tax reassessment forecast NY · Partial reset (capped growth)
- Current annual tax
- $3,002 · $250/mo
- Projected year-2 tax
- $3,002 · $250/mo
- Expected delta
- $0/yr ($0/mo · 0.0%)
ⓘ Screening estimate from a state-policy table — verify with the county assessor before closing.
Climate risk First Street
- Flood 9/10 Extreme FEMA zone X (unshaded) · 99% chance over 30 yrs
- Wildfire 1/10 Low
- Heat 3/10 Moderate 7 d/yr ≥93°F today · 16 d/yr by 30 yrs out
- Wind 2/10 Low 100% chance of damaging wind over 30 yrs
- Air quality 2/10 Low 0 unhealthy d/yr today · 1 by 30 yrs out
Nearby sold comps map
Loading sold comps map…
Walkable amenities ~0.75 mi
Loading nearby amenities…
Taxation est. · year 1
- Rental income
- $11,849
- − Mortgage interest
- −$6,722
- − Property taxes
- −$3,002
- − Insurance
- −$1,398
- − Repairs & maintenance
- −$948
- − Management
- −$948
- − Depreciation
- −$3,491
- Taxable loss
- −$4,658
- Est. tax savings @ 24.0%
- +$1,118
- After-tax cash flow
- $-1,472/yr
For passive investors: Depreciation is non-cash, so a rental often shows a tax loss while cash-flowing — sheltering income. Rental losses are passive: they offset passive income freely, and up to $25,000/yr can offset ordinary (W-2) income if you actively participate and your MAGI is under $100k (phasing out to $0 by $150k); unused losses carry forward. On sale, claimed depreciation is recaptured at up to 25%, and gains may owe capital-gains tax (a 1031 exchange can defer both). Figures are a year-1 estimate at your 24.0% rate — not tax advice; consult a CPA.
Schools (NCES district)
- District
- Whitney Point Central School District
- NCES district ID
- 3631380
- Math proficiency
- 47% ▼ -6.00%
- Reading proficiency
- 52% ▲ 5.00%
- Median HH income
- $52,416
- Composite
- 42.59/100
- National rank
- #3192
- State rank
- #390 of 590 in NY
Livability — Lisle
- Score
- 57/100
- State rank
- #1090
- US rank
- #22122
Category grades
Schools grade is shown separately in the Schools card above.
Census & demographics
- Census place
- Lisle, NY
- Population (ZIP)
- 2,105
Population outlook (Broome County) Hauer SSP2
- Today (2025)
- 187,989 people
- By 2030
- 183,066 · -2.6%
- By 2040
- 172,228 · -8.4%
- By 2050
- 163,161 · -13.2%
- By 2075
- 153,641 · -18.3%
- By 2100
- 140,851 · -25.1%
Race, ethnicity, and origin ACS 2023
- Neighborhood character
- Predominantly White (96%)
- Race & ethnicity
- White 96% Two or more races 3%
- Common ancestry
- Romanian 8% Italian 2% Lithuanian 2%
- Foreign-born
- 0%
- Languages at home
- 99% English-only · Spanish 1%
Political lean MEDSL · Broome
- 2024 margin
- Toss-up / Even · D 50.2% · R 49.8%
- 2008→2024 swing
- -7.6pp toward R · 2008: 8.0pp · 2024: 0.4pp
- All cycles
- 2024: D+0.4 2020: D+3.5 2016: R+3.7 2012: D+4.6 2008: D+8.0
Not yet ingested
- Civics
- —
Market trends
- HPI YoY
- ▲ 7.57%
- Current HPI
- 340.355
- Rent YoY
- —
- Metro
- —
- State GDP YoY
- ▲ 2.60%
- F500 in state
- 92
Industry mix (Fortune 500 HQ in NY)
| Industry | F500 HQs | Revenue |
|---|---|---|
| Financial Services | 10 | $950B |
|
||
| Consumer Goods | 9 | $162B |
|
||
| Insurance | 4 | $225B |
|
||
| Telecommunications | 2 | $144B |
|
||
| Pharmaceuticals | 2 | $112B |
|
||
| Media / Entertainment | 2 | $69B |
|
||
Price history
+72.7% since first listed9 events — show timeline
- 2026-06-17 Listed $120,000 GBAOR
- 2017-06-07 Sold (Public Records) $84,000 Public Records
- 2017-06-05 Sold (MLS) $84,000 GBAOR
- 2016-01-18 Listed $97,500 IBRMLS
- 2015-11-24 Listed $97,500 GBAOR
- 2008-02-07 Sold (Public Records) $77,500 Public Records
- 2008-01-29 Sold (MLS) $77,500 UNYREIS
- 2007-06-14 Listed $92,000 UNYREIS
- 2004-02-25 Sold (Public Records) $69,500 Public Records
Property tax history
+14.0%/yrLatest (2025): $3,002 · -1.8% YoY. Source: county tax records.
Cash-flow waterfall
monthlySold comps — $/sqft
last 12 mo · ≤1 miLoading sold comps…