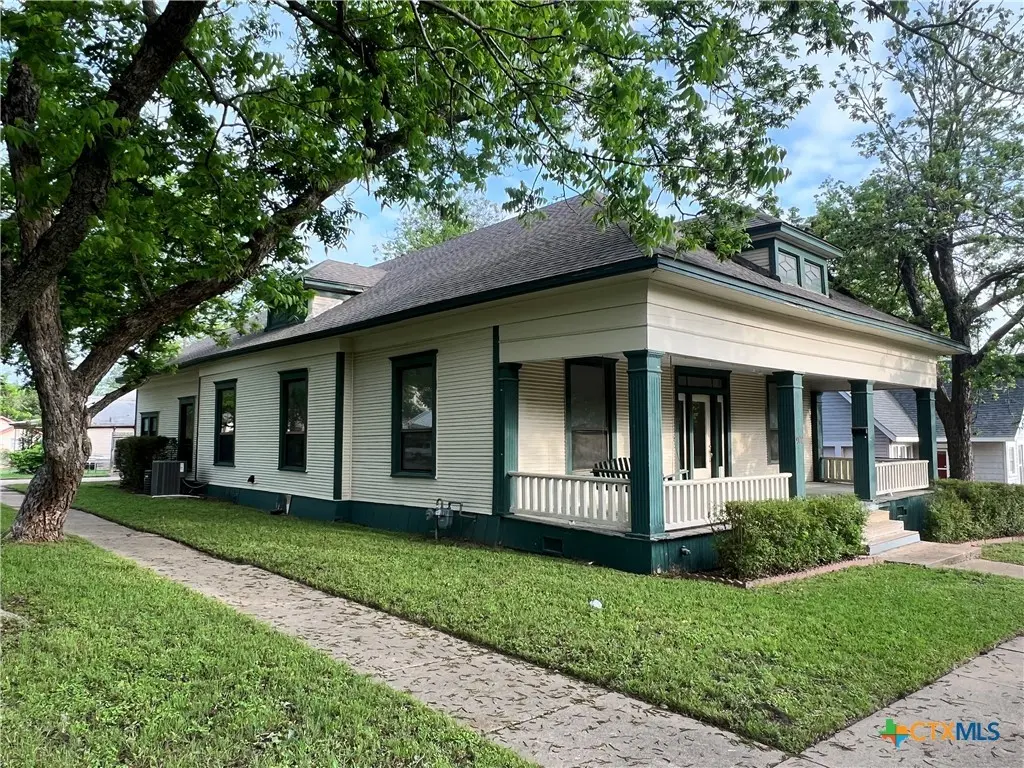
902 N 1st St · Temple, TX
Flood risk 1/10 · Minimal
- FEMA flood zone
- X (unshaded)
- Chance of flooding over 30 yrs
- 0.0%
- Est. flood insurance / yr
- $507 – $1,088
Fire risk 3/10 · Minor
- Est. fire insurance / yr
- $1,222 – $2,270
Heat risk 7/10 · Major
- Hot days now (above 108°F)
- 7 days/yr
- Hot days in 30 yrs
- 23 days/yr
Wind risk 6/10 · Moderate
- Chance of severe wind over 30 yrs
- 77.0%
Air-quality risk 1/10 · Minimal
- Unhealthy air days now
- 0 days/yr
- Unhealthy air days in 30 yrs
- 0 days/yr
Risk factors via First Street. Map © Google.
Why this score? — see what drove the B- grade
The composite is a weighted blend of 9 inputs, each scored 0–100. Each bar is that input's sub-score; the figure is the points it added to the 100-point composite (weight × sub-score).
- Cash flow +30.0/30.0
- 1% rule +10.0/10.0
- DSCR +10.0/10.0
- ARV discount +7.5/15.0
- Livability +3.8/5.0
- Rent growth +3.4/5.0
- Schools +2.7/10.0
- Condition / age +2.5/5.0
- Appreciation +0.0/10.0
$100,000
🖨 Deal sheet (PDF) 📄 Offer letter ✓ Due diligence
Listing remarks
Central Texas Auction & Realty is proud to present 902 North 1st, Temple, TX to be sold at auction on May 9th at 11AM. THE LISTING PRICE OF $100,000.00 IS THE MINIMUM OPENING BID. Welcome to this charming home located in North Temple near the Historic District, offering plenty of space to spread out. This inviting property features 4 spacious bedrooms and 2 full bathrooms, along with two comfortable living areas designed for both relaxing and entertaining. Situated on a desirable corner lot, the home enjoys added curb appeal and extra outdoor space. A large front porch welcomes you in and provides the perfect spot to enjoy your morning coffee or unwind in the evenings. Inside, you&rsq
Key facts
- Large front porch
- Two living areas
- Corner lot
Tags
Property features AI
Finance
- HOA & community: Curbs
Exterior
- Parking: Off-street parking (details not specified)
- Security: Smoke detector(s)
- Utilities: Public water; Public sewer
- Home design: Single-story; Resale property; Pillar/post/pier foundation
- Construction: HardiPlank type siding; Vinyl siding; Composition/shingle roof; Assessor-provided year built
- Exterior features: Covered porch; Deck; Porch; Storage; Wood picket fencing around back yard; Mature trees; Corner lot; City lot; Paved road
Interior
- Kitchen: Dishwasher; Gas range; Custom cabinets; Eat-in kitchen; Pantry; Solid surface counters; Kitchen/dining combo
- Bedrooms: Walk-in closet(s)
- Flooring: Laminate; Vinyl
- Bathrooms: 2 full bathrooms; Double vanity; Tub/shower
- Heating & cooling: Central heating (natural gas, multiple heating units); Central air conditioning (electric, two units)
- Interior features: Built-in features; Ceiling fan(s); Carbon monoxide detector; Double vanity; Kitchen/dining combo; Multiple living areas; Pull-down attic stairs; Tub/shower; Vanity; Walk-in closet(s); Custom cabinets; Eat-in kitchen; Pantry; Solid surface counters
- Laundry & utility: Laundry in utility room; Laundry room; Water heater
Neighborhood map
What this means for you Summary
Snapshot
- This is a 4-bed/2.0-bath single-family listed at $100k.
Deal economics
- At list price, monthly cash flow is $797 ($10k/yr) — positive.
- The deal already cash-flows at list — no discount required.
- Meets the 1% rule at list price ($2k rent vs $100k).
- Recommended offer: $98k (1.5% below list) — sets the bar for market timing.
- Cap rate 15.9% vs local median 3.6% in Temple — top-decile yield for the area; either an underpriced asset or a hidden risk that comps aren't pricing in. Stress-test before assuming the spread holds.
Location & tenants
- Location reads 75/100 on livability (#122 in TX, #3,814 nationally) — a middle-class / working-renter tenant base. Strengths: cost of living A+, housing A+, health & safety A+; Watch: schools C-, commute C-, crime D+.
- Temple ISD (urban): math 32% / reading 31% proficiency, ranked #590 of 826 in TX (top 71%) — families likely to look elsewhere, expect single-tenant / working-renter base with shorter leases; 66% free/reduced lunch — lower-income household profile, screen leases tightly.
- Market conditions: Rents rising (+3.4%/yr); 335 active listings in the ZIP; 6 comparable units currently listed for rent nearby; rentals at typical pace (median 24d on market — plan ~3-4 weeks tenant-placement turnaround); 3,222 units permitted in Bell County in 2024 (246 in 5+ unit buildings).
- This rent runs 36% of the median local income ($63k/yr) — at the standard rent-burdened threshold; future hikes will face affordability resistance.
Forward outlook
- Local home prices are declining (-3.0%/yr); year-one equity from $691 of loan paydown is wiped out by about $3k of value loss. Plan a longer hold.
- Bell County population projected at +21% by 2050 — long-run rental-demand tailwind backs the buy-and-hold thesis.
- At projected returns (-3.0% appreciation + 3.4% rent growth), your $28k cash investment doubles in ~4 years — after that, you're playing with house money.
Negotiation context
- It's been on market 16 days — a 2% lower offer ($98k) is reasonable based on typical stale-listing flexibility.
- 3 sale attempts since 2y ago with the ask held roughly flat each time — persistent listings suggest the price (not the market) is what's stuck; bring a comps-based counter.
Risks & watch-outs
- Watch-outs: built in 1915 — expect roof / HVAC / electrical / plumbing capex.
- Climate carrying-cost: major wind risk, 77% chance of damaging wind over 30y; extreme-heat days projected 7→23/yr by 2055 (HVAC capex compounding) — expect insurance premiums to compound above CPI over the hold.
Questions for the listing agent
- Built in 1915 — when were the roof, HVAC, electrical panel, plumbing, and water heater last replaced?
- Is there a deadline driving the sale (1031 exchange, divorce, estate, relocation)? That informs how much negotiation room exists.
- Crime grade is D in this area — have there been break-ins, vandalism, or insurance claims at this property in the last 3 years? What carrier currently insures it and at what premium?
- What's the average days-on-market for RENTAL listings here right now (not sales)? A rising rental-DOM trend means longer vacancies and softer asking-rent achievability than the comps imply.
- What's the recent tenant-quality profile in this submarket — average credit score on applications, eviction rate, late-payment / NSF rate, and stable-employment percentage? A property-management company in the area should have these aggregated.
- How much new for-sale + rental construction is in the pipeline within 1–3 miles? Heavy new supply typically softens prices + rents 12–24 months out; constrained supply supports both.
Investment metrics
- 1% rule
- 1.88% ✓
- Cap rate
- 15.86%
- Cash-on-cash
- 34.18%
- DSCR
- 2.52
- GRM
- 4.4
CMA / ARV
- ARV (median comp)
- $261,714
- List price
- $100,000
- Delta
- -61.79%
- Verdict
- UNDERPRICED
- Comps
- 20 within 1.0 mi
Show comp detail 5 sales within ~0.75 mi
| Address | Dist | Beds/Ba | Sqft | Sold | Price | $/sf | Match |
|---|---|---|---|---|---|---|---|
| 902 N 1st St | 0.00mi | 4/2.0 | 2,522 (0%) | 0mo | $147,000 | $58 | 100 |
| 505 N 7th St | 0.32mi | 4/3.0 | 2,392 (-5%) | 7mo | $379,000 | $158 | 67 |
| 1308 N 13th St | 0.48mi | 3/2.0 (-1) | 2,409 (-4%) | 12mo | $389,900 | $162 | 56 |
| 504 W Park Ave | 0.57mi | 3/2.0 (-1) | 2,362 (-6%) | 4mo | $150,000 | $64 | 55 |
| 510 W Royal Ave | 0.67mi | 3/2.0 (-1) | 2,739 (+9%) | 7mo | $325,000 | $119 | 43 |
Match score weights: distance 35% · size 25% · config 20% · recency 20%. Top-matched comps best support the ARV.
Projected returns pro-forma
-3.0% appreciation · 3.44% rent growth · sell at horizon
- IRR
- 30.1%
- Equity multiple
- 2.27×
- Total profit
- $35,452
- Equity at exit
- $14,910
- IRR
- 37.6%
- Equity multiple
- 4.57×
- Total profit
- $99,856
- Equity at exit
- $8,646
Cash invested: $28,000 (down + closing). Projections, not guarantees.
Landlord ↔ Tenant lean methodology
- Overall (STATE)
- 87 Strongly Landlord-Friendly
- State Texas
- 87 Strongly Landlord-Friendly · R+5
- County
- — inherits STATE
- City
- — inherits STATE
ZIP-level market 76501
- Rents YoY
- 3.4%
- Active inventory
- 335
- Price-to-rent
- 4.4×
Monthly cashflow live
- Estimated rent
- $1,884 high interval (Pro) →
- Mortgage (P&I)
- −$524
- Tax est. 1.5%
- −$125 /mo · $1,500/yr
- Insurance
- −$42
- HOA
- −$0
- Vacancy / Maint / Mgmt
- −$396
- Net cashflow
- $797
Break-even live
Sensitivity live
| Price | -10% $867 | -5% $832 | +0% $797 | +5% $763 | +10% $728 |
|---|---|---|---|---|---|
| Rent | -10% $649 | -5% $723 | +0% $797 | +5% $872 | +10% $946 |
| Rate | -1.0pp $848 | -0.5pp $823 | base $797 | +0.5pp $772 | +1.0pp $745 |
UW: 25.0% down · 7.5% · 30yr · 1.5% tax · 5.0% vac · 8.0% maint · 8.0% mgmt
Financing live
Cash to close
- Down payment
- $25,000
- Closing costs
- $3,000
- Reserves months
- —
- Total cash needed
- —
Loan-product check · same deal, 3 products live
Conventional
25% down · 7.5% · 30yr
- Down + closing
- —
- Monthly P&I
- —
- Monthly cashflow
- —
- DSCR
- —
- Eligible?
- —
Personal DTI + credit; lowest rate.
DSCR
20% down · 8.5% · 30yr
- Down + closing
- —
- Monthly P&I
- —
- Monthly cashflow
- —
- DSCR
- —
- Eligible?
- —
No personal income docs; deal must DSCR.
Hard money
10% down · 12.0% · 12mo
- Down + closing
- —
- Monthly P&I
- —
- Monthly cashflow
- —
- DSCR
- —
- Eligible?
- —
Short-term bridge; refi at stabilization.
Rent comps 6 comps
| Address | Beds | Baths | Sqft | Rent | $/sqft | DOM | Units | Dist |
|---|---|---|---|---|---|---|---|---|
| 1919 N 7th St Temple, TX | 3.0 | 3.0 | 2000 | $1,975 | $0.99 | 44d | 1 | 0.71mi |
| 917 Crockett Ct Temple, TX | 3.0 | 2.0 | 1917 | $1,550 | $0.81 | 14d | 1 | 0.92mi |
| 2305 N 15th St Temple, TX | 3.0 | 2.0 | 2122 | $2,000 | $0.94 | 44d | 1 | 0.96mi |
| 2408 N 15th St Temple, TX | 3.0 | 2.0 | 1832 | $1,650 | $0.90 | 14d | 1 | 1.04mi |
| 1110 N 42nd St Temple, TX | 3.0 | 2.0 | 1935 | $1,600 | $0.83 | 14d | 1 | 1.46mi |
| 1115 S 11th St Temple, TX | 5.0 | 3.0 | 1900 | $1,595 | $0.84 | 24d | 1 | 1.49mi |
Listing history 7 events
-
2026-05-09status Pending 977-char remark
-
2026-04-23historical $1,895
-
2026-04-23$100,000 Active 977-char remark
-
2026-01-23$1,895
-
2025-01-27historical $1,895
-
2025-01-03price $1,895
-
2024-09-11$1,995
ⓘ Source: listings_history table (triggers on properties + properties_extension) + one-shot
backfill from property_details.listing_events for pre-trigger history.
Climate risk First Street
- Flood 1/10 Low FEMA zone X (unshaded) · 0% chance over 30 yrs
- Wildfire 3/10 Moderate
- Heat 7/10 Severe 7 d/yr ≥108°F today · 23 d/yr by 30 yrs out
- Wind 6/10 Major 77% chance of damaging wind over 30 yrs
- Air quality 1/10 Low 0 unhealthy d/yr today · 0 by 30 yrs out
Nearby sold comps map
Loading sold comps map…
Walkable amenities ~0.75 mi
Loading nearby amenities…
Taxation est. · year 1
- Rental income
- $22,611
- − Mortgage interest
- −$5,602
- − Property taxes
- −$1,500
- − Insurance
- −$500
- − Repairs & maintenance
- −$1,809
- − Management
- −$1,809
- − Depreciation
- −$2,909
- Taxable income
- $8,482
- Est. tax owed @ 24.0%
- −$2,036
- After-tax cash flow
- $7,534/yr
For passive investors: Depreciation is non-cash, so a rental often shows a tax loss while cash-flowing — sheltering income. Rental losses are passive: they offset passive income freely, and up to $25,000/yr can offset ordinary (W-2) income if you actively participate and your MAGI is under $100k (phasing out to $0 by $150k); unused losses carry forward. On sale, claimed depreciation is recaptured at up to 25%, and gains may owe capital-gains tax (a 1031 exchange can defer both). Figures are a year-1 estimate at your 24.0% rate — not tax advice; consult a CPA.
Schools (NCES district)
- District
- Temple ISD
- NCES district ID
- 4842330
- Math proficiency
- 32% ▼ -8.00%
- Reading proficiency
- 31% ▼ -4.00%
- Median HH income
- $43,120
- Composite
- 26.8/100
- National rank
- #7123
- State rank
- #590 of 826 in TX
Livability — Temple
- Score
- 75/100
- State rank
- #122
- US rank
- #3814
Category grades
Schools grade is shown separately in the Schools card above.
Census & demographics
- Census place
- Temple, TX
- County
- Bell County · 345,090 people
- City population
- 96,587
- Metro
- Killeen-Temple, TX
- Population (ZIP)
- 17,752
- Household income
- $62,532
- Rent vs Own
- Severe rent burden
- 466.0
Population outlook (Bell County) Hauer SSP2
- Today (2025)
- 371,114 people
- By 2030
- 389,104 · +4.8%
- By 2040
- 420,592 · +13.3%
- By 2050
- 447,779 · +20.7%
- By 2075
- 499,130 · +34.5%
- By 2100
- 505,680 · +36.3%
Race, ethnicity, and origin ACS 2023
- Neighborhood character
- Diverse neighborhood (Simpson 0.67)
- Race & ethnicity
- White 42% Hispanic / Latino 36% Two or more races 18% Black 17% Native American 2%
- Hispanic origin (detail)
- Mexican 31% Puerto Rican 2%
- Common ancestry
- Romanian 3% Italian 2% Slovak 1%
- Foreign-born
- 6% · Canada
- Languages at home
- 79% English-only · Spanish 20%
Political lean MEDSL · Bell
- 2024 margin
- R (+16.2) · D 41.3% · R 57.6% · Other 1.1%
- 2008→2024 swing
- -6.5pp toward R · 2008: -9.8pp · 2024: -16.2pp
- All cycles
- 2024: R+16.2 2020: R+8.5 2016: R+15.1 2012: R+16.4 2008: R+9.8
Not yet ingested
- Civics
- —
Market trends
- HPI YoY
- ▼ -113.09%
- Current HPI
- 177.0555
- Rent YoY
- ▲ 3.44%
- Metro
- Killeen-Temple, TX
- State GDP YoY
- ▲ 3.95%
- F500 in state
- 110
Industry mix (Fortune 500 HQ in TX)
| Industry | F500 HQs | Revenue |
|---|---|---|
| Energy | 16 | $1,198B |
|
||
| Technology | 5 | $198B |
|
||
| Engineering / Construction | 4 | $72B |
|
||
| Energy Services | 3 | $60B |
|
||
| Utilities | 3 | $41B |
|
||
| Healthcare | 2 | $330B |
|
||
Price history
+7268.4% since first listed8 events — show timeline
- 2026-06-09 Sold (MLS) $147,000 CTXMLS
- 2026-05-09 Pending — CTXMLS
- 2026-04-23 Rental Removed $1,895 BUILDIUM
- 2026-04-23 Listed $100,000 CTXMLS
- 2026-01-23 Listed for Rent $1,895 BUILDIUM
- 2025-01-27 Rental Removed $1,895 BUILDIUM
- 2025-01-03 Price Changed $1,895 BUILDIUM
- 2024-09-11 Listed for Rent $1,995 BUILDIUM
Property tax history
+7.8%/yrLatest (2026): $5,194 · -1.8% YoY. Source: county tax records.
Cash-flow waterfall
monthlySold comps — $/sqft
last 12 mo · ≤1 miLoading sold comps…