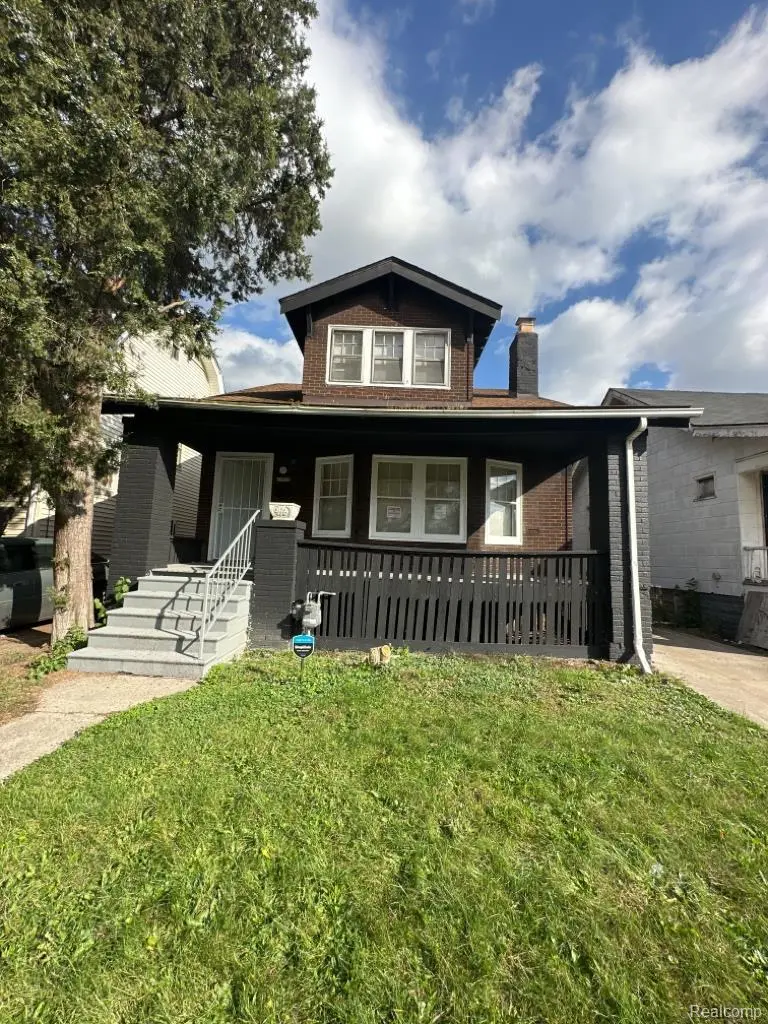
12290 Griggs St · Detroit, MI
Flood risk 1/10 · Minimal
- FEMA flood zone
- X (unshaded)
- Chance of flooding over 30 yrs
- 0.0%
- Est. flood insurance / yr
- $473 – $860
Fire risk 1/10 · Minimal
- Est. fire insurance / yr
- $784 – $1,456
Heat risk 2/10 · Minimal
- Hot days now (above 97°F)
- 7 days/yr
- Hot days in 30 yrs
- 13 days/yr
Wind risk 2/10 · Minimal
- Chance of severe wind over 30 yrs
- —
Air-quality risk 3/10 · Minor
- Unhealthy air days now
- 2 days/yr
- Unhealthy air days in 30 yrs
- 5 days/yr
Risk factors via First Street. Map © Google.
Why this score? — see what drove the B- grade
The composite is a weighted blend of 9 inputs, each scored 0–100. Each bar is that input's sub-score; the figure is the points it added to the 100-point composite (weight × sub-score).
- Cash flow +30.0/30.0
- DSCR +10.0/10.0
- Appreciation +10.0/10.0
- 1% rule +9.1/10.0
- Livability +3.7/5.0
- Rent growth +2.5/5.0
- Condition / age +2.5/5.0
- Schools +1.3/10.0
- ARV discount +0.0/15.0
$84,900
🖨 Deal sheet (PDF) 📄 Offer letter ✓ Due diligence
Listing remarks MLS
SECTION 8 TENANT OCCUPIED BRICK CAPE COD HOME LOCATED JUST NORTH OF GRAND RIVER AVENUE AND EAST OF MEYERS ROAD. THIS HOME FEATURES A COVERED FRONT PORCH, INVITING LIVING ROOM WITH FIREPLACE, FORMAL DINING ROOM, HARDWOOD FLOORS THROUGH OUT, THREE GOOD SIZED BEDROOMS, ONE BATHROOM, AND AN UNFINISHED BASEMENT. TENANT RENT IS 1100 AND IS PAID BY SECTION 8 100%. TENANT IS CURRENTLY MONTH TO MONTH BUT WISHES TO STAY. PHOTS ARE FROM 2023, BEFORE THE TENANT MOVED IN. PROPERTY IS SOLD AS-IS. ALL DIMENSIONS ARE ESTIMATED AND SHOULD BE VERIFIED. ALL SHOWINGS REQUIRE A LICENSED AGENT TO BE PRESENT. BUYER TO PAY DETROIT INVESTMENT CO A 295 PROCESSING FEE AT CLOSING.
Key facts
- Covered front porch
- Formal dining room
- Unfinished basement
Tags
Neighborhood map
What this means for you Summary
Snapshot
- This is a 3-bed/1.0-bath single-family listed at $85k.
Deal economics
- At list price, monthly cash flow is $405 ($5k/yr) — positive.
- The deal already cash-flows at list — no discount required.
- Meets the 1% rule at list price ($1k rent vs $85k).
- Recommended offer: $75k (12.0% below list) — sets the bar for market timing.
- Cap rate 12.0% vs local median 10.0% in Detroit — meaningfully above typical; check what's discounted (condition, days-on-market, listing class) to confirm the premium yield is real.
Location & tenants
- Location reads 73/100 on livability (#218 in MI) — a middle-class / working-renter tenant base. Strengths: amenities A+, commute A+, cost of living A+; Watch: schools F, crime F, employment F.
- Detroit Public Schools Community District (urban): math 10% / reading 24% proficiency, ranked #499 of 540 in MI (top 92%) — low school quality limits family demand, transient renter base, plan for 1-2y turnover; 90% free/reduced lunch — lower-income household profile, screen leases tightly.
- Market conditions: 248 active listings in the ZIP; 40 comparable units currently listed for rent nearby; rentals at typical pace (median 26d on market — plan ~3-4 weeks tenant-placement turnaround); 42% of comp listings sitting > 30 days — soft ceiling on asking rent; lower-income renter base — watch delinquency; 2,639 units permitted in Wayne County in 2024 (1,216 in 5+ unit buildings).
- This rent runs 42% of the median local income ($34k/yr) — at the standard rent-burdened threshold; future hikes will face affordability resistance.
Forward outlook
- In year one you build about $9k of equity ($587 loan paydown + $8k appreciation (10.0% local appreciation)).
- Wayne County population projected at -17% by 2050 — secular population decline; favor cash flow + early exit over multi-decade hold.
- At projected returns (10.0% appreciation + 3.0% rent growth), your $24k cash investment doubles in ~2 years — after that, you're playing with house money.
- By year 4, paydown + projected appreciation supports a ~$32k cash-out refi (75% LTV) — recoverable capital for the next deal without selling this one.
Negotiation context
- It's been on market 188 days — a 12% lower offer ($75k) is reasonable based on typical stale-listing flexibility.
- 2 sale attempts; this cycle's ask has dropped $5k (6%) from the opening price — seller is motivated, your offer sets the floor, not the list.
Risks & watch-outs
- Watch-outs: built in 1923 — expect roof / HVAC / electrical / plumbing capex.
Questions for the listing agent
- It's been on market 188 days. Have you received any prior offers? Is the seller open to a 12% concession, seller financing, or rate buy-down credit?
- Built in 1923 — when were the roof, HVAC, electrical panel, plumbing, and water heater last replaced?
- Why hasn't it sold? Are there any deal-killer items the seller is aware of (foundation, flood, title, zoning, code violations)?
- Is there a deadline driving the sale (1031 exchange, divorce, estate, relocation)? That informs how much negotiation room exists.
- Schools are F-rated, which usually means shorter tenancies and higher turnover. Who's the typical renter profile here, and what's been the actual vacancy rate?
- Crime grade is F in this area — have there been break-ins, vandalism, or insurance claims at this property in the last 3 years? What carrier currently insures it and at what premium?
- What's the average days-on-market for RENTAL listings here right now (not sales)? A rising rental-DOM trend means longer vacancies and softer asking-rent achievability than the comps imply.
- What's the recent tenant-quality profile in this submarket — average credit score on applications, eviction rate, late-payment / NSF rate, and stable-employment percentage? A property-management company in the area should have these aggregated.
- How much new for-sale + rental construction is in the pipeline within 1–3 miles? Heavy new supply typically softens prices + rents 12–24 months out; constrained supply supports both.
Investment metrics
- 1% rule
- 1.41% ✓
- Cap rate
- 12.02%
- Cash-on-cash
- 20.45%
- DSCR
- 1.91
- GRM
- 5.9
CMA / ARV
- ARV (median comp)
- $57,461
- List price
- $84,900
- Delta
- 47.75%
- Verdict
- OVERPRICED
- Comps
- 20 within 1.0 mi
Show comp detail 12 sales within ~0.75 mi
| Address | Dist | Beds/Ba | Sqft | Sold | Price | $/sf | Match |
|---|---|---|---|---|---|---|---|
| 12162 Kentucky St | 0.23mi | 3/1.0 | 1,415 (+2%) | 4mo | $42,000 | $30 | 82 |
| 12027 Manor St | 0.37mi | 3/1.0 | 1,340 (-3%) | 3mo | $86,750 | $65 | 75 |
| 11931 Wisconsin St | 0.32mi | 3/3.0 | 1,407 (+2%) | 5mo | $135,900 | $97 | 70 |
| 12096 Meyers Rd | 0.35mi | 3/1.0 | 1,248 (-10%) | 0mo | $30,000 | $24 | 67 |
| 12667 Sorrento St | 0.56mi | 3/1.0 | 1,309 (-5%) | 0mo | $65,000 | $50 | 64 |
| 13546 Ilene St | 0.51mi | 3/1.0 | 1,440 (+4%) | 6mo | $32,000 | $22 | 64 |
| 13176 Manor St | 0.45mi | 3/1.5 | 1,478 (+7%) | 2mo | $60,500 | $41 | 64 |
| 12303 Cloverlawn St | 0.50mi | 3/1.5 | 1,454 (+5%) | 4mo | $58,500 | $40 | 63 |
| 13586 Indiana St | 0.61mi | 3/1.0 | 1,298 (-6%) | 2mo | $30,000 | $23 | 60 |
| 10405 Orangelawn St | 0.74mi | 3/1.5 | 1,350 (-2%) | 3mo | $7,000 | $5 | 57 |
| 10340 Maplelawn St | 0.66mi | 3/2.0 | 1,296 (-6%) | 5mo | $27,000 | $21 | 51 |
| 13581 Cloverlawn St | 0.74mi | 4/2.0 (+1) | 1,240 (-10%) | 4mo | $143,000 | $115 | 36 |
Match score weights: distance 35% · size 25% · config 20% · recency 20%. Top-matched comps best support the ARV.
Projected returns pro-forma
10.0% appreciation · 3.0% rent growth · sell at horizon
- IRR
- 39.5%
- Equity multiple
- 4.03×
- Total profit
- $72,034
- Equity at exit
- $76,485
- IRR
- 34.1%
- Equity multiple
- 9.07×
- Total profit
- $191,811
- Equity at exit
- $164,942
Cash invested: $23,772 (down + closing). Projections, not guarantees.
Landlord ↔ Tenant lean methodology
- Overall (STATE)
- 62 Landlord-Friendly
- State Michigan
- 62 Landlord-Friendly · EVEN
- County
- — inherits STATE
- City
- — inherits STATE
ZIP-level market 48204
- Home prices YoY
- 18.5%
- Active inventory
- 248
- Price-to-rent
- 5.9×
Monthly cashflow live
- Estimated rent
- $1,194 high interval (Pro) →
- Mortgage (P&I)
- −$445
- Tax from tax record
- −$58 /mo · $694/yr
- Insurance
- −$35
- HOA
- −$0
- Vacancy / Maint / Mgmt
- −$251
- Net cashflow
- $405
Break-even live
Sensitivity live
| Price | -10% $453 | -5% $429 | +0% $405 | +5% $381 | +10% $357 |
|---|---|---|---|---|---|
| Rent | -10% $311 | -5% $358 | +0% $405 | +5% $452 | +10% $500 |
| Rate | -1.0pp $448 | -0.5pp $427 | base $405 | +0.5pp $383 | +1.0pp $361 |
UW: 25.0% down · 7.5% · 30yr · 1.5% tax · 5.0% vac · 8.0% maint · 8.0% mgmt
Financing live
Cash to close
- Down payment
- $21,225
- Closing costs
- $2,547
- Reserves months
- —
- Total cash needed
- —
Loan-product check · same deal, 3 products live
Conventional
25% down · 7.5% · 30yr
- Down + closing
- —
- Monthly P&I
- —
- Monthly cashflow
- —
- DSCR
- —
- Eligible?
- —
Personal DTI + credit; lowest rate.
DSCR
20% down · 8.5% · 30yr
- Down + closing
- —
- Monthly P&I
- —
- Monthly cashflow
- —
- DSCR
- —
- Eligible?
- —
No personal income docs; deal must DSCR.
Hard money
10% down · 12.0% · 12mo
- Down + closing
- —
- Monthly P&I
- —
- Monthly cashflow
- —
- DSCR
- —
- Eligible?
- —
Short-term bridge; refi at stabilization.
Rent comps 40 comps
| Address | Beds | Baths | Sqft | Rent | $/sqft | DOM | Units | Dist |
|---|---|---|---|---|---|---|---|---|
| 12468 Mendota St Detroit, MI | 2.0 | 1.0 | 1100 | $1,000 | $0.91 | 25d | 1 | 0.12mi |
| 12468 Mendota St Detroit, MI | 2.0 | 1.0 | 1100 | $1,100 | $1.00 | 45d | 1 | 0.12mi |
| 12144 Washburn St Detroit, MI | 3.0 | 1.0 | 1200 | $1,200 | $1.00 | 16d | 1 | 0.15mi |
| 12650 Griggs St Detroit, MI | 3.0 | 2.0 | 1628 | $1,375 | $0.84 | 25d | 1 | 0.17mi |
| 12703 Northlawn St Detroit, MI | 2.0 | 1.0 | 1365 | $1,053 | $0.77 | 21d | 1 | 0.51mi |
| 12303 Cloverlawn St Detroit, MI | 3.0 | 1.5 | 1454 | $1,400 | $0.96 | 45d | 1 | 0.52mi |
| 12775 Plymouth Rd Unit 16 Detroit, MI | 2.0 | 1.0 | 1009 | $825 | $0.82 | 45d | 1 | 0.55mi |
| 10002 Manor Unit 1 Detroit, MI | 2.0 | 1.0 | 1000 | $1,050 | $1.05 | 45d | 1 | 0.64mi |
| 10002 Manor Unit 2 Detroit, MI | 3.0 | 1.0 | 1100 | $1,150 | $1.05 | 45d | 1 | 0.64mi |
| 13620 Kentucky St Detroit, MI | 3.0 | 1.0 | 1248 | $1,200 | $0.96 | 6d | 1 | 0.65mi |
| 13910 Kentucky St Detroit, MI | 2.0 | 1.0 | 1680 | $1,000 | $0.60 | 45d | 1 | 0.71mi |
| 13965 Mendota St Detroit, MI | 3.0 | 1.0 | 1222 | $1,294 | $1.06 | 18d | 1 | 0.72mi |
| 10359 Violetlawn St Unit 1 Detroit, MI | 2.0 | 1.0 | 1200 | $985 | $0.82 | 45d | 1 | 0.80mi |
| 13979 Cherrylawn St Detroit, MI | 3.0 | 1.0 | 1296 | $1,334 | $1.03 | 21d | 1 | 0.84mi |
| 10303 Morley St #1 Detroit, MI | 2.0 | 1.0 | 950 | $950 | $1.00 | 45d | 1 | 0.85mi |
| 9558 Meyers Rd Detroit, MI | 3.0 | 1.0 | 950 | $1,150 | $1.21 | 45d | 1 | 0.88mi |
| 14011 Roselawn St Detroit, MI | 4.0 | 1.5 | 1300 | $1,450 | $1.12 | 18d | 1 | 0.96mi |
| 14011 Roselawn St Detroit, MI | 4.0 | 1.5 | 1300 | $1,450 | $1.12 | 3d | 1 | 0.96mi |
| 12415 Monica St Detroit, MI | 2.0 | 1.0 | 1000 | $1,200 | $1.20 | 45d | 1 | 0.99mi |
| 14242 Ohio St Detroit, MI | 4.0 | 1.0 | 1400 | $1,000 | $0.71 | 45d | 1 | 1.00mi |
| 13620 Tuller St Detroit, MI | 4.0 | 1.0 | 1064 | $1,374 | $1.29 | 14d | 1 | 1.02mi |
| 12123 Santa Rosa Dr Detroit, MI | 2.0 | 1.0 | 1680 | $1,000 | $0.60 | 25d | 1 | 1.05mi |
| 12032 Santa Rosa Dr Unit 1 Detroit, MI | 3.0 | 1.0 | 900 | $1,278 | $1.42 | 0d | 1 | 1.09mi |
| 12663 Stoepel St Detroit, MI | 2.0 | 1.0 | 1100 | $1,050 | $0.95 | 23d | 1 | 1.11mi |
| 12019 Stoepel St Detroit, MI | 2.0 | 1.0 | 1000 | $943 | $0.94 | 6d | 1 | 1.12mi |
| 9355 Ward St Detroit, MI | 3.0 | 1.0 | 1200 | $1,327 | $1.11 | 45d | 1 | 1.14mi |
| 9209 Pinehurst St Detroit, MI | 3.0 | 1.0 | 1589 | $1,500 | $0.94 | 45d | 1 | 1.15mi |
| Ohio St Unit 4 Detroit, MI | 4.0 | 1.5 | 1400 | $750 | $0.54 | 45d | 1 | 1.18mi |
| 9340 Hartwell St Detroit, MI | 3.0 | 1.0 | 1000 | $1,364 | $1.36 | 45d | 1 | 1.25mi |
| 14550 Northlawn St Detroit, MI | 3.0 | 2.0 | 950 | $1,200 | $1.26 | 18d | 1 | 1.27mi |
| 12778 Strathmoor St Detroit, MI | 3.0 | 1.0 | 1597 | $1,150 | $0.72 | 6d | 1 | 1.30mi |
| 9022 Northlawn St Detroit, MI | 2.0 | 1.0 | 1100 | $1,300 | $1.18 | 25d | 1 | 1.33mi |
| 4336 Buena Vista St Detroit, MI | 3.0 | 1.0 | 1300 | $1,100 | $0.85 | 45d | 1 | 1.38mi |
| 4341 Glendale St Detroit, MI | 4.0 | 2.5 | 1832 | $1,680 | $0.92 | 6d | 1 | 1.39mi |
| 14881 Mendota St Detroit, MI | 3.0 | 1.0 | 1026 | $1,100 | $1.07 | 25d | 1 | 1.39mi |
| 13331 Strathmoor St Detroit, MI | 3.0 | 1.0 | 1084 | $1,100 | $1.01 | 18d | 1 | 1.40mi |
| 14656 Roselawn St Detroit, MI | 3.0 | 1.0 | 1000 | $1,200 | $1.20 | 18d | 1 | 1.40mi |
| 12754 Marlowe St Detroit, MI | 3.0 | 2.0 | 1008 | $1,400 | $1.39 | 18d | 1 | 1.40mi |
| 14284 Cruse St Detroit, MI | 3.0 | 1.0 | 1121 | $1,150 | $1.03 | 18d | 1 | 1.41mi |
| 4287 W Grand St Unit 4289 Detroit, MI | 3.0 | 1.0 | 1250 | $1,000 | $0.80 | 45d | 1 | 1.41mi |
Listing history 20 events
-
2026-06-21days on market $84,900 Active 188 DOM
-
2026-06-18days on market $84,900 Active 185 DOM
-
2026-06-17days on market $84,900 Active 184 DOM
-
2026-06-15days on market $84,900 Active 182 DOM
-
2026-06-13days on market $84,900 Active 180 DOM
-
2026-06-13days on market $84,900 Active 179 DOM
-
2026-06-09days on market $84,900 Active 176 DOM
-
2026-06-08days on market $84,900 Active 175 DOM
-
2026-06-07days on market $84,900 Active 174 DOM
-
2026-06-04days on market $84,900 Active 171 DOM
-
2026-06-03days on market $84,900 Active 170 DOM
-
2026-06-01days on market $84,900 Active 168 DOM
-
2026-05-31days on market $84,900 Active 167 DOM
-
2026-04-02price $84,900 661-char remark
Show marketing remark (661 chars)
SECTION 8 TENANT OCCUPIED BRICK CAPE COD HOME LOCATED JUST NORTH OF GRAND RIVER AVENUE AND EAST OF MEYERS ROAD. THIS HOME FEATURES A COVERED FRONT PORCH, INVITING LIVING ROOM WITH FIREPLACE, FORMAL DINING ROOM, HARDWOOD FLOORS THROUGH OUT, THREE GOOD SIZED BEDROOMS, ONE BATHROOM, AND AN UNFINISHED BASEMENT. TENANT RENT IS 1100 AND IS PAID BY SECTION 8 100%. TENANT IS CURRENTLY MONTH TO MONTH BUT WISHES TO STAY. PHOTS ARE FROM 2023, BEFORE THE TENANT MOVED IN. PROPERTY IS SOLD AS-IS. ALL DIMENSIONS ARE ESTIMATED AND SHOULD BE VERIFIED. ALL SHOWINGS REQUIRE A LICENSED AGENT TO BE PRESENT. BUYER TO PAY DETROIT INVESTMENT CO A 295 PROCESSING FEE AT CLOSING.
-
2026-01-30price $88,900 661-char remark
Show marketing remark (661 chars)
SECTION 8 TENANT OCCUPIED BRICK CAPE COD HOME LOCATED JUST NORTH OF GRAND RIVER AVENUE AND EAST OF MEYERS ROAD. THIS HOME FEATURES A COVERED FRONT PORCH, INVITING LIVING ROOM WITH FIREPLACE, FORMAL DINING ROOM, HARDWOOD FLOORS THROUGH OUT, THREE GOOD SIZED BEDROOMS, ONE BATHROOM, AND AN UNFINISHED BASEMENT. TENANT RENT IS 1100 AND IS PAID BY SECTION 8 100%. TENANT IS CURRENTLY MONTH TO MONTH BUT WISHES TO STAY. PHOTS ARE FROM 2023, BEFORE THE TENANT MOVED IN. PROPERTY IS SOLD AS-IS. ALL DIMENSIONS ARE ESTIMATED AND SHOULD BE VERIFIED. ALL SHOWINGS REQUIRE A LICENSED AGENT TO BE PRESENT. BUYER TO PAY DETROIT INVESTMENT CO A 295 PROCESSING FEE AT CLOSING.
-
2026-01-29price $88,900 661-char remark
Show marketing remark (661 chars)
SECTION 8 TENANT OCCUPIED BRICK CAPE COD HOME LOCATED JUST NORTH OF GRAND RIVER AVENUE AND EAST OF MEYERS ROAD. THIS HOME FEATURES A COVERED FRONT PORCH, INVITING LIVING ROOM WITH FIREPLACE, FORMAL DINING ROOM, HARDWOOD FLOORS THROUGH OUT, THREE GOOD SIZED BEDROOMS, ONE BATHROOM, AND AN UNFINISHED BASEMENT. TENANT RENT IS 1100 AND IS PAID BY SECTION 8 100%. TENANT IS CURRENTLY MONTH TO MONTH BUT WISHES TO STAY. PHOTS ARE FROM 2023, BEFORE THE TENANT MOVED IN. PROPERTY IS SOLD AS-IS. ALL DIMENSIONS ARE ESTIMATED AND SHOULD BE VERIFIED. ALL SHOWINGS REQUIRE A LICENSED AGENT TO BE PRESENT. BUYER TO PAY DETROIT INVESTMENT CO A 295 PROCESSING FEE AT CLOSING.
-
2025-12-15$89,900 Active 661-char remark
Show marketing remark (661 chars)
SECTION 8 TENANT OCCUPIED BRICK CAPE COD HOME LOCATED JUST NORTH OF GRAND RIVER AVENUE AND EAST OF MEYERS ROAD. THIS HOME FEATURES A COVERED FRONT PORCH, INVITING LIVING ROOM WITH FIREPLACE, FORMAL DINING ROOM, HARDWOOD FLOORS THROUGH OUT, THREE GOOD SIZED BEDROOMS, ONE BATHROOM, AND AN UNFINISHED BASEMENT. TENANT RENT IS 1100 AND IS PAID BY SECTION 8 100%. TENANT IS CURRENTLY MONTH TO MONTH BUT WISHES TO STAY. PHOTS ARE FROM 2023, BEFORE THE TENANT MOVED IN. PROPERTY IS SOLD AS-IS. ALL DIMENSIONS ARE ESTIMATED AND SHOULD BE VERIFIED. ALL SHOWINGS REQUIRE A LICENSED AGENT TO BE PRESENT. BUYER TO PAY DETROIT INVESTMENT CO A 295 PROCESSING FEE AT CLOSING.
-
2019-01-03soldstatus $420,000
ⓘ Source: listings_history table (triggers on properties + properties_extension) + one-shot
backfill from property_details.listing_events for pre-trigger history.
Tax reassessment forecast MI · Partial reset (capped growth)
- Current annual tax
- $694 · $58/mo
- Projected year-2 tax
- $1,001 · $83/mo
- Expected delta
- +$307/yr (+$26/mo · 44.2%)
ⓘ Screening estimate from a state-policy table — verify with the county assessor before closing.
Climate risk First Street
- Flood 1/10 Low FEMA zone X (unshaded) · 0% chance over 30 yrs
- Wildfire 1/10 Low
- Heat 2/10 Low 7 d/yr ≥97°F today · 13 d/yr by 30 yrs out
- Wind 2/10 Low
- Air quality 3/10 Moderate 2 unhealthy d/yr today · 5 by 30 yrs out
Nearby sold comps map
Loading sold comps map…
Walkable amenities ~0.75 mi
Loading nearby amenities…
Taxation est. · year 1
- Rental income
- $14,334
- − Mortgage interest
- −$4,756
- − Property taxes
- −$694
- − Insurance
- −$424
- − Repairs & maintenance
- −$1,147
- − Management
- −$1,147
- − Depreciation
- −$2,470
- Taxable income
- $3,696
- Est. tax owed @ 24.0%
- −$887
- After-tax cash flow
- $3,975/yr
For passive investors: Depreciation is non-cash, so a rental often shows a tax loss while cash-flowing — sheltering income. Rental losses are passive: they offset passive income freely, and up to $25,000/yr can offset ordinary (W-2) income if you actively participate and your MAGI is under $100k (phasing out to $0 by $150k); unused losses carry forward. On sale, claimed depreciation is recaptured at up to 25%, and gains may owe capital-gains tax (a 1031 exchange can defer both). Figures are a year-1 estimate at your 24.0% rate — not tax advice; consult a CPA.
Schools (NCES district)
- District
- Detroit Public Schools Community District
- NCES district ID
- 2601103
- Math proficiency
- 10% ▼ -2.00%
- Reading proficiency
- 24% ▲ 6.00%
- Median HH income
- $25,815
- Composite
- 13.06/100
- National rank
- #9564
- State rank
- #499 of 540 in MI
Livability — Detroit
- Score
- 73/100
- State rank
- #218
- US rank
- #5427
Category grades
Schools grade is shown separately in the Schools card above.
Census & demographics
- Census place
- Detroit, MI
- County
- Wayne County · 1,562,939 people
- City population
- 572,865
- Metro
- Detroit-Warren-Dearborn, MI
- Population (ZIP)
- 20,696
- Household income
- $34,468
- Rent vs Own
- Severe rent burden
- 1418.0
Population outlook (Wayne County) Hauer SSP2
- Today (2025)
- 1,675,273 people
- By 2030
- 1,620,300 · -3.3%
- By 2040
- 1,502,341 · -10.3%
- By 2050
- 1,384,039 · -17.4%
- By 2075
- 1,124,592 · -32.9%
- By 2100
- 881,193 · -47.4%
Race, ethnicity, and origin ACS 2023
- Neighborhood character
- Predominantly Black (86%)
- Race & ethnicity
- Black 86% Two or more races 7% Hispanic / Latino 5% White 4% Native American 2%
- Hispanic origin (detail)
- Mexican 4%
- Common ancestry
- Hispanic 1% Romanian 1%
- Foreign-born
- 2% · Canada
- Languages at home
- 95% English-only · Spanish 4%
Political lean MEDSL · Wayne
- 2024 margin
- Strong D (+29.0) · D 62.7% · R 33.7% · Other 3.6%
- 2008→2024 swing
- -20.5pp toward R · 2008: 49.5pp · 2024: 29.0pp
- All cycles
- 2024: D+29.0 2020: D+38.1 2016: D+37.3 2012: D+46.9 2008: D+49.5
Not yet ingested
- Civics
- —
Market trends
- HPI YoY
- ▲ 36.51%
- Current HPI
- 234.0465
- Rent YoY
- —
- Metro
- Detroit-Warren-Dearborn, MI
- State GDP YoY
- ▲ 1.37%
- F500 in state
- 28
Industry mix (Fortune 500 HQ in MI)
| Industry | F500 HQs | Revenue |
|---|---|---|
| Automotive Parts | 3 | $48B |
|
||
| Automotive | 2 | $372B |
|
||
| Chemicals | 1 | $45B |
|
||
| Automotive Retail | 1 | $29B |
|
||
| Healthcare / Medical Devices | 1 | $23B |
|
||
| Automotive Technology | 1 | $20B |
|
||
Price history
-79.8% since first listed7 events — show timeline
- 2026-04-02 Price Changed $84,900 MiRealSource-MiMLS
- 2026-04-02 Price Changed $84,900 REALCOMP
- 2026-01-30 Price Changed $88,900 MiRealSource-MiMLS
- 2026-01-29 Price Changed $88,900 REALCOMP
- 2025-12-15 Listed $89,900 REALCOMP
- 2025-12-15 Listed $89,900 MiRealSource-MiMLS
- 2019-01-03 Sold (Public Records) $420,000 Public Records
Property tax history
-6.8%/yrLatest (2025): $694 · -53.2% YoY. Source: county tax records.
Cash-flow waterfall
monthlySold comps — $/sqft
last 12 mo · ≤1 miLoading sold comps…