17901 Dove Rd · Phillipsburg, MO
Flood risk 1/10 · Minimal
- FEMA flood zone
- X (unshaded)
- Chance of flooding over 30 yrs
- 0.0%
- Est. flood insurance / yr
- $507 – $1,088
Fire risk 5/10 · Moderate
- Est. fire insurance / yr
- $1,054 – $1,958
Heat risk 4/10 · Minor
- Hot days now (above 106°F)
- 7 days/yr
- Hot days in 30 yrs
- 19 days/yr
Wind risk 2/10 · Minimal
- Chance of severe wind over 30 yrs
- 1.0%
Air-quality risk 1/10 · Minimal
- Unhealthy air days now
- 0 days/yr
- Unhealthy air days in 30 yrs
- 0 days/yr
Risk factors via First Street. Map © Google.
Why this score? — see what drove the D grade
The composite is a weighted blend of 9 inputs, each scored 0–100. Each bar is that input's sub-score; the figure is the points it added to the 100-point composite (weight × sub-score).
- Cash flow +13.0/30.0
- ARV discount +7.5/15.0
- Appreciation +6.6/10.0
- DSCR +3.9/10.0
- Schools +2.7/10.0
- Livability +2.6/5.0
- 1% rule +2.5/10.0
- Rent growth +2.5/5.0
- Condition / age +2.5/5.0
$149,900
🖨 Deal sheet (PDF) 📄 Offer letter ✓ Due diligence
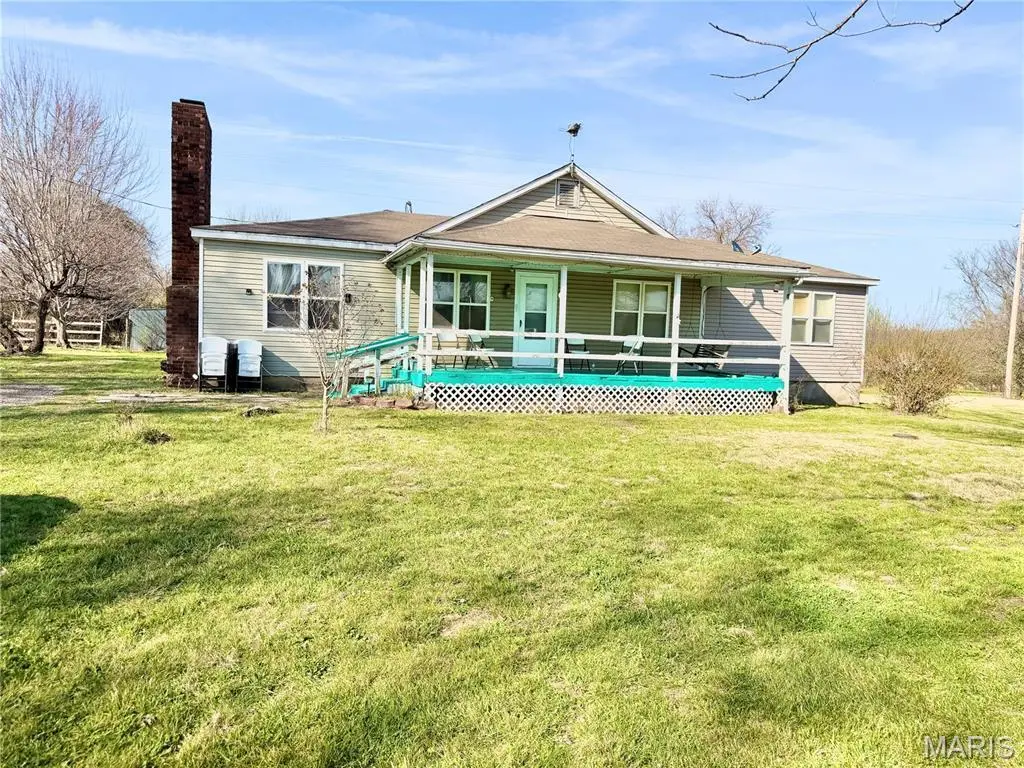
Listing remarks
If you’re seeking a move-in-ready home on approximately 3.25 acres of level, open land, this property is a must-see. Conveniently located just minutes from town and situated on a paved road, this charming residence features an oversized covered front porch—perfect for enjoying your morning coffee on a porch swing. Upon entry, you are welcomed into a spacious living room highlighted by a stunning rock fireplace, ideal for both relaxing and entertaining. On one side of the home, two bedrooms (1 nonconforming) are connected by a Jack-and-Jill bathroom. On the opposite side, you’ll find a generously sized dining area and kitchen. Just off the dining room is a large wood deck,
Key facts
- Large wood deck
- Walk-in closet
- Rock fireplace
Tags
Neighborhood map
What this means for you Summary
Snapshot
- This is a 3-bed/2.0-bath other listed at $150k.
Deal economics
- At list price, monthly cash flow is $-8 ($-91/yr) — negative.
- To cash-flow at today's rent, offer at most $149k (0.9% below list).
- To meet the 1% rule (rent ≥ 1% of price), the offer needs to be $112k (25.2% below list).
- Recommended offer: $112k (25.2% below list) — sets the bar for 1% rule.
Location & tenants
- Location reads 52/100 on livability (#845 in MO) — a working-class tenant base; expect higher turnover. Strengths: cost of living A+, housing A+; Watch: crime F, amenities F, commute F.
- Lebanon R-III (town): math 29% / reading 35% proficiency, ranked #256 of 324 in MO (top 79%) — families likely to look elsewhere, expect single-tenant / working-renter base with shorter leases.
- Zoned schools: Joe D. Esther Elem. (949 students, 66% FRL); Lebanon Middle School (math 33% / reading 35%, grade F, #255 of 391 statewide, top 66%, 921 students, 59% FRL); Lebanon Sr. High (math 16% / reading 34%, grade F, #435 of 521 statewide, top 83%, 1,474 students, 50% FRL).
- Market conditions: 13 active listings in the ZIP; 61 units permitted in Laclede County in 2024 (0 in 5+ unit buildings).
Forward outlook
- In year one you build about $6k of equity ($1k loan paydown + $5k appreciation (3.2% local appreciation)).
- Laclede County population projected at -13% by 2050 — secular population decline; favor cash flow + early exit over multi-decade hold.
- At projected returns (3.2% appreciation + 3.0% rent growth), your $42k cash investment doubles in ~6 years — after that, you're playing with house money.
- By year 6, paydown + projected appreciation supports a ~$31k cash-out refi (75% LTV) — recoverable capital for the next deal without selling this one.
Negotiation context
- It's been on market 15 days — a 2% lower offer ($148k) is reasonable based on typical stale-listing flexibility.
Risks & watch-outs
- Watch-outs: built in 1950 — expect roof / HVAC / electrical / plumbing capex.
- Climate carrying-cost: moderate wildfire risk — expect insurance premiums to compound above CPI over the hold.
Questions for the listing agent
- What do current leases actually rent for vs. the listed asking? Can we see a recent rent roll and the last 12 months of T-12 income?
- Built in 1950 — when were the roof, HVAC, electrical panel, plumbing, and water heater last replaced?
- Is there a deadline driving the sale (1031 exchange, divorce, estate, relocation)? That informs how much negotiation room exists.
- Schools are F-rated, which usually means shorter tenancies and higher turnover. Who's the typical renter profile here, and what's been the actual vacancy rate?
- Crime grade is F in this area — have there been break-ins, vandalism, or insurance claims at this property in the last 3 years? What carrier currently insures it and at what premium?
- The area grade is low — what's the realistic commute time and amenity access for the typical tenant pool here? Any planned neighborhood developments (good or bad) we should know about?
- What's the average days-on-market for RENTAL listings here right now (not sales)? A rising rental-DOM trend means longer vacancies and softer asking-rent achievability than the comps imply.
- What's the recent tenant-quality profile in this submarket — average credit score on applications, eviction rate, late-payment / NSF rate, and stable-employment percentage? A property-management company in the area should have these aggregated.
- How much new for-sale + rental construction is in the pipeline within 1–3 miles? Heavy new supply typically softens prices + rents 12–24 months out; constrained supply supports both.
Investment metrics
- 1% rule
- 0.75% ✗
- Cap rate
- 6.23%
- Cash-on-cash
- -0.22%
- DSCR
- 0.99
- GRM
- 11.1
CMA / ARV
No comps found within radius.
Projected returns pro-forma
3.25% appreciation · 3.0% rent growth · sell at horizon
- IRR
- 8.0%
- Equity multiple
- 1.46×
- Total profit
- $19,483
- Equity at exit
- $69,506
- IRR
- 10.5%
- Equity multiple
- 2.61×
- Total profit
- $67,532
- Equity at exit
- $108,783
Cash invested: $41,972 (down + closing). Projections, not guarantees.
Landlord ↔ Tenant lean methodology
- Overall (STATE)
- 81 Strongly Landlord-Friendly
- State Missouri
- 81 Strongly Landlord-Friendly · R+10
- County
- — inherits STATE
- City
- — inherits STATE
ZIP-level market 65722
- Home prices YoY
- 1.5%
- Active inventory
- 13
- Price-to-rent
- 11.1×
Monthly cashflow live
- Estimated rent
- $1,121 medium interval (Pro) →
- Mortgage (P&I)
- −$786
- Tax from tax record
- −$44 /mo · $531/yr
- Insurance
- −$62
- HOA
- −$0
- Vacancy / Maint / Mgmt
- −$235
- Net cashflow
- $-8
Break-even live
Sensitivity live
| Price | -10% $77 | -5% $35 | +0% $-8 | +5% $-50 | +10% $-92 |
|---|---|---|---|---|---|
| Rent | -10% $-96 | -5% $-52 | +0% $-8 | +5% $37 | +10% $81 |
| Rate | -1.0pp $68 | -0.5pp $31 | base $-8 | +0.5pp $-46 | +1.0pp $-86 |
UW: 25.0% down · 7.5% · 30yr · 1.5% tax · 5.0% vac · 8.0% maint · 8.0% mgmt
Financing live
Cash to close
- Down payment
- $37,475
- Closing costs
- $4,497
- Reserves months
- —
- Total cash needed
- —
Loan-product check · same deal, 3 products live
Conventional
25% down · 7.5% · 30yr
- Down + closing
- —
- Monthly P&I
- —
- Monthly cashflow
- —
- DSCR
- —
- Eligible?
- —
Personal DTI + credit; lowest rate.
DSCR
20% down · 8.5% · 30yr
- Down + closing
- —
- Monthly P&I
- —
- Monthly cashflow
- —
- DSCR
- —
- Eligible?
- —
No personal income docs; deal must DSCR.
Hard money
10% down · 12.0% · 12mo
- Down + closing
- —
- Monthly P&I
- —
- Monthly cashflow
- —
- DSCR
- —
- Eligible?
- —
Short-term bridge; refi at stabilization.
Listing history 4 events
-
2026-04-15status Pending
-
2026-04-07historical Active Under Contract
-
2026-03-30$149,900 Active
-
2005-12-30soldstatus
ⓘ Source: listings_history table (triggers on properties + properties_extension) + one-shot
backfill from property_details.listing_events for pre-trigger history.
Tax reassessment forecast MO · Resets to sale price
- Current annual tax
- $531 · $44/mo
- Projected year-2 tax
- $1,454 · $121/mo
- Expected delta
- +$923/yr (+$77/mo · 173.8%)
ⓘ Screening estimate from a state-policy table — verify with the county assessor before closing.
Climate risk First Street
- Flood 1/10 Low FEMA zone X (unshaded) · 0% chance over 30 yrs
- Wildfire 5/10 Major
- Heat 4/10 Moderate 7 d/yr ≥106°F today · 19 d/yr by 30 yrs out
- Wind 2/10 Low 100% chance of damaging wind over 30 yrs
- Air quality 1/10 Low 0 unhealthy d/yr today · 0 by 30 yrs out
Nearby sold comps map
Loading sold comps map…
Walkable amenities ~0.75 mi
Loading nearby amenities…
Taxation est. · year 1
- Rental income
- $13,447
- − Mortgage interest
- −$8,397
- − Property taxes
- −$531
- − Insurance
- −$750
- − Repairs & maintenance
- −$1,076
- − Management
- −$1,076
- − Depreciation
- −$4,361
- Taxable loss
- −$2,743
- Est. tax savings @ 24.0%
- +$658
- After-tax cash flow
- $568/yr
For passive investors: Depreciation is non-cash, so a rental often shows a tax loss while cash-flowing — sheltering income. Rental losses are passive: they offset passive income freely, and up to $25,000/yr can offset ordinary (W-2) income if you actively participate and your MAGI is under $100k (phasing out to $0 by $150k); unused losses carry forward. On sale, claimed depreciation is recaptured at up to 25%, and gains may owe capital-gains tax (a 1031 exchange can defer both). Figures are a year-1 estimate at your 24.0% rate — not tax advice; consult a CPA.
Schools (NCES district)
- District
- Lebanon R-III
- NCES district ID
- 2918270
- Math proficiency
- 29% ▼ -10.00%
- Reading proficiency
- 35% ▼ -8.00%
- Median HH income
- $38,352
- Composite
- 26.73/100
- National rank
- #7145
- State rank
- #256 of 324 in MO
Livability — Phillipsburg
- Score
- 52/100
- State rank
- #845
- US rank
- #24713
Category grades
Schools grade is shown separately in the Schools card above.
Census & demographics
- Population (ZIP)
- 1,404
Population outlook (Laclede County) Hauer SSP2
- Today (2025)
- 34,730 people
- By 2030
- 33,985 · -2.1%
- By 2040
- 32,213 · -7.2%
- By 2050
- 30,189 · -13.1%
- By 2075
- 24,782 · -28.6%
- By 2100
- 18,554 · -46.6%
Race, ethnicity, and origin ACS 2023
- Neighborhood character
- Predominantly White (92%)
- Race & ethnicity
- White 92% Hispanic / Latino 3% Two or more races 3%
- Common ancestry
- Iranian 5% American 3% Italian 1%
- Foreign-born
- 4%
- Languages at home
- 96% English-only · Other Indo-European 3% Russian/Polish/Slavic 1%
Political lean MEDSL · Laclede
- 2024 margin
- Solid R (+66.8) · D 16.1% · R 82.9%
- 2008→2024 swing
- +212.7pp toward D · 2008: -279.5pp · 2024: -66.8pp
- All cycles
- 2024: R+66.8 2020: R+65.4 2016: R+64.5 2012: R+44.5 2008: R+279.5
Not yet ingested
- Civics
- —
Market trends
- HPI YoY
- ▲ 3.25%
- Current HPI
- 224.0849
- Rent YoY
- —
- Metro
- —
- State GDP YoY
- ▲ 1.84%
- F500 in state
- 20
Industry mix (Fortune 500 HQ in MO)
| Industry | F500 HQs | Revenue |
|---|---|---|
| Healthcare | 1 | $163B |
|
||
| Insurance | 1 | $21B |
|
||
| Industrial Technology | 1 | $17B |
|
||
| Retail | 1 | $16B |
|
||
| Industrial Distribution | 1 | $10B |
|
||
| Utilities | 1 | $9B |
|
||
Price history
4 events — show timeline
- 2026-04-15 Pending — MARIS as Distributed by MLS Grid
- 2026-04-07 Contingent — MARIS as Distributed by MLS Grid
- 2026-03-30 Listed $149,900 MARIS as Distributed by MLS Grid
- 2005-12-30 Sold (Public Records) — Public Records
Property tax history
+4.1%/yrLatest (2025): $531 · +0.0% YoY. Source: county tax records.
Cash-flow waterfall
monthlySold comps — $/sqft
last 12 mo · ≤1 miLoading sold comps…