1846 51st St S · Gulfport, FL
Flood risk 1/10 · Minimal
- FEMA flood zone
- X (unshaded)
- Chance of flooding over 30 yrs
- 0.0%
- Est. flood insurance / yr
- $507 – $1,088
Fire risk 1/10 · Minimal
- Est. fire insurance / yr
- $947 – $1,759
Heat risk 10/10 · Severe
- Hot days now (above 106°F)
- 7 days/yr
- Hot days in 30 yrs
- 25 days/yr
Wind risk 10/10 · Severe
- Chance of severe wind over 30 yrs
- 99.0%
Air-quality risk 4/10 · Minor
- Unhealthy air days now
- 4 days/yr
- Unhealthy air days in 30 yrs
- 4 days/yr
Risk factors via First Street. Map © Google.
Why this score? — see what drove the D+ grade
The composite is a weighted blend of 9 inputs, each scored 0–100. Each bar is that input's sub-score; the figure is the points it added to the 100-point composite (weight × sub-score).
- ARV discount +14.4/15.0
- Cash flow +13.9/30.0
- Schools +4.3/10.0
- DSCR +4.2/10.0
- Livability +4.0/5.0
- 1% rule +2.6/10.0
- Condition / age +2.5/5.0
- Rent growth +2.3/5.0
- Appreciation +0.0/10.0
$325,000
🖨 Deal sheet 📄 Offer letter ✓ Due diligence
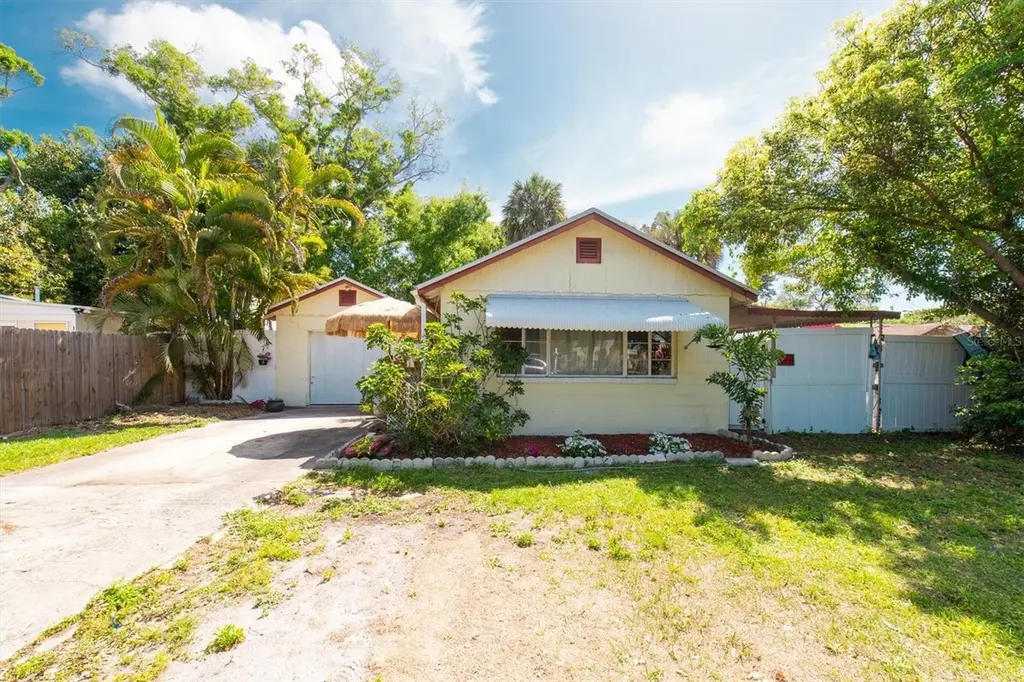
Listing remarks
Welcome to your new home! This Gulfport home features 3 bedrooms and 1 bath with a bonus room. As you enter this home you will note some of the original work from 1948 in the living room. Some windows have been updated, roof was done in 2020, a/c is newer, water heater is newer. Come and put your special touches on this home and make it your own. Your home is not located in a flood zone. This home was built in 1948, and is a part of Gulfport history. Close to restaurants, schools, Tangerine park, where they hold festival's.
Key facts
- Updated windows
- Newer roof
- Bonus room
Tags
Property features AI
Finance
- Other: Lease restrictions apply
- HOA & community: Street lights in the community; Pets allowed (cats and dogs)
Exterior
- Parking: Attached garage (1 car)
- Utilities: Public water; Public sewer; Electricity connected; Cable connected
- Home design: Single-family residence; One story; Faces west; Residential property
- Construction: Block construction; Shingle roof; Slab foundation; Built on a 60 x 85 lot (approximately 0.12 acre)
- Exterior features: Storage; Wood fencing; Mature landscaping with trees
Interior
- Kitchen: Range; Refrigerator
- Bedrooms: 3 bedrooms
- Flooring: Concrete floors; Tile floors
- Bathrooms: 1 full bathroom
- Heating & cooling: Central heating (electric); Central air conditioning
- Interior features: Eat-in kitchen; Bonus room
- Laundry & utility: Outside laundry
Neighborhood map
What this means for you Summary
Snapshot
- This is a 3-bed/1.0-bath single-family listed at $325k.
Deal economics
- At list price, monthly cash flow is $35 ($423/yr) — positive.
- The deal already cash-flows at list — no discount required.
- To meet the 1% rule (rent ≥ 1% of price), the offer needs to be $246k (24.4% below list).
- Recommended offer: $246k (24.4% below list) — sets the bar for 1% rule.
- Cap rate 6.4% vs local median 2.0% in Gulfport — top-decile yield for the area; either an underpriced asset or a hidden risk that comps aren't pricing in. Stress-test before assuming the spread holds.
Location & tenants
- Location reads 79/100 on livability (#151 in FL, #2,285 nationally) — a middle-class / working-renter tenant base. Strengths: commute A+, housing A+, health & safety A+; Watch: crime C-, schools D, amenities D.
- Pinellas (suburban): math 51% / reading 51% proficiency, ranked #31 of 73 in FL (top 42%) — acceptable for families but not a draw, mixed tenant base, ~2y average lease.
- Market conditions: Rents soft (-0.6%/yr); 458 active listings in the ZIP; 40 comparable units currently listed for rent nearby; rentals leasing fast (median 12d on market — plan ~1-2 weeks tenant-placement turnaround); 2,676 units permitted in Pinellas County in 2024 (1,422 in 5+ unit buildings).
- This rent runs 42% of the median local income ($70k/yr) — at the standard rent-burdened threshold; future hikes will face affordability resistance.
Forward outlook
- Local home prices are declining (-3.0%/yr); year-one equity from $2k of loan paydown is wiped out by about $10k of value loss. Plan a longer hold.
- Pinellas County population projected at +14% by 2050 — modest demand growth; plan on rents tracking national, not racing it.
Negotiation context
- It's been on market 78 days — a 6% lower offer ($306k) is reasonable based on typical stale-listing flexibility.
- 2 sale attempts since 5y ago with the ask held roughly flat each time — persistent listings suggest the price (not the market) is what's stuck; bring a comps-based counter.
- Current owner paid $34k; list at $325k implies a 870% gain — meaningful room to come down on a strong offer.
Risks & watch-outs
- Watch-outs: built in 1948 — expect roof / HVAC / electrical / plumbing capex.
- Climate carrying-cost: severe wind risk, 99% chance of damaging wind over 30y; extreme-heat days projected 7→25/yr by 2055 (HVAC capex compounding) — expect insurance premiums to compound above CPI over the hold.
Questions for the listing agent
- It's been on market 78 days. Have you received any prior offers? Is the seller open to a 24% concession, seller financing, or rate buy-down credit?
- Built in 1948 — when were the roof, HVAC, electrical panel, plumbing, and water heater last replaced?
- Why hasn't it sold? Are there any deal-killer items the seller is aware of (foundation, flood, title, zoning, code violations)?
- Is there a deadline driving the sale (1031 exchange, divorce, estate, relocation)? That informs how much negotiation room exists.
- Schools are D-rated, which usually means shorter tenancies and higher turnover. Who's the typical renter profile here, and what's been the actual vacancy rate?
- The area grade is low — what's the realistic commute time and amenity access for the typical tenant pool here? Any planned neighborhood developments (good or bad) we should know about?
- What's the average days-on-market for RENTAL listings here right now (not sales)? A rising rental-DOM trend means longer vacancies and softer asking-rent achievability than the comps imply.
- What's the recent tenant-quality profile in this submarket — average credit score on applications, eviction rate, late-payment / NSF rate, and stable-employment percentage? A property-management company in the area should have these aggregated.
- How much new for-sale + rental construction is in the pipeline within 1–3 miles? Heavy new supply typically softens prices + rents 12–24 months out; constrained supply supports both.
Investment metrics
- 1% rule
- 0.76% ✗
- Cap rate
- 6.42%
- Cash-on-cash
- 0.47%
- DSCR
- 1.02
- GRM
- 11.0
CMA / ARV
- ARV (on-the-fly)
- $383,435
- Comps found
- 12
Show comp detail 12 sales within ~0.75 mi
| Address | Dist | Beds/Ba | Sqft | Sold | Price | $/sf | Match |
|---|---|---|---|---|---|---|---|
| 5004 23rd Ave S | 0.26mi | 3/1.0 | 1,090 (-1%) | 1mo | $255,000 | $234 | 84 |
| 1720 Scranton St S | 0.44mi | 2/1.5 (-1) | 1,108 (+0%) | 2mo | $379,000 | $342 | 70 |
| 2411 45th St S | 0.55mi | 3/1.0 | 1,125 (+2%) | 3mo | $300,000 | $267 | 69 |
| 2649 46th St S | 0.64mi | 2/1.0 (-1) | 1,097 (-1%) | 2mo | $425,000 | $387 | 62 |
| 4533 27th Ave S | 0.67mi | 3/2.0 | 1,112 (+1%) | 2mo | $420,000 | $378 | 62 |
| 2612 46th St S | 0.60mi | 2/2.0 (-1) | 1,063 (-4%) | 0mo | $440,000 | $414 | 56 |
| 5020 27th Ave S | 0.54mi | 2/1.0 (-1) | 1,006 (-9%) | 1mo | $315,000 | $313 | 54 |
| 4659 9th Ave S | 0.75mi | 3/2.0 | 1,060 (-4%) | 3mo | $295,000 | $278 | 52 |
| 5406 11th Ave S | 0.64mi | 3/2.0 | 1,200 (+9%) | 2mo | $459,000 | $383 | 50 |
| 2405 44th St S | 0.59mi | 2/1.0 (-1) | 1,000 (-10%) | 3mo | $195,000 | $195 | 50 |
| 2655 Miriam St S | 0.66mi | 2/1.0 (-1) | 1,001 (-9%) | 1mo | $409,000 | $409 | 47 |
| 5325 11th Ave S | 0.64mi | 2/1.5 (-1) | 965 (-13%) | 1mo | $335,000 | $347 | 41 |
Match score weights: distance 35% · size 25% · config 20% · recency 20%. Top-matched comps best support the ARV.
Projected returns pro-forma
-3.0% appreciation · 0.0% rent growth · sell at horizon
- IRR
- -18.5%
- Equity multiple
- 0.36×
- Total profit
- $-57,788
- Equity at exit
- $48,459
- IRR
- -17.1%
- Equity multiple
- 0.17×
- Total profit
- $-75,947
- Equity at exit
- $28,100
Cash invested: $91,000 (down + closing). Projections, not guarantees.
Landlord ↔ Tenant lean methodology
- Overall (STATE)
- 87 Strongly Landlord-Friendly
- State Florida
- 87 Strongly Landlord-Friendly · R+3
- County
- — inherits STATE
- City
- — inherits STATE
ZIP-level market 33707
- Rents YoY
- -0.6%
- Active inventory
- 458
- Price-to-rent
- 11.0×
Monthly cashflow live
- Estimated rent
- $2,456 high interval (Pro) →
- Mortgage (P&I)
- −$1,704
- Tax from tax record
- −$65 /mo · $786/yr
- Insurance
- −$135
- HOA
- −$0
- Vacancy / Maint / Mgmt
- −$516
- Net cashflow
- $35
Break-even live
UW: 25.0% down · 7.5% · 30yr · 1.5% tax · 5.0% vac · 8.0% maint · 8.0% mgmt
Financing live
Cash to close
- Down payment
- $81,250
- Closing costs
- $9,750
- Reserves months
- —
- Total cash needed
- —
Loan-product check · same deal, 3 products live
Conventional
25% down · 7.5% · 30yr
- Down + closing
- —
- Monthly P&I
- —
- Monthly cashflow
- —
- DSCR
- —
- Eligible?
- —
Personal DTI + credit; lowest rate.
DSCR
20% down · 8.5% · 30yr
- Down + closing
- —
- Monthly P&I
- —
- Monthly cashflow
- —
- DSCR
- —
- Eligible?
- —
No personal income docs; deal must DSCR.
Hard money
10% down · 12.0% · 12mo
- Down + closing
- —
- Monthly P&I
- —
- Monthly cashflow
- —
- DSCR
- —
- Eligible?
- —
Short-term bridge; refi at stabilization.
Rent comps 40 comps
| Address | Beds | Baths | Sqft | Rent | $/sqft | DOM | Units | Dist |
|---|---|---|---|---|---|---|---|---|
| 1933 47th St S Saint Petersburg, FL | 2.0 | 1.0 | 816 | $1,595 | $1.95 | 4d | 1 | 0.26mi |
| 1701 53rd St S Gulfport, FL | 3.0 | 1.0 | 994 | $2,800 | $2.82 | 4d | 1 | 0.27mi |
| 2402 52nd St S Gulfport, FL | 2.0 | 2.0 | 1028 | $3,000 | $2.92 | 4d | 1 | 0.33mi |
| 1922 55th St S Gulfport, FL | 2.0 | 1.0 | 864 | $2,500 | $2.89 | 4d | 1 | 0.35mi |
| 4618 20th Ave S Saint Petersburg, FL | 2.0 | 1.0 | 921 | $1,800 | $1.95 | 2d | 1 | 0.37mi |
| 4631 Queensboro Ave S St Petersburg, FL | 3.0 | 2.0 | 1094 | $2,600 | $2.38 | 10d | 1 | 0.38mi |
| 4631 Queensboro Ave S Unit 4631 St. Petersburg, FL | 3.0 | 2.0 | 1094 | $2,600 | $2.38 | 7d | 1 | 0.38mi |
| 4601 22nd Ave S Saint Petersburg, FL | 1.0–2.0 | 1.0 | 872 | $1,349 | $1.55 | 1d | 3 | 0.38mi |
| 2412 53rd St S Unit A Gulfport, FL | 3.0 | 1.0 | 821 | $2,250 | $2.74 | 24d | 1 | 0.38mi |
| 4616 22nd Ave S Saint Petersburg, FL | 2.0 | 1.0 | 1200 | $2,400 | $2.00 | 24d | 1 | 0.42mi |
| 4665 Yarmouth Ave S Saint Petersburg, FL | 2.0 | 1.0 | 826 | $1,950 | $2.36 | 24d | 1 | 0.45mi |
| 2506 54th St S Gulfport, FL | 2.0 | 1.0 | 938 | $1,800 | $1.92 | 24d | 1 | 0.46mi |
| 2506 54th St S Gulfport, FL | 2.0 | 1.0 | 876 | $1,800 | $2.05 | 7d | 1 | 0.46mi |
| 4933 13th Ave S Gulfport, FL | 2.0 | 1.0 | 939 | $2,200 | $2.34 | 20d | 1 | 0.48mi |
| 5618 20th Ave S Gulfport, FL | 3.0 | 2.0 | 1289 | $3,000 | $2.33 | 24d | 1 | 0.50mi |
| 5713 21st Ave S Gulfport, FL | 2.0 | 1.0 | 800 | $1,750 | $2.19 | 24d | 1 | 0.57mi |
| 2044 44th St S Saint Petersburg, FL | 3.0 | 2.0 | 1384 | $2,600 | $1.88 | 21d | 1 | 0.58mi |
| 5609 15th Ave S Gulfport, FL | 3.0 | 2.0 | 1453 | $2,925 | $2.01 | 24d | 1 | 0.58mi |
| 5715 21st Ave S Gulfport, FL | 2.0 | 1.0 | 800 | $2,000 | $2.50 | 17d | 1 | 0.58mi |
| 1721 58th St S Gulfport, FL | 3.0 | 2.0 | 1412 | $2,400 | $1.70 | 3d | 1 | 0.65mi |
| 2865 51st St S Gulfport, FL | 2.0 | 1.0 | 944 | $1,900 | $2.01 | 11d | 1 | 0.65mi |
| 2865 51st St S Unit 5 Gulfport, FL | 2.0 | 1.0 | 944 | $1,900 | $2.01 | 13d | 1 | 0.65mi |
| 4327 17th Ave S Saint Petersburg, FL | 2.0 | 1.0 | 880 | $2,500 | $2.84 | 24d | 1 | 0.66mi |
| 4801 10th Ave S Unit 1 St. Petersburg, FL | 3.0 | 1.0 | 1100 | $2,200 | $2.00 | 24d | 1 | 0.67mi |
| 4700 10th Ave S Saint Petersburg, FL | 3.0 | 2.0 | 1300 | $2,500 | $1.92 | 20d | 1 | 0.67mi |
| 4700 10th Ave S Unit 1 St. Petersburg, FL | 4.0 | 2.0 | 1300 | $2,650 | $2.04 | 24d | 1 | 0.67mi |
| 2800 47th St S Gulfport, FL | 2.0 | 1.0 | 890 | $2,300 | $2.58 | 4d | 1 | 0.68mi |
| 2800 Tifton St S Gulfport, FL | 3.0 | 2.0 | 1472 | $3,500 | $2.38 | 24d | 1 | 0.70mi |
| 1543 43rd St S Saint Petersburg, FL | 4.0 | 2.0 | 1198 | $3,495 | $2.92 | 4d | 1 | 0.70mi |
| 1628 43rd St S Saint Petersburg, FL | 3.0 | 2.0 | 1045 | $2,100 | $2.01 | 24d | 1 | 0.73mi |
| 2008 59th St S Gulfport, FL | 2.0 | 1.0 | 1024 | $2,300 | $2.25 | 4d | 1 | 0.73mi |
| 1327 43rd St S Saint Petersburg, FL | 3.0 | 1.5 | 959 | $2,250 | $2.35 | 4d | 1 | 0.73mi |
| 4537 10th Ave S Saint Petersburg, FL | 4.0 | 2.0 | 1046 | $2,690 | $2.57 | 4d | 1 | 0.75mi |
| 4421 11th Ave S Saint Petersburg, FL | 3.0 | 2.0 | 945 | $2,000 | $2.12 | 4d | 1 | 0.75mi |
| 5702 27th Ave S Gulfport, FL | 3.0 | 2.0 | 1407 | $3,300 | $2.35 | 24d | 1 | 0.75mi |
| 800 51st St S Gulfport, FL | 3.0 | 2.0 | 1258 | $3,200 | $2.54 | 4d | 1 | 0.77mi |
| 5708 27th Ave S Gulfport, FL | 2.0 | 1.0 | 1407 | $3,000 | $2.13 | 4d | 1 | 0.77mi |
| 5850 24th Ave S Gulfport, FL | 3.0 | 2.0 | 1410 | $3,000 | $2.13 | 24d | 1 | 0.78mi |
| 2626 58th St S Gulfport, FL | 2.0 | 1.0 | 900 | $2,050 | $2.28 | 4d | 1 | 0.78mi |
| 3017 49th St S Unit 12 Gulfport, FL | 2.0 | 1.0 | 750 | $1,600 | $2.13 | 1d | 1 | 0.79mi |
Listing history 15 events
-
2026-06-18days on market $325,000 Active 78 DOM
-
2026-06-17days on market $325,000 Active 77 DOM
-
2026-06-16days on market $325,000 Active 76 DOM
-
2026-06-15days on market $325,000 Active 75 DOM
-
2026-06-13days on market $325,000 Active 73 DOM
-
2026-06-09days on market $325,000 Active 69 DOM
-
2026-06-08days on market $325,000 Active 68 DOM
-
2026-06-07days on market $325,000 Active 67 DOM
-
2026-06-04days on market $325,000 Active 64 DOM
-
2026-06-03days on market $325,000 Active 63 DOM
-
2026-06-01days on market $325,000 Active 61 DOM
-
2026-05-31days on market $325,000 Active 60 DOM
-
2026-04-01$325,000 Active
-
2021-10-17$254,999 Active
-
1985-12-01soldstatus $33,500
ⓘ Source: listings_history table (triggers on properties + properties_extension) + one-shot
backfill from property_details.listing_events for pre-trigger history.
Tax reassessment forecast FL · Resets to sale price
- Current annual tax
- $786 · $65/mo
- Projected year-2 tax
- $2,698 · $225/mo
- Expected delta
- +$1,912/yr (+$159/mo · 243.4%)
ⓘ Screening estimate from a state-policy table — verify with the county assessor before closing.
Climate risk First Street
- Flood 1/10 Low FEMA zone X (unshaded) · 0% chance over 30 yrs
- Wildfire 1/10 Low
- Heat 10/10 Extreme 7 d/yr ≥106°F today · 25 d/yr by 30 yrs out
- Wind 10/10 Extreme 99% chance of damaging wind over 30 yrs
- Air quality 4/10 Moderate 4 unhealthy d/yr today · 4 by 30 yrs out
Nearby sold comps map
Loading sold comps map…
Walkable amenities ~0.75 mi
Loading nearby amenities…
Taxation est. · year 1
- Rental income
- $29,476
- − Mortgage interest
- −$18,205
- − Property taxes
- −$786
- − Insurance
- −$1,625
- − Repairs & maintenance
- −$2,358
- − Management
- −$2,358
- − Depreciation
- −$9,455
- Taxable loss
- −$5,310
- Est. tax savings @ 24.0%
- +$1,274
- After-tax cash flow
- $1,698/yr
For passive investors: Depreciation is non-cash, so a rental often shows a tax loss while cash-flowing — sheltering income. Rental losses are passive: they offset passive income freely, and up to $25,000/yr can offset ordinary (W-2) income if you actively participate and your MAGI is under $100k (phasing out to $0 by $150k); unused losses carry forward. On sale, claimed depreciation is recaptured at up to 25%, and gains may owe capital-gains tax (a 1031 exchange can defer both). Figures are a year-1 estimate at your 24.0% rate — not tax advice; consult a CPA.
Schools (NCES district)
- District
- Pinellas
- NCES district ID
- 1201560
- Math proficiency
- 51% ▼ -5.00%
- Reading proficiency
- 51% ▼ -3.00%
- Median HH income
- $46,270
- Composite
- 43.27/100
- National rank
- #3046
- State rank
- #31 of 73 in FL
Livability — Gulfport
- Score
- 79/100
- State rank
- #151
- US rank
- #2285
Category grades
Schools grade is shown separately in the Schools card above.
Census & demographics
- Census place
- Gulfport, FL
- County
- Pinellas County · 939,478 people
- City population
- 24,324
- Metro
- Tampa-St. Petersburg-Clearwater, FL
- Population (ZIP)
- 24,324
- Household income
- $69,951
- Rent vs Own
- Severe rent burden
- 1371.0
Population outlook (Pinellas County) Hauer SSP2
- Today (2025)
- 1,027,532 people
- By 2030
- 1,063,586 · +3.5%
- By 2040
- 1,125,020 · +9.5%
- By 2050
- 1,168,637 · +13.7%
- By 2075
- 1,265,188 · +23.1%
- By 2100
- 1,260,357 · +22.7%
Race, ethnicity, and origin ACS 2023
- Neighborhood character
- Predominantly White (81%)
- Race & ethnicity
- White 81% Two or more races 7% Hispanic / Latino 7% Black 6% Asian 2%
- Hispanic origin (detail)
- Mexican 2% Puerto Rican 1% Cuban 1%
- Common ancestry
- Romanian 5% Lithuanian 3% Slovak 3%
- Foreign-born
- 11% · Canada, Vietnam
- Languages at home
- 89% English-only · Spanish 5% Russian/Polish/Slavic 1% French/Haitian/Cajun 1%
Political lean MEDSL · Pinellas
- 2024 margin
- Lean R (+5.2) · D 46.9% · R 52.1%
- 2008→2024 swing
- -13.5pp toward R · 2008: 8.3pp · 2024: -5.2pp
- All cycles
- 2024: R+5.2 2020: D+0.2 2016: R+1.1 2012: D+5.6 2008: D+8.3
Not yet ingested
- Civics
- —
Market trends
- HPI YoY
- ▼ -555.96%
- Current HPI
- 359.4858
- Rent YoY
- ▼ -0.61%
- Metro
- Tampa-St. Petersburg-Clearwater, FL
- State GDP YoY
- ▲ 3.28%
- F500 in state
- 36
Industry mix (Fortune 500 HQ in FL)
| Industry | F500 HQs | Revenue |
|---|---|---|
| Industrial Technology | 2 | $29B |
|
||
| Insurance | 2 | $17B |
|
||
| Retail | 1 | $60B |
|
||
| Technology Distribution | 1 | $58B |
|
||
| Homebuilding | 1 | $35B |
|
||
| Technology Manufacturing | 1 | $35B |
|
||
Price history
+870.1% since first listed3 events — show timeline
- 2026-04-01 Listed $325,000 Stellar MLS as Distributed by MLS Grid
- 2021-10-17 Listed $254,999 Stellar MLS as Distributed by MLS Grid
- 1985-12-01 Sold (Public Records) $33,500 Public Records
Property tax history
-3.2%/yrLatest (2025): $786 · +8.3% YoY. Source: county tax records.
Cash-flow waterfall
monthlySold comps — $/sqft
last 12 mo · ≤1 miLoading sold comps…