 🏷️ Likely Rental
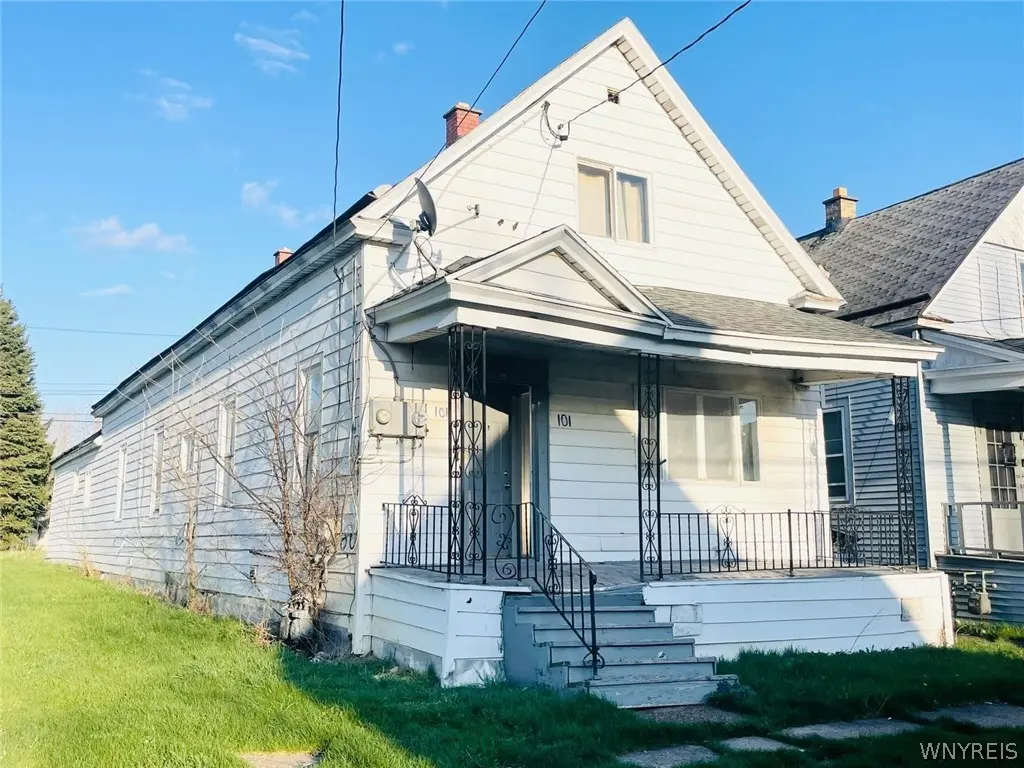
101 Gatchell St · Buffalo, NY
Flood risk 6/10 · Moderate
- FEMA flood zone
- X (unshaded)
- Chance of flooding over 30 yrs
- 0.69%
- Est. flood insurance / yr
- $507 – $1,088
Fire risk 1/10 · Minimal
- Est. fire insurance / yr
- $691 – $1,283
Heat risk 2/10 · Minimal
- Hot days now (above 92°F)
- 7 days/yr
- Hot days in 30 yrs
- 15 days/yr
Wind risk 1/10 · Minimal
- Chance of severe wind over 30 yrs
- —
Air-quality risk 3/10 · Minor
- Unhealthy air days now
- 2 days/yr
- Unhealthy air days in 30 yrs
- 3 days/yr
Risk factors via First Street. Map © Google.
Why this score? — see what drove the A grade
The composite is a weighted blend of 9 inputs, each scored 0–100. Each bar is that input's sub-score; the figure is the points it added to the 100-point composite (weight × sub-score).
- Cash flow +30.0/30.0
- ARV discount +15.0/15.0
- 1% rule +10.0/10.0
- DSCR +10.0/10.0
- Appreciation +10.0/10.0
- Livability +3.9/5.0
- Schools +3.3/10.0
- Rent growth +2.5/5.0
- Condition / age +2.5/5.0
$119,900
🖨 Deal sheet (PDF) 📄 Offer letter ✓ Due diligence
Multi-family units
County records classify this as Multi-Family (2-4 Unit). Listing-text estimate: 2 units. confirmed
Listing remarks
Great investment opportunity! Spacious 2-family home located off Bailey Ave featuring a total of 8 bedrooms and strong income potential. The front apartment is vacant and move-in ready, offering a living room, large kitchen with new flooring, 2 bedrooms, full bathroom, and convenient in-unit laundry hookups. Perfect for an owner-occupant or ready for a new tenant immediately. The rear duplex apartment is currently rented to long-term tenants paying $1,250/month. This spacious unit features a first floor with living room, dining room, large kitchen, full bathroom, and 2 bedrooms. The second floor includes 4 large bedrooms, providing plenty of space for a large household. Potential gross inco
Key facts
- 2 family home
- Long term tenants
- In unit laundry
Tags
Property features AI
Finance
- Financial info: Two total units; One unit currently rents for $1,250; Operating expense details and what owner pays: see remarks
Exterior
- Parking: No driveway
- Utilities: Public water connected; Sewer connected
- Home design: Single-story building; Existing structure
- Construction: Construction details: see remarks
- Exterior features: Rectangular residential lot; City street frontage; Lot dimensions approximately 30 x 110
Interior
- Kitchen: Gas water heater
- Bedrooms: One unit has 6 bedrooms; One unit has 2 bedrooms
- Bathrooms: Two full bathrooms total (building); Each unit includes 1 full bathroom
- Heating & cooling: Gas heating (details in remarks)
- Interior features: Resale condition; Two separate electric meters and two separate gas meters (multi-unit)
- Laundry & utility: Utilities included vary by unit (see remarks)
Neighborhood map
What this means for you Summary
Snapshot
- This is a 2 × 4-bed/1.0-bath units multifamily listed at $120k.
Deal economics
- At list price, monthly cash flow is $1k ($13k/yr) — positive. Per door: $540/mo.
- The deal already cash-flows at list — no discount required.
- Meets the 1% rule at list price ($2k rent vs $120k).
- Recommended offer: $116k (3.0% below list) — sets the bar for market timing.
- Cap rate 17.1% vs local median 8.0% in Buffalo — top-decile yield for the area; either an underpriced asset or a hidden risk that comps aren't pricing in. Stress-test before assuming the spread holds.
Location & tenants
- Location reads 77/100 on livability (#195 in NY, #3,011 nationally) — a middle-class / working-renter tenant base. Strengths: commute A+, housing A+, health & safety A+; Watch: crime F, employment D-.
- Buffalo City School District (urban): math 41% / reading 40% proficiency, ranked #535 of 590 in NY (top 91%) — families likely to look elsewhere, expect single-tenant / working-renter base with shorter leases; 75% free/reduced lunch — lower-income household profile, screen leases tightly.
- Market conditions: 83 active listings in the ZIP; 1 comparable units currently listed for rent nearby; 1,244 units permitted in Erie County in 2024 (563 in 5+ unit buildings).
Forward outlook
- In year one you build about $13k of equity ($829 loan paydown + $12k appreciation (10.0% local appreciation)).
- At projected returns (10.0% appreciation + 3.0% rent growth), your $34k cash investment doubles in ~2 years — after that, you're playing with house money.
- By year 3, paydown + projected appreciation supports a ~$32k cash-out refi (75% LTV) — recoverable capital for the next deal without selling this one.
Negotiation context
- It's been on market 34 days — a 3% lower offer ($116k) is reasonable based on typical stale-listing flexibility.
- 9 sale attempts since 11y ago; this cycle's ask has dropped $10k (8%) from the opening price — seller is motivated, your offer sets the floor, not the list.
- Current owner paid $22k; list at $120k implies a 439% gain — meaningful room to come down on a strong offer.
Risks & watch-outs
- Watch-outs: built in 1900 — expect roof / HVAC / electrical / plumbing capex.
- Climate carrying-cost: major flood risk — expect insurance premiums to compound above CPI over the hold.
Questions for the listing agent
- It's been on market 34 days. Have you received any prior offers? Is the seller open to a 3% concession, seller financing, or rate buy-down credit?
- Can we see the unit-by-unit rent roll, current vacancy, and any below-market leases? What's the average tenancy length?
- What capital expenditures (roof, boiler, parking lot, exteriors) have been made in the last 5 years, and what's planned in the next 2?
- Built in 1900 — when were the roof, HVAC, electrical panel, plumbing, and water heater last replaced?
- Is there a deadline driving the sale (1031 exchange, divorce, estate, relocation)? That informs how much negotiation room exists.
- Crime grade is F in this area — have there been break-ins, vandalism, or insurance claims at this property in the last 3 years? What carrier currently insures it and at what premium?
- What's the average days-on-market for RENTAL listings here right now (not sales)? A rising rental-DOM trend means longer vacancies and softer asking-rent achievability than the comps imply.
- What's the recent tenant-quality profile in this submarket — average credit score on applications, eviction rate, late-payment / NSF rate, and stable-employment percentage? A property-management company in the area should have these aggregated.
- How much new apartment / multifamily construction is in the pipeline within 1–3 miles? Heavy new supply (>2% of stock underway) typically softens rents 12–24 months out; light construction supports rent growth.
Investment metrics
- 1% rule
- 1.89% ✓
- Cap rate
- 17.11%
- Cash-on-cash
- 38.62%
- DSCR
- 2.72
- GRM
- 4.4
CMA / ARV
- ARV (median comp)
- $167,823
- List price
- $119,900
- Delta
- -28.56%
- Verdict
- UNDERPRICED
- Comps
- 20 within 1.0 mi
Show comp detail 7 sales within ~0.75 mi
| Address | Dist | Beds/Ba | Sqft | Sold | Price | $/sf | Match |
|---|---|---|---|---|---|---|---|
| 21 Liddell St | 0.33mi | 6/1.5 | 1,610 (+2%) | 5mo | $53,000 | $33 | 76 |
| 362 Davey St | 0.65mi | 5/2.0 (-1) | 1,640 (+3%) | 2mo | $92,000 | $56 | 57 |
| 227 Ashley St | 0.53mi | 5/2.0 (-1) | 1,776 (+12%) | 5mo | $145,000 | $82 | 46 |
| 221 May St | 0.48mi | 5/2.0 (-1) | 1,794 (+13%) | 8mo | $91,000 | $51 | 44 |
| 250 Gold St | 0.74mi | 5/2.0 (-1) | 1,646 (+4%) | 12mo | $190,000 | $115 | 44 |
| 141 Moselle St | 0.71mi | 5/2.0 (-1) | 1,730 (+9%) | 8mo | $30,000 | $17 | 40 |
| 304 Longnecker St | 0.54mi | 7/2.5 (+1) | 1,803 (+14%) | 14mo | $123,768 | $69 | 33 |
Match score weights: distance 35% · size 25% · config 20% · recency 20%. Top-matched comps best support the ARV.
Projected returns pro-forma
10.0% appreciation · 3.0% rent growth · sell at horizon
- IRR
- 54.1%
- Equity multiple
- 4.99×
- Total profit
- $134,082
- Equity at exit
- $108,015
- IRR
- 47.6%
- Equity multiple
- 11.15×
- Total profit
- $340,654
- Equity at exit
- $232,939
Cash invested: $33,572 (down + closing). Projections, not guarantees.
Landlord ↔ Tenant lean methodology
- Overall (STATE)
- 15 Strongly Tenant-Friendly
- State New York
- 15 Strongly Tenant-Friendly · D+10
- County
- — inherits STATE
- City
- — inherits STATE
ZIP-level market 14212
- Home prices YoY
- 20.4%
- Active inventory
- 83
- Price-to-rent
- 8.8×
Monthly cashflow live
- Estimated rent
- $2,268 high interval (Pro) →
- Mortgage (P&I)
- −$629
- Tax from tax record
- −$32 /mo · $390/yr
- Insurance
- −$50
- HOA
- −$0
- Vacancy / Maint / Mgmt
- −$476
- Net cashflow
- $1,081
Break-even live
Sensitivity live
| Price | -10% $1,148 | -5% $1,114 | +0% $1,081 | +5% $1,047 | +10% $1,013 |
|---|---|---|---|---|---|
| Rent | -10% $901 | -5% $991 | +0% $1,081 | +5% $1,170 | +10% $1,260 |
| Rate | -1.0pp $1,141 | -0.5pp $1,111 | base $1,081 | +0.5pp $1,049 | +1.0pp $1,018 |
2-unit breakdown (identical units grouped — click to expand)
| Units | Beds | Baths | Est. rent |
|---|---|---|---|
| 2× units | 4 | 1 | $2,268 |
| #1 | 4 | 1 | $1,134 |
| #2 | 4 | 1 | $1,134 |
| Total (2 units) | $2,268 | ||
UW: 25.0% down · 7.5% · 30yr · 1.5% tax · 5.0% vac · 8.0% maint · 8.0% mgmt
Financing live
Cash to close
- Down payment
- $29,975
- Closing costs
- $3,597
- Reserves months
- —
- Total cash needed
- —
Loan-product check · same deal, 3 products live
Conventional
25% down · 7.5% · 30yr
- Down + closing
- —
- Monthly P&I
- —
- Monthly cashflow
- —
- DSCR
- —
- Eligible?
- —
Personal DTI + credit; lowest rate.
DSCR
20% down · 8.5% · 30yr
- Down + closing
- —
- Monthly P&I
- —
- Monthly cashflow
- —
- DSCR
- —
- Eligible?
- —
No personal income docs; deal must DSCR.
Hard money
10% down · 12.0% · 12mo
- Down + closing
- —
- Monthly P&I
- —
- Monthly cashflow
- —
- DSCR
- —
- Eligible?
- —
Short-term bridge; refi at stabilization.
Rent comps 1 comps
| Address | Beds | Baths | Sqft | Rent | $/sqft | DOM | Units | Dist |
|---|---|---|---|---|---|---|---|---|
| 518 Wilson St Buffalo, NY | 5.0 | 1.5 | 1848 | $1,500 | $0.81 | 24d | 1 | 1.28mi |
Listing history 48 events
-
2026-06-18days on market $119,900 Active 34 DOM
-
2026-06-17days on market $119,900 Active 33 DOM
-
2026-06-16pricedays on market $119,900 Active 32 DOM
-
2026-06-15days on market $129,900 Active 31 DOM
-
2026-06-13days on market $129,900 Active 29 DOM
-
2026-06-13days on market $129,900 Active 28 DOM
-
2026-06-10days on market $129,900 Active 26 DOM
-
2026-06-09days on market $129,900 Active 25 DOM
-
2026-06-08days on market $129,900 Active 24 DOM
-
2026-06-07days on market $129,900 Active 23 DOM
-
2026-06-03days on market $129,900 Active 19 DOM
-
2026-06-02days on market $129,900 Active 18 DOM
-
2026-06-01days on market $129,900 Active 17 DOM
-
2026-05-31days on market $129,900 Active 16 DOM
-
2026-05-15$129,900 Active 912-char remark
-
2024-02-11historical
-
2023-12-05price $109,900
-
2023-11-16$119,900 Active
-
2023-07-06historical
-
2023-06-30price $104,900
-
2023-06-09price $109,900
-
2023-05-24price $119,900
-
2023-05-12$129,900 Active
-
2017-06-13historical
-
2017-05-16price $44,750
-
2017-05-08price $44,800
-
2017-05-01$44,900 Active
-
2017-01-06status Active
-
2016-12-31historical
-
2016-12-31historical
-
2016-11-21price $34,900
-
2016-10-26price $35,900
-
2016-09-20price $37,900
-
2016-09-14price $38,900
-
2016-08-25$39,900 Active
-
2016-08-09historical
-
2016-05-30historical Under Contract- Do Not Show
-
2016-05-27status Active
-
2016-05-17historical
-
2016-04-27price $39,900
-
2016-03-31price $44,900
-
2016-03-22$49,900 Active
-
2015-09-09historical
-
2015-08-17price $46,900
-
2015-07-13price $52,899
-
2015-06-17price $59,899
-
2015-06-09$59,900 Active
-
1995-12-05soldstatus $22,234
ⓘ Source: listings_history table (triggers on properties + properties_extension) + one-shot
backfill from property_details.listing_events for pre-trigger history.
Tax reassessment forecast NY · Partial reset (capped growth)
- Current annual tax
- $390 · $32/mo
- Projected year-2 tax
- $1,208 · $101/mo
- Expected delta
- +$818/yr (+$68/mo · 210.0%)
ⓘ Screening estimate from a state-policy table — verify with the county assessor before closing.
Climate risk First Street
- Flood 6/10 Major FEMA zone X (unshaded) · 69% chance over 30 yrs
- Wildfire 1/10 Low
- Heat 2/10 Low 7 d/yr ≥92°F today · 15 d/yr by 30 yrs out
- Wind 1/10 Low
- Air quality 3/10 Moderate 2 unhealthy d/yr today · 3 by 30 yrs out
Nearby sold comps map
Loading sold comps map…
Walkable amenities ~0.75 mi
Loading nearby amenities…
Taxation est. · year 1
- Rental income
- $27,216
- − Mortgage interest
- −$6,716
- − Property taxes
- −$390
- − Insurance
- −$600
- − Repairs & maintenance
- −$2,177
- − Management
- −$2,177
- − Depreciation
- −$3,488
- Taxable income
- $11,668
- Est. tax owed @ 24.0%
- −$2,800
- After-tax cash flow
- $10,166/yr
For passive investors: Depreciation is non-cash, so a rental often shows a tax loss while cash-flowing — sheltering income. Rental losses are passive: they offset passive income freely, and up to $25,000/yr can offset ordinary (W-2) income if you actively participate and your MAGI is under $100k (phasing out to $0 by $150k); unused losses carry forward. On sale, claimed depreciation is recaptured at up to 25%, and gains may owe capital-gains tax (a 1031 exchange can defer both). Figures are a year-1 estimate at your 24.0% rate — not tax advice; consult a CPA.
Schools (NCES district)
- District
- Buffalo City School District
- NCES district ID
- 3605850
- Math proficiency
- 41% ▲ 11.00%
- Reading proficiency
- 40% ▲ 7.00%
- Median HH income
- $31,665
- Composite
- 33.17/100
- National rank
- #5544
- State rank
- #535 of 590 in NY
Livability — Buffalo
- Score
- 77/100
- State rank
- #195
- US rank
- #3011
Category grades
Schools grade is shown separately in the Schools card above.
Census & demographics
- Census place
- Buffalo, NY
- City population
- 440,021
- Population (ZIP)
- 13,603
Population outlook (Erie County) Hauer SSP2
- Today (2025)
- 933,037 people
- By 2030
- 935,181 · +0.2%
- By 2040
- 928,531 · -0.5%
- By 2050
- 905,725 · -2.9%
- By 2075
- 834,037 · -10.6%
- By 2100
- 708,033 · -24.1%
Race, ethnicity, and origin ACS 2023
- Neighborhood character
- Highly diverse neighborhood (Simpson 0.75)
- Race & ethnicity
- White 32% Black 27% Asian 25% Hispanic / Latino 9% Two or more races 8%
- Hispanic origin (detail)
- Puerto Rican 8%
- Common ancestry
- Romanian 12% Serbian 1% Lithuanian 1%
- Foreign-born
- 20% · Philippines, Canada, China
- Languages at home
- 68% English-only · Other Indo-European 18% Spanish 4% Other Asian/Pacific 2%
Political lean MEDSL · Erie
- 2024 margin
- Lean D (+9.7) · D 54.8% · R 45.2%
- 2008→2024 swing
- -7.9pp toward R · 2008: 17.5pp · 2024: 9.7pp
- All cycles
- 2024: D+9.7 2020: D+14.7 2016: D+4.8 2012: D+15.6 2008: D+17.5
Not yet ingested
- Civics
- —
Market trends
- HPI YoY
- ▲ 79.80%
- Current HPI
- 471.6399
- Rent YoY
- —
- Metro
- —
- State GDP YoY
- ▲ 2.60%
- F500 in state
- 92
Industry mix (Fortune 500 HQ in NY)
| Industry | F500 HQs | Revenue |
|---|---|---|
| Financial Services | 10 | $950B |
|
||
| Consumer Goods | 9 | $162B |
|
||
| Insurance | 4 | $225B |
|
||
| Telecommunications | 2 | $144B |
|
||
| Pharmaceuticals | 2 | $112B |
|
||
| Media / Entertainment | 2 | $69B |
|
||
Price history
+439.3% since first listed35 events — show timeline
- 2026-06-15 Price Changed $119,900 WNYREIS
- 2026-05-15 Listed $129,900 WNYREIS
- 2024-02-11 Listing Removed — WNYREIS
- 2023-12-05 Price Changed $109,900 WNYREIS
- 2023-11-16 Listed $119,900 WNYREIS
- 2023-07-06 Listing Removed — WNYREIS
- 2023-06-30 Price Changed $104,900 WNYREIS
- 2023-06-09 Price Changed $109,900 WNYREIS
- 2023-05-24 Price Changed $119,900 WNYREIS
- 2023-05-12 Listed $129,900 WNYREIS
- 2017-06-13 Listing Removed — WNYREIS
- 2017-05-16 Price Changed $44,750 WNYREIS
- 2017-05-08 Price Changed $44,800 WNYREIS
- 2017-05-01 Listed $44,900 WNYREIS
- 2017-01-06 Relisted — WNYREIS
- 2016-12-31 Listing Removed — WNYREIS
- 2016-12-31 Listing Removed — WNYREIS
- 2016-11-21 Price Changed $34,900 WNYREIS
- 2016-10-26 Price Changed $35,900 WNYREIS
- 2016-09-20 Price Changed $37,900 WNYREIS
- 2016-09-14 Price Changed $38,900 WNYREIS
- 2016-08-25 Listed $39,900 WNYREIS
- 2016-08-09 Listing Removed — WNYREIS
- 2016-05-30 Contingent — WNYREIS
- 2016-05-27 Relisted — WNYREIS
- 2016-05-17 Listing Removed — WNYREIS
- 2016-04-27 Price Changed $39,900 WNYREIS
- 2016-03-31 Price Changed $44,900 WNYREIS
- 2016-03-22 Listed $49,900 WNYREIS
- 2015-09-09 Listing Removed — WNYREIS
- 2015-08-17 Price Changed $46,900 WNYREIS
- 2015-07-13 Price Changed $52,899 WNYREIS
- 2015-06-17 Price Changed $59,899 WNYREIS
- 2015-06-09 Listed $59,900 WNYREIS
- 1995-12-05 Sold (Public Records) $22,234 Public Records
Property tax history
+18.7%/yrLatest (2025): $390 · +309.0% YoY. Source: county tax records.
Cash-flow waterfall
monthlySold comps — $/sqft
last 12 mo · ≤1 miLoading sold comps…