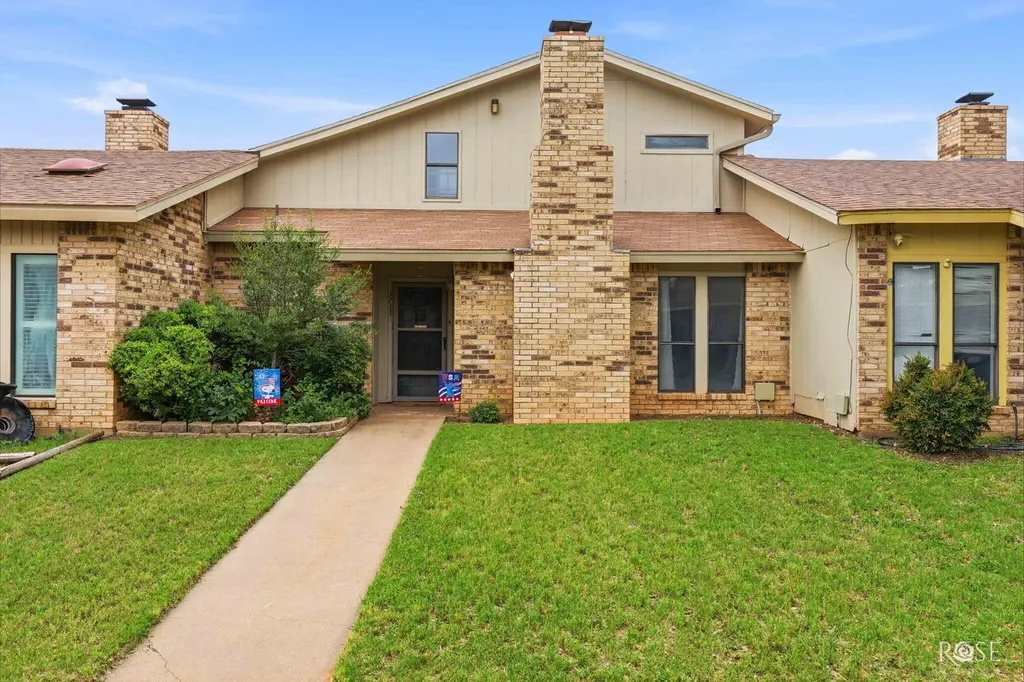
3717 High Meadow Dr · San Angelo, TX
Flood risk 1/10 · Minimal
- FEMA flood zone
- X (shaded)
- Chance of flooding over 30 yrs
- 0.0%
- Est. flood insurance / yr
- $507 – $1,088
Fire risk 7/10 · Major
- Est. fire insurance / yr
- $1,222 – $2,270
Heat risk 7/10 · Major
- Hot days now (above 104°F)
- 7 days/yr
- Hot days in 30 yrs
- 24 days/yr
Wind risk 4/10 · Minor
- Chance of severe wind over 30 yrs
- 13.0%
Air-quality risk 2/10 · Minimal
- Unhealthy air days now
- 0 days/yr
- Unhealthy air days in 30 yrs
- 1 days/yr
Risk factors via First Street. Map © Google.
Why this score? — see what drove the F grade
The composite is a weighted blend of 9 inputs, each scored 0–100. Each bar is that input's sub-score; the figure is the points it added to the 100-point composite (weight × sub-score).
- Cash flow +11.9/30.0
- 1% rule +4.2/10.0
- Rent growth +4.0/5.0
- Livability +3.7/5.0
- DSCR +3.5/10.0
- ARV discount +2.6/15.0
- Schools +2.6/10.0
- Condition / age +2.5/5.0
- Appreciation +0.0/10.0
$205,000
🖨 Deal sheet 📄 Offer letter ✓ Due diligence
Listing remarks MLS
There are may things to love about this Townhouse that is close to schools and shopping. Large living and dining area with lots of natural light coming from small Atrium and windows. Don't miss the 2 pantries in the kitchen. The upstairs 2nd bedroom/loft with large closet and enclosed balcony could also be used as office or game room. Master bedroom has 2 large closets. There is a storage room inside attached garage and covered parking on back driveway. Fresh paint on interior and exterior. Roof is 3 years old. Make an appointment quick to see this one.
Key facts
- Half bath
- Red arroyo trails
- Cul-de-sac
Tags
Property features AI
Exterior
- Parking: Attached garage (2 car spaces); Carport (2 spaces); Paved access with alley access
- Security: Smoke detectors
- Utilities: Public water; Public sewer
- Home design: Residential townhouse; Two levels; Updated / remodeled
- Construction: Brick construction; Slab foundation; Built or updated (year not specified)
- Exterior features: Shingle roof; Interior lot; City street frontage; Public maintained road; Gravel and paved road surfaces
Interior
- Kitchen: Dishwasher; Electric range / cooktop; Refrigerator; Vented exhaust fan
- Bedrooms: Total rooms: 6
- Flooring: Carpet; Tile
- Bathrooms: 1 full bathroom; 1 half bathroom
- Heating & cooling: Central heating; Central air conditioning; Ceiling fans
- Interior features: Pantry; Ceiling fans; Blinds; Double-pane windows; Wood-burning fireplace
- Laundry & utility: Dedicated laundry room; Gas water heater
Neighborhood map
What this means for you Summary
Snapshot
- This is a 2-bed/1.5-bath townhouse listed at $205k.
Deal economics
- At list price, monthly cash flow is $-53 ($-634/yr) — negative.
- To cash-flow at today's rent, offer at most $196k (4.6% below list).
- To meet the 1% rule (rent ≥ 1% of price), the offer needs to be $188k (8.3% below list).
- Recommended offer: $188k (8.3% below list) — sets the bar for 1% rule.
- Cap rate 6.0% vs local median 3.8% in San Angelo — top-decile yield for the area; either an underpriced asset or a hidden risk that comps aren't pricing in. Stress-test before assuming the spread holds.
Location & tenants
- Location reads 73/100 on livability (#199 in TX) — a middle-class / working-renter tenant base. Strengths: cost of living A+, housing A+, health & safety A+; Watch: employment C-, amenities F, commute F.
- San Angelo ISD (urban): math 27% / reading 33% proficiency, ranked #627 of 826 in TX (top 76%) — families likely to look elsewhere, expect single-tenant / working-renter base with shorter leases.
- Zoned schools: Bowie El (math 22% / reading 32%, grade F, #2,791 of 4,322 statewide, top 68%, 358 students, 61% FRL); Glenn Middle (math 25% / reading 29%, grade F, #1,177 of 1,662 statewide, top 72%, 1,258 students, 53% FRL); Central H S (math 22% / reading 43%, grade F, #1,029 of 1,632 statewide, top 64%, 3,065 students, 48% FRL) — zoned schools at 54% FRL track the district average.
- Market conditions: Rents rising fast (+6.0%/yr); 521 active listings in the ZIP; 21 comparable units currently listed for rent nearby; rentals at typical pace (median 21d on market — plan ~3-4 weeks tenant-placement turnaround); solid renter incomes; 233 units permitted in Tom Green County in 2024 (0 in 5+ unit buildings).
Forward outlook
- Local home prices are declining (-3.0%/yr); year-one equity from $1k of loan paydown is wiped out by about $6k of value loss. Plan a longer hold.
- Tom Green County population projected at +35% by 2050 — long-run rental-demand tailwind backs the buy-and-hold thesis.
Negotiation context
- Only 13 days on market — expect competitive offers; lowballing is unlikely to land.
- 2 sale attempts since 3y ago with the ask held roughly flat each time — persistent listings suggest the price (not the market) is what's stuck; bring a comps-based counter.
Risks & watch-outs
- Climate carrying-cost: major wildfire risk; extreme-heat days projected 7→24/yr by 2055 (HVAC capex compounding) — expect insurance premiums to compound above CPI over the hold.
Questions for the listing agent
- What do current leases actually rent for vs. the listed asking? Can we see a recent rent roll and the last 12 months of T-12 income?
- Is there a deadline driving the sale (1031 exchange, divorce, estate, relocation)? That informs how much negotiation room exists.
- Schools are F-rated, which usually means shorter tenancies and higher turnover. Who's the typical renter profile here, and what's been the actual vacancy rate?
- The area grade is low — what's the realistic commute time and amenity access for the typical tenant pool here? Any planned neighborhood developments (good or bad) we should know about?
- What's the average days-on-market for RENTAL listings here right now (not sales)? A rising rental-DOM trend means longer vacancies and softer asking-rent achievability than the comps imply.
- What's the recent tenant-quality profile in this submarket — average credit score on applications, eviction rate, late-payment / NSF rate, and stable-employment percentage? A property-management company in the area should have these aggregated.
- How much new for-sale + rental construction is in the pipeline within 1–3 miles? Heavy new supply typically softens prices + rents 12–24 months out; constrained supply supports both.
Investment metrics
- 1% rule
- 0.92% ✗
- Cap rate
- 5.98%
- Cash-on-cash
- -1.11%
- DSCR
- 0.95
- GRM
- 9.1
CMA / ARV
- ARV (on-the-fly)
- $185,040
- Comps found
- 2
Show comp detail 2 sales within ~0.75 mi
| Address | Dist | Beds/Ba | Sqft | Sold | Price | $/sf | Match |
|---|---|---|---|---|---|---|---|
| 3713 High Meadow Dr | 0.01mi | 2/1.5 | 1,494 (-3%) | 21mo | $178,000 | $119 | 77 |
| 3721 High Meadow Dr | 0.01mi | 2/2.0 | 1,578 (+2%) | 23mo | $189,900 | $120 | 74 |
Match score weights: distance 35% · size 25% · config 20% · recency 20%. Top-matched comps best support the ARV.
Projected returns pro-forma
-3.0% appreciation · 6.03% rent growth · sell at horizon
- IRR
- -14.4%
- Equity multiple
- 0.47×
- Total profit
- $-30,579
- Equity at exit
- $30,566
- IRR
- -1.1%
- Equity multiple
- 0.92×
- Total profit
- $-4,764
- Equity at exit
- $17,725
Cash invested: $57,400 (down + closing). Projections, not guarantees.
Landlord ↔ Tenant lean methodology
- Overall (STATE)
- 87 Strongly Landlord-Friendly
- State Texas
- 87 Strongly Landlord-Friendly · R+5
- County
- — inherits STATE
- City
- — inherits STATE
ZIP-level market 76904
- Rents YoY
- 6.0%
- Active inventory
- 521
- Price-to-rent
- 9.1×
Monthly cashflow live
- Estimated rent
- $1,879 high interval (Pro) →
- Mortgage (P&I)
- −$1,075
- Tax from tax record
- −$377 /mo · $4,526/yr
- Insurance
- −$85
- HOA
- −$0
- Vacancy / Maint / Mgmt
- −$395
- Net cashflow
- $-53
Break-even live
UW: 25.0% down · 7.5% · 30yr · 1.5% tax · 5.0% vac · 8.0% maint · 8.0% mgmt
Financing live
Cash to close
- Down payment
- $51,250
- Closing costs
- $6,150
- Reserves months
- —
- Total cash needed
- —
Loan-product check · same deal, 3 products live
Conventional
25% down · 7.5% · 30yr
- Down + closing
- —
- Monthly P&I
- —
- Monthly cashflow
- —
- DSCR
- —
- Eligible?
- —
Personal DTI + credit; lowest rate.
DSCR
20% down · 8.5% · 30yr
- Down + closing
- —
- Monthly P&I
- —
- Monthly cashflow
- —
- DSCR
- —
- Eligible?
- —
No personal income docs; deal must DSCR.
Hard money
10% down · 12.0% · 12mo
- Down + closing
- —
- Monthly P&I
- —
- Monthly cashflow
- —
- DSCR
- —
- Eligible?
- —
Short-term bridge; refi at stabilization.
Rent comps 21 comps
| Address | Beds | Baths | Sqft | Rent | $/sqft | DOM | Units | Dist |
|---|---|---|---|---|---|---|---|---|
| 3609 High Meadow Dr San Angelo, TX | 2.0 | 2.0 | 1266 | $2,400 | $1.90 | 43d | 1 | 0.06mi |
| 3410 Wildewood Dr San Angelo, TX | 1.0–2.0 | 1.0–2.0 | 882 | $975 | $1.10 | 20d | 2 | 0.47mi |
| 3326 Rock Brook Dr San Angelo, TX | 1.0–2.0 | 1.0–2.0 | 886 | $1,205 | $1.36 | 20d | 13 | 0.62mi |
| 2431 College Hills Blvd San Angelo, TX | 1.0–3.0 | 1.0–2.0 | 1025 | $1,254 | $1.22 | 20d | 17 | 0.67mi |
| 2930 Sierra Cir San Angelo, TX | 3.0 | 2.0 | 2214 | $2,100 | $0.95 | 20d | 1 | 0.89mi |
| 3225 Southland Blvd San Angelo, TX | 3.0 | 2.0 | 2165 | $2,500 | $1.15 | 20d | 1 | 0.94mi |
| 3207 Trinity Ave San Angelo, TX | 3.0 | 2.0 | 1536 | $1,995 | $1.30 | 43d | 1 | 1.00mi |
| 4330 Rimrock Cir San Angelo, TX | 3.0 | 2.0 | 1560 | $2,200 | $1.41 | 20d | 1 | 1.01mi |
| 2756 Sac Ave San Angelo, TX | 3.0 | 1.0 | 1461 | $1,650 | $1.13 | 43d | 1 | 1.06mi |
| 3344 Trinity Ave San Angelo, TX | 3.0 | 2.0 | 1545 | $1,900 | $1.23 | 20d | 1 | 1.13mi |
| 4802 Royal Oak Dr San Angelo, TX | 3.0 | 2.0 | 1798 | $2,300 | $1.28 | 43d | 1 | 1.14mi |
| 279 Glenna Dr San Angelo, TX | 3.0 | 2.0 | 1625 | $1,795 | $1.10 | 20d | 1 | 1.17mi |
| 4133 Shefflera Dr San Angelo, TX | 3.0 | 2.0 | 1560 | $2,300 | $1.47 | 20d | 1 | 1.22mi |
| 4429 White Ash Ln San Angelo, TX | 2.0 | 2.0 | 1494 | $2,400 | $1.61 | 43d | 1 | 1.24mi |
| 2548 A and M Ave San Angelo, TX | 3.0 | 1.5 | 1092 | $1,500 | $1.37 | 20d | 1 | 1.26mi |
| 2013 Rosemont Dr San Angelo, TX | 3.0 | 2.0 | 1400 | $2,100 | $1.50 | 20d | 1 | 1.36mi |
| 5910 Southampton Pl San Angelo, TX | 3.0 | 2.0 | 1596 | $2,100 | $1.32 | 20d | 1 | 1.36mi |
| 4302 Pinion Ridge Dr San Angelo, TX | 3.0 | 2.0 | 1750 | $2,075 | $1.19 | 20d | 1 | 1.36mi |
| 2625 Palo Duro Dr San Angelo, TX | 2.0 | 2.0 | 1680 | $1,500 | $0.89 | 43d | 1 | 1.39mi |
| 707 Wicklow Ct San Angelo, TX | 3.0 | 2.0 | 1576 | $2,000 | $1.27 | 43d | 1 | 1.42mi |
| 5921 Stratford Ave San Angelo, TX | 3.0 | 2.0 | 1738 | $2,400 | $1.38 | 20d | 1 | 1.44mi |
Listing history 12 events
-
2026-06-19days on market $205,000 Active 13 DOM
-
2026-06-18days on market $205,000 Active 12 DOM
-
2026-06-17days on market $205,000 Active 11 DOM
-
2026-06-16days on market $205,000 Active 10 DOM
-
2026-06-15days on market $205,000 Active 9 DOM
-
2026-06-14days on market $205,000 Active 7 DOM
-
2026-06-13days on market $205,000 Active 6 DOM
-
2026-06-10days on market $205,000 Active 4 DOM
-
2026-06-09days on market $205,000 Active 3 DOM
-
2026-06-08days on market $205,000 Active 2 DOM
-
2026-06-07remarks 699-char remark
-
2026-06-07$205,000 Active 1 DOM
ⓘ Source: listings_history table (triggers on properties + properties_extension) + one-shot
backfill from property_details.listing_events for pre-trigger history.
Tax reassessment forecast TX · Resets to sale price
- Current annual tax
- $4,526 · $377/mo
- Projected year-2 tax
- $4,526 · $377/mo
- Expected delta
- $0/yr ($0/mo · 0.0%)
ⓘ Screening estimate from a state-policy table — verify with the county assessor before closing.
Climate risk First Street
- Flood 1/10 Low FEMA zone X (shaded) · 0% chance over 30 yrs
- Wildfire 7/10 Severe
- Heat 7/10 Severe 7 d/yr ≥104°F today · 24 d/yr by 30 yrs out
- Wind 4/10 Moderate 13% chance of damaging wind over 30 yrs
- Air quality 2/10 Low 0 unhealthy d/yr today · 1 by 30 yrs out
Nearby sold comps map
Loading sold comps map…
Walkable amenities ~0.75 mi
Loading nearby amenities…
Taxation est. · year 1
- Rental income
- $22,554
- − Mortgage interest
- −$11,483
- − Property taxes
- −$4,526
- − Insurance
- −$1,025
- − Repairs & maintenance
- −$1,804
- − Management
- −$1,804
- − Depreciation
- −$5,964
- Taxable loss
- −$4,053
- Est. tax savings @ 24.0%
- +$973
- After-tax cash flow
- $338/yr
For passive investors: Depreciation is non-cash, so a rental often shows a tax loss while cash-flowing — sheltering income. Rental losses are passive: they offset passive income freely, and up to $25,000/yr can offset ordinary (W-2) income if you actively participate and your MAGI is under $100k (phasing out to $0 by $150k); unused losses carry forward. On sale, claimed depreciation is recaptured at up to 25%, and gains may owe capital-gains tax (a 1031 exchange can defer both). Figures are a year-1 estimate at your 24.0% rate — not tax advice; consult a CPA.
Schools (NCES district)
- District
- San Angelo ISD
- NCES district ID
- 4838700
- Math proficiency
- 27% ▼ -9.00%
- Reading proficiency
- 33% ▼ -3.00%
- Median HH income
- $43,501
- Composite
- 25.56/100
- National rank
- #7427
- State rank
- #627 of 826 in TX
Livability — San Angelo
- Score
- 73/100
- State rank
- #199
- US rank
- #5030
Category grades
Schools grade is shown separately in the Schools card above.
Census & demographics
- Census place
- San Angelo, TX
- County
- Tom Green County · 113,188 people
- City population
- 81,357
- Metro
- San Angelo, TX
- Population (ZIP)
- 36,954
- Household income
- $81,833
- Rent vs Own
- Severe rent burden
- 778.0
Population outlook (Tom Green County) Hauer SSP2
- Today (2025)
- 135,110 people
- By 2030
- 144,090 · +6.6%
- By 2040
- 162,561 · +20.3%
- By 2050
- 182,158 · +34.8%
- By 2075
- 232,274 · +71.9%
- By 2100
- 268,218 · +98.5%
Race, ethnicity, and origin ACS 2023
- Neighborhood character
- Majority White (60%)
- Race & ethnicity
- White 60% Hispanic / Latino 30% Two or more races 17% Black 4% Asian 3%
- Hispanic origin (detail)
- Mexican 26%
- Common ancestry
- Slovak 2% Lithuanian 2% Italian 1%
- Foreign-born
- 5% · Canada
- Languages at home
- 82% English-only · Spanish 15% Tagalog/Filipino 1%
Political lean MEDSL · Tom Green
- 2024 margin
- Solid R (+48.0) · D 25.5% · R 73.5% · Other 1.0%
- 2008→2024 swing
- -6.3pp toward R · 2008: -41.7pp · 2024: -48.0pp
- All cycles
- 2024: R+48.0 2020: R+44.4 2016: R+47.9 2012: R+47.9 2008: R+41.7
Not yet ingested
- Civics
- —
Market trends
- HPI YoY
- ▼ -299.76%
- Current HPI
- 176.0366
- Rent YoY
- ▲ 6.03%
- Metro
- San Angelo, TX
- State GDP YoY
- ▲ 3.95%
- F500 in state
- 110
Industry mix (Fortune 500 HQ in TX)
| Industry | F500 HQs | Revenue |
|---|---|---|
| Energy | 16 | $1,198B |
|
||
| Technology | 5 | $198B |
|
||
| Engineering / Construction | 4 | $72B |
|
||
| Energy Services | 3 | $60B |
|
||
| Utilities | 3 | $41B |
|
||
| Healthcare | 2 | $330B |
|
||
Price history
+13.9% since first listed5 events — show timeline
- 2026-06-06 Listed $205,000 SAAR TX
- 2023-06-27 Sold (Public Records) — Public Records
- 2023-06-27 Sold (MLS) — SAAR TX
- 2023-05-11 Pending — SAAR TX
- 2023-04-28 Listed $180,000 SAAR TX
Property tax history
+5.3%/yrLatest (2025): $4,526 · +18.1% YoY. Source: county tax records.
Cash-flow waterfall
monthlySold comps — $/sqft
last 12 mo · ≤1 miLoading sold comps…