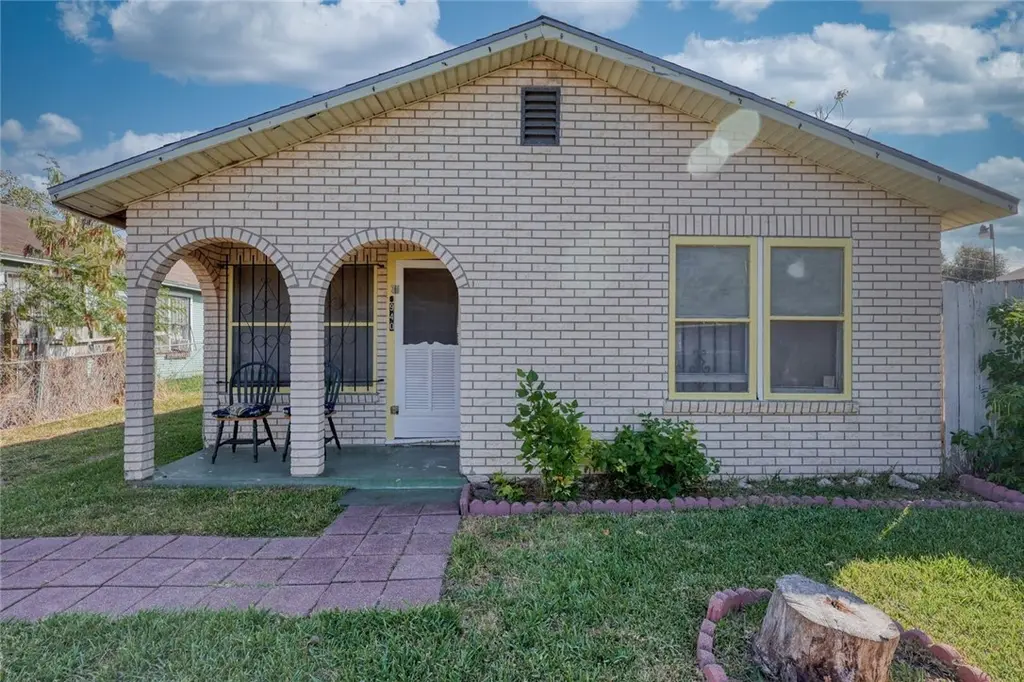
940 Dolores St · Corpus Christi, TX
Flood risk 3/10 · Minor
- FEMA flood zone
- X (unshaded)
- Chance of flooding over 30 yrs
- 0.2%
- Est. flood insurance / yr
- $507 – $1,088
Fire risk 1/10 · Minimal
- Est. fire insurance / yr
- $1,222 – $2,270
Heat risk 10/10 · Severe
- Hot days now (above 107°F)
- 7 days/yr
- Hot days in 30 yrs
- 25 days/yr
Wind risk 9/10 · Severe
- Chance of severe wind over 30 yrs
- 99.0%
Air-quality risk 1/10 · Minimal
- Unhealthy air days now
- 0 days/yr
- Unhealthy air days in 30 yrs
- 0 days/yr
Risk factors via First Street. Map © Google.
Why this score? — see what drove the B grade
The composite is a weighted blend of 9 inputs, each scored 0–100. Each bar is that input's sub-score; the figure is the points it added to the 100-point composite (weight × sub-score).
- Cash flow +30.0/30.0
- DSCR +10.0/10.0
- 1% rule +9.6/10.0
- ARV discount +7.8/15.0
- Appreciation +5.7/10.0
- Livability +3.9/5.0
- Schools +2.8/10.0
- Rent growth +2.5/5.0
- Condition / age +2.5/5.0
$75,000
🖨 Deal sheet 📄 Offer letter ✓ Due diligence
Listing remarks MLS
This 3 bedroom 1 bath home has great curb appeal with its brick facade. Separate living, kitchen and dining. Covered front and back porch with fencing on three sides. This property has potential to be more than what meets the eye. If your are investing, buying or looking for a rental, come see today.
Key facts
- 4,050 sq ft lot
- Built 1945
- Listed 499 days
Tags
Neighborhood map
What this means for you Summary
Snapshot
- This is a 3-bed/1.0-bath single-family listed at $75k.
Deal economics
- At list price, monthly cash flow is $286 ($3k/yr) — positive.
- The deal already cash-flows at list — no discount required.
- Meets the 1% rule at list price ($1k rent vs $75k).
- Recommended offer: $66k (12.0% below list) — sets the bar for market timing.
- Cap rate 10.9% vs local median 3.6% in Corpus Christi — top-decile yield for the area; either an underpriced asset or a hidden risk that comps aren't pricing in. Stress-test before assuming the spread holds.
Location & tenants
- Location reads 78/100 on livability (#66 in TX, #2,404 nationally) — a middle-class / working-renter tenant base. Strengths: commute A+, cost of living A+, housing A+; Watch: crime F.
- Corpus Christi ISD (urban): math 31% / reading 35% proficiency, ranked #562 of 826 in TX (top 68%) — families likely to look elsewhere, expect single-tenant / working-renter base with shorter leases; 63% free/reduced lunch — lower-income household profile, screen leases tightly.
- Market conditions: 74 active listings in the ZIP; 24 comparable units currently listed for rent nearby; rentals at typical pace (median 21d on market — plan ~3-4 weeks tenant-placement turnaround); 46% of comp listings sitting > 30 days — soft ceiling on asking rent; lower-income renter base — watch delinquency; 1,397 units permitted in Nueces County in 2024 (47 in 5+ unit buildings).
- This rent runs 34% of the median local income ($38k/yr) — at the standard rent-burdened threshold; future hikes will face affordability resistance.
Forward outlook
- In year one you build about $2k of equity ($519 loan paydown + $1k appreciation (1.4% local appreciation)).
- Nueces County population projected at +36% by 2050 — long-run rental-demand tailwind backs the buy-and-hold thesis.
- At projected returns (1.4% appreciation + 3.0% rent growth), your $21k cash investment doubles in ~4 years — after that, you're playing with house money.
Negotiation context
- It's been on market 499 days — a 12% lower offer ($66k) is reasonable based on typical stale-listing flexibility.
- 3 sale attempts since 2y ago; this cycle's ask has dropped $35k (32%) from the opening price — seller is motivated, your offer sets the floor, not the list.
Risks & watch-outs
- Watch-outs: property tax is 2.5% of price; built in 1945 — expect roof / HVAC / electrical / plumbing capex.
- Climate carrying-cost: severe wind risk, 99% chance of damaging wind over 30y; extreme-heat days projected 7→25/yr by 2055 (HVAC capex compounding) — expect insurance premiums to compound above CPI over the hold.
Questions for the listing agent
- It's been on market 499 days. Have you received any prior offers? Is the seller open to a 12% concession, seller financing, or rate buy-down credit?
- Built in 1945 — when were the roof, HVAC, electrical panel, plumbing, and water heater last replaced?
- Property tax is high relative to price — has the assessment been appealed recently, and will the sale trigger a re-assessment?
- Why hasn't it sold? Are there any deal-killer items the seller is aware of (foundation, flood, title, zoning, code violations)?
- Is there a deadline driving the sale (1031 exchange, divorce, estate, relocation)? That informs how much negotiation room exists.
- Crime grade is F in this area — have there been break-ins, vandalism, or insurance claims at this property in the last 3 years? What carrier currently insures it and at what premium?
- What's the average days-on-market for RENTAL listings here right now (not sales)? A rising rental-DOM trend means longer vacancies and softer asking-rent achievability than the comps imply.
- What's the recent tenant-quality profile in this submarket — average credit score on applications, eviction rate, late-payment / NSF rate, and stable-employment percentage? A property-management company in the area should have these aggregated.
- How much new for-sale + rental construction is in the pipeline within 1–3 miles? Heavy new supply typically softens prices + rents 12–24 months out; constrained supply supports both.
Investment metrics
- 1% rule
- 1.46% ✓
- Cap rate
- 10.86%
- Cash-on-cash
- 16.32%
- DSCR
- 1.73
- GRM
- 5.7
CMA / ARV
- ARV (median comp)
- $75,524
- List price
- $75,000
- Delta
- -0.69%
- Verdict
- FAIR
- Comps
- 20 within 1.0 mi
Show comp detail 12 sales within ~0.75 mi
| Address | Dist | Beds/Ba | Sqft | Sold | Price | $/sf | Match |
|---|---|---|---|---|---|---|---|
| 334 Osage St | 0.19mi | 3/2.0 | 840 (-2%) | 10mo | $36,000 | $43 | 76 |
| 326 Virginia Ave | 0.39mi | 3/1.0 | 915 (+7%) | 3mo | $135,000 | $148 | 67 |
| 615 Dolores St | 0.23mi | 3/2.0 | 918 (+8%) | 8mo | $130,400 | $142 | 66 |
| 1205 Hibiscus St | 0.22mi | 2/1.0 (-1) | 800 (-6%) | 15mo | $25,000 | $31 | 62 |
| 214 Shawnee | 0.54mi | 3/1.0 | 922 (+8%) | 12mo | $119,000 | $129 | 51 |
| 2221 Cleo St | 0.58mi | 2/1.0 (-1) | 832 (-2%) | 16mo | $90,000 | $108 | 50 |
| 2506 Crews St | 0.58mi | 2/1.0 (-1) | 904 (+6%) | 10mo | $58,000 | $64 | 50 |
| 2624 Sonora St | 0.63mi | 2/1.0 (-1) | 808 (-5%) | 10mo | $39,900 | $49 | 49 |
| 3437 Southland Dr | 0.56mi | 3/1.0 | 904 (+6%) | 19mo | $99,900 | $111 | 48 |
| 202 Havana St | 0.66mi | 3/1.0 | 883 (+4%) | 19mo | $135,000 | $153 | 47 |
| 2507 Morris St | 0.53mi | 2/1.0 (-1) | 754 (-12%) | 5mo | $75,000 | $99 | 47 |
| 2818 Blake St | 0.53mi | 2/1.0 (-1) | 784 (-8%) | 19mo | $89,900 | $115 | 41 |
Match score weights: distance 35% · size 25% · config 20% · recency 20%. Top-matched comps best support the ARV.
Projected returns pro-forma
1.42% appreciation · 3.0% rent growth · sell at horizon
- IRR
- 19.3%
- Equity multiple
- 2.01×
- Total profit
- $21,208
- Equity at exit
- $27,259
- IRR
- 22.1%
- Equity multiple
- 3.77×
- Total profit
- $58,153
- Equity at exit
- $37,541
Cash invested: $21,000 (down + closing). Projections, not guarantees.
Landlord ↔ Tenant lean methodology
- Overall (STATE)
- 87 Strongly Landlord-Friendly
- State Texas
- 87 Strongly Landlord-Friendly · R+5
- County
- — inherits STATE
- City
- — inherits STATE
ZIP-level market 78405
- Home prices YoY
- 1.3%
- Active inventory
- 74
- Price-to-rent
- 5.7×
Monthly cashflow live
- Estimated rent
- $1,097 high interval (Pro) →
- Mortgage (P&I)
- −$393
- Tax from tax record
- −$157 /mo · $1,881/yr
- Insurance
- −$31
- HOA
- −$0
- Vacancy / Maint / Mgmt
- −$230
- Net cashflow
- $286
Break-even live
UW: 25.0% down · 7.5% · 30yr · 1.5% tax · 5.0% vac · 8.0% maint · 8.0% mgmt
Financing live
Cash to close
- Down payment
- $18,750
- Closing costs
- $2,250
- Reserves months
- —
- Total cash needed
- —
Loan-product check · same deal, 3 products live
Conventional
25% down · 7.5% · 30yr
- Down + closing
- —
- Monthly P&I
- —
- Monthly cashflow
- —
- DSCR
- —
- Eligible?
- —
Personal DTI + credit; lowest rate.
DSCR
20% down · 8.5% · 30yr
- Down + closing
- —
- Monthly P&I
- —
- Monthly cashflow
- —
- DSCR
- —
- Eligible?
- —
No personal income docs; deal must DSCR.
Hard money
10% down · 12.0% · 12mo
- Down + closing
- —
- Monthly P&I
- —
- Monthly cashflow
- —
- DSCR
- —
- Eligible?
- —
Short-term bridge; refi at stabilization.
Rent comps 24 comps
| Address | Beds | Baths | Sqft | Rent | $/sqft | DOM | Units | Dist |
|---|---|---|---|---|---|---|---|---|
| 2937 Ruth St Corpus Christi, TX | 2.0 | 1.0 | 676 | $950 | $1.41 | 43d | 1 | 0.11mi |
| 1114 25th St Corpus Christi, TX | 1.0–2.0 | 1.0 | 712 | $1,050 | $1.47 | 13d | 6 | 0.31mi |
| 3115 Agnes St Corpus Christi, TX | 2.0 | 1.0 | 428 | $828 | $1.93 | 43d | 3 | 0.39mi |
| 2402 Segrest St Corpus Christi, TX | 2.0 | 1.0 | 1120 | $825 | $0.74 | 21d | 1 | 0.52mi |
| 2522 Cleo St Corpus Christi, TX | 3.0 | 1.0 | 992 | $1,350 | $1.36 | 13d | 1 | 0.61mi |
| 2333 Riggan St Corpus Christi, TX | 2.0 | 1.0 | 856 | $1,250 | $1.46 | 43d | 1 | 0.87mi |
| 616 16th St Unit A Corpus Christi, TX | 3.0 | 1.0 | 1040 | $1,050 | $1.01 | 43d | 1 | 0.89mi |
| 1802 Morgan Ave Unit 1802 Corpus Christi, TX | 2.0 | 1.0 | 850 | $1,250 | $1.47 | 21d | 1 | 0.92mi |
| 2245 Comanche St Unit A Corpus Christi, TX | 3.0 | 1.0 | 1016 | $1,350 | $1.33 | 21d | 1 | 0.96mi |
| 3150 Elgin St Corpus Christi, TX | 2.0 | 1.0 | 616 | $925 | $1.50 | 43d | 1 | 0.99mi |
| 3302 Up River Rd Corpus Christi, TX | 2.0 | 1.0 | 710 | $699 | $0.98 | 13d | 1 | 0.99mi |
| 1525 S 19th St Unit B Corpus Christi, TX | 3.0 | 2.0 | 1062 | $2,100 | $1.98 | 13d | 1 | 1.03mi |
| 1433 12th St Corpus Christi, TX | 2.0 | 1.0 | 768 | $1,050 | $1.37 | 43d | 1 | 1.17mi |
| 1628 18th St Corpus Christi, TX | 2.0 | 1.0 | 1112 | $1,000 | $0.90 | 43d | 1 | 1.20mi |
| 116 Lowell St Corpus Christi, TX | 2.0 | 1.0 | 628 | $995 | $1.58 | 21d | 1 | 1.22mi |
| 1603 Caldwell St Corpus Christi, TX | 2.0 | 1.0 | 628 | $995 | $1.58 | 21d | 1 | 1.26mi |
| 1124 Morgan Ave Unit 1268437P Corpus Christi, TX | 2.0 | 1.0 | 721 | $2,081 | $2.89 | 43d | 1 | 1.32mi |
| 110 Josephine St Corpus Christi, TX | 3.0 | 2.0 | 1050 | $2,000 | $1.90 | 43d | 1 | 1.33mi |
| 1634 14th St Corpus Christi, TX | 2.0 | 1.5 | 980 | $1,090 | $1.11 | 43d | 1 | 1.36mi |
| 3762 Up River Rd Corpus Christi, TX | 1.0–2.0 | 1.0–2.0 | 855 | $1,199 | $1.40 | 13d | 6 | 1.36mi |
| 1521 7th St Corpus Christi, TX | 2.0 | 2.0 | 850 | $1,250 | $1.47 | 13d | 1 | 1.47mi |
| 725 Villa Dr Unit 7 Corpus Christi, TX | 2.0 | 1.0 | 628 | $649 | $1.03 | 43d | 1 | 1.48mi |
| 826 Hancock Ave Unit 2 Corpus Christi, TX | 2.0 | 1.0 | 1000 | $950 | $0.95 | 21d | 1 | 1.48mi |
| 725 Villa Dr Corpus Christi, TX | 2.0 | 1.0 | 650 | $649 | $1.00 | 13d | 1 | 1.50mi |
Listing history 24 events
-
2026-06-18days on market $75,000 Active 499 DOM
-
2026-06-17days on market $75,000 Active 498 DOM
-
2026-06-16days on market $75,000 Active 497 DOM
-
2026-06-15days on market $75,000 Active 496 DOM
-
2026-06-14days on market $75,000 Active 494 DOM
-
2026-06-10days on market $75,000 Active 491 DOM
-
2026-06-09days on market $75,000 Active 490 DOM
-
2026-06-08days on market $75,000 Active 489 DOM
-
2026-06-07days on market $75,000 Active 488 DOM
-
2026-06-05days on market $75,000 Active 485 DOM
-
2026-06-03days on market $75,000 Active 484 DOM
-
2026-06-02days on market $75,000 Active 483 DOM
-
2026-06-01days on market $75,000 Active 482 DOM
-
2026-05-31days on market $75,000 Active 481 DOM
-
2026-05-30days on market $75,000 Active 480 DOM
-
2026-02-08price $75,000 301-char remark
Show marketing remark (301 chars)
This 3 bedroom 1 bath home has great curb appeal with its brick facade. Separate living, kitchen and dining. Covered front and back porch with fencing on three sides. This property has potential to be more than what meets the eye. If your are investing, buying or looking for a rental, come see today.
-
2025-12-13status Active 301-char remark
Show marketing remark (301 chars)
This 3 bedroom 1 bath home has great curb appeal with its brick facade. Separate living, kitchen and dining. Covered front and back porch with fencing on three sides. This property has potential to be more than what meets the eye. If your are investing, buying or looking for a rental, come see today.
-
2025-11-11status Pending 301-char remark
Show marketing remark (301 chars)
This 3 bedroom 1 bath home has great curb appeal with its brick facade. Separate living, kitchen and dining. Covered front and back porch with fencing on three sides. This property has potential to be more than what meets the eye. If your are investing, buying or looking for a rental, come see today.
-
2025-11-09historical 301-char remark
Show marketing remark (301 chars)
This 3 bedroom 1 bath home has great curb appeal with its brick facade. Separate living, kitchen and dining. Covered front and back porch with fencing on three sides. This property has potential to be more than what meets the eye. If your are investing, buying or looking for a rental, come see today.
-
2025-05-31status Active 301-char remark
Show marketing remark (301 chars)
This 3 bedroom 1 bath home has great curb appeal with its brick facade. Separate living, kitchen and dining. Covered front and back porch with fencing on three sides. This property has potential to be more than what meets the eye. If your are investing, buying or looking for a rental, come see today.
-
2025-05-31price $85,000 301-char remark
Show marketing remark (301 chars)
This 3 bedroom 1 bath home has great curb appeal with its brick facade. Separate living, kitchen and dining. Covered front and back porch with fencing on three sides. This property has potential to be more than what meets the eye. If your are investing, buying or looking for a rental, come see today.
-
2025-05-02status Pending 301-char remark
Show marketing remark (301 chars)
This 3 bedroom 1 bath home has great curb appeal with its brick facade. Separate living, kitchen and dining. Covered front and back porch with fencing on three sides. This property has potential to be more than what meets the eye. If your are investing, buying or looking for a rental, come see today.
-
2025-04-16price $99,900 301-char remark
Show marketing remark (301 chars)
This 3 bedroom 1 bath home has great curb appeal with its brick facade. Separate living, kitchen and dining. Covered front and back porch with fencing on three sides. This property has potential to be more than what meets the eye. If your are investing, buying or looking for a rental, come see today.
-
2024-11-13$110,000 Active 301-char remark
Show marketing remark (301 chars)
This 3 bedroom 1 bath home has great curb appeal with its brick facade. Separate living, kitchen and dining. Covered front and back porch with fencing on three sides. This property has potential to be more than what meets the eye. If your are investing, buying or looking for a rental, come see today.
ⓘ Source: listings_history table (triggers on properties + properties_extension) + one-shot
backfill from property_details.listing_events for pre-trigger history.
Tax reassessment forecast TX · Resets to sale price
- Current annual tax
- $1,881 · $157/mo
- Projected year-2 tax
- $1,881 · $157/mo
- Expected delta
- $0/yr ($0/mo · 0.0%)
ⓘ Screening estimate from a state-policy table — verify with the county assessor before closing.
Climate risk First Street
- Flood 3/10 Moderate FEMA zone X (unshaded) · 20% chance over 30 yrs
- Wildfire 1/10 Low
- Heat 10/10 Extreme 7 d/yr ≥107°F today · 25 d/yr by 30 yrs out
- Wind 9/10 Extreme 99% chance of damaging wind over 30 yrs
- Air quality 1/10 Low 0 unhealthy d/yr today · 0 by 30 yrs out
Nearby sold comps map
Loading sold comps map…
Walkable amenities ~0.75 mi
Loading nearby amenities…
Taxation est. · year 1
- Rental income
- $13,169
- − Mortgage interest
- −$4,201
- − Property taxes
- −$1,881
- − Insurance
- −$375
- − Repairs & maintenance
- −$1,054
- − Management
- −$1,054
- − Depreciation
- −$2,182
- Taxable income
- $2,423
- Est. tax owed @ 24.0%
- −$582
- After-tax cash flow
- $2,846/yr
For passive investors: Depreciation is non-cash, so a rental often shows a tax loss while cash-flowing — sheltering income. Rental losses are passive: they offset passive income freely, and up to $25,000/yr can offset ordinary (W-2) income if you actively participate and your MAGI is under $100k (phasing out to $0 by $150k); unused losses carry forward. On sale, claimed depreciation is recaptured at up to 25%, and gains may owe capital-gains tax (a 1031 exchange can defer both). Figures are a year-1 estimate at your 24.0% rate — not tax advice; consult a CPA.
Schools (NCES district)
- District
- Corpus Christi ISD
- NCES district ID
- 4815270
- Math proficiency
- 31% ▼ -18.00%
- Reading proficiency
- 35% ▼ -7.00%
- Median HH income
- $45,672
- Composite
- 28.27/100
- National rank
- #6793
- State rank
- #562 of 826 in TX
Livability — Corpus Christi
- Score
- 78/100
- State rank
- #66
- US rank
- #2404
Category grades
Schools grade is shown separately in the Schools card above.
Census & demographics
- Census place
- Corpus Christi, TX
- County
- Nueces County · 296,836 people
- City population
- 296,836
- Metro
- Corpus Christi, TX
- Population (ZIP)
- 14,602
- Household income
- $38,294
- Rent vs Own
- Severe rent burden
- 867.0
Population outlook (Nueces County) Hauer SSP2
- Today (2025)
- 418,037 people
- By 2030
- 447,123 · +7.0%
- By 2040
- 505,911 · +21.0%
- By 2050
- 567,522 · +35.8%
- By 2075
- 729,686 · +74.6%
- By 2100
- 847,087 · +102.6%
Race, ethnicity, and origin ACS 2023
- Neighborhood character
- Predominantly Hispanic (91%)
- Race & ethnicity
- Hispanic / Latino 91% Two or more races 48% Black 4% White 4%
- Hispanic origin (detail)
- Mexican 83%
- Foreign-born
- 18% · Canada
- Languages at home
- 52% English-only · Spanish 48%
Political lean MEDSL · Nueces
- 2024 margin
- R (+11.5) · D 43.8% · R 55.3%
- 2008→2024 swing
- -7.1pp toward R · 2008: -4.4pp · 2024: -11.5pp
- All cycles
- 2024: R+11.5 2020: R+2.9 2016: R+1.5 2012: R+3.2 2008: R+4.4
Not yet ingested
- Civics
- —
Market trends
- HPI YoY
- ▲ 1.42%
- Current HPI
- 113.2227
- Rent YoY
- —
- Metro
- Corpus Christi, TX
- State GDP YoY
- ▲ 3.95%
- F500 in state
- 110
Industry mix (Fortune 500 HQ in TX)
| Industry | F500 HQs | Revenue |
|---|---|---|
| Energy | 16 | $1,198B |
|
||
| Technology | 5 | $198B |
|
||
| Engineering / Construction | 4 | $72B |
|
||
| Energy Services | 3 | $60B |
|
||
| Utilities | 3 | $41B |
|
||
| Healthcare | 2 | $330B |
|
||
Price history
-31.8% since first listed9 events — show timeline
- 2026-02-08 Price Changed $75,000 CBMLS
- 2025-12-13 Relisted — CBMLS
- 2025-11-11 Pending — CBMLS
- 2025-11-09 Delisted — CBMLS
- 2025-05-31 Relisted — CBMLS
- 2025-05-31 Price Changed $85,000 CBMLS
- 2025-05-02 Pending — CBMLS
- 2025-04-16 Price Changed $99,900 CBMLS
- 2024-11-13 Listed $110,000 CBMLS
Property tax history
+8.9%/yrLatest (2025): $1,881 · +2.7% YoY. Source: county tax records.
Cash-flow waterfall
monthlySold comps — $/sqft
last 12 mo · ≤1 miLoading sold comps…